Visualize Real-Time Data With Python, Dash, and RisingWave
This article explains how to use Python, Dash open-source library, and RisingWave to make visualizations of real-time data.
Join the DZone community and get the full member experience.
Join For FreeReal-time data is important for businesses to make quick decisions. Seeing this data visually can help make decisions even faster. We can create visual representations of data using various data apps or dashboards. Dash is an open-source Python library that provides a wide range of built-in components for creating interactive charts, graphs, tables, and other UI elements. RisingWave is a SQL-based streaming database for real-time data processing. This article will explain how to use Python, Dash, and RisingWave to make visualizations of real-time data.
How To Visualize Data in Real-Time
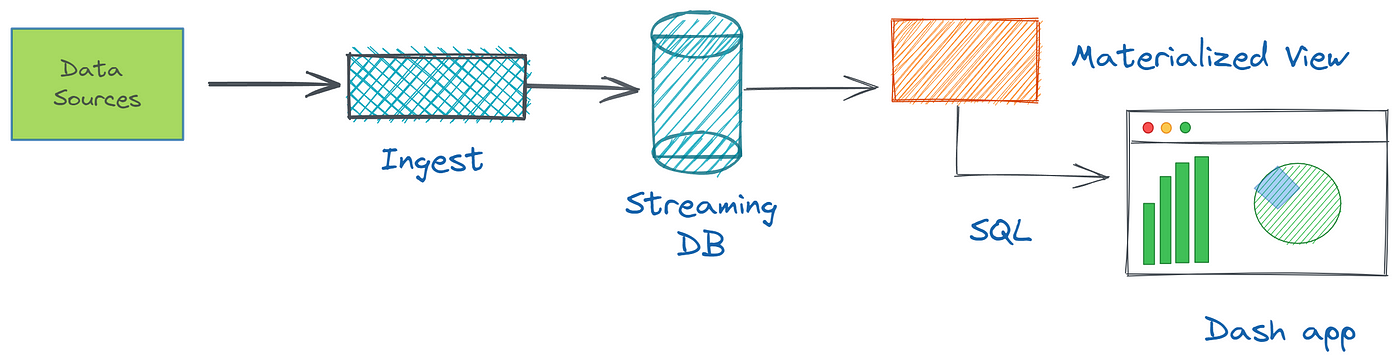
We know that real-time data is data that is generated and processed immediately, as it is collected from different data sources. Sources can be typical databases such as Postgres or MySQL, and message brokers like Kafka. A real-time data visualization consists of a few steps: first, we ingest, then process, and finally show this data in a dashboard.
In the case of order delivery data, visualizing this data in real time can provide valuable insights into the performance of a restaurant or delivery service. For example, we can use real-time data to monitor how long it takes for orders to be delivered, identify bottlenecks in the delivery process, and track changes in order volume over time. When dealing with data that is constantly changing, it can be difficult to keep track of everything that is happening and identify patterns or trends. Using free tools such as Dash, and RisingWave, we can create interactive visualizations that allow us to explore and analyze this continually changing data.
When it comes to working with data, the first programming language you might think of is Python, because has a range of libraries. Dash is one of them that allows us to create a data app with a rich and customizable user interface using only Python code. Dash is built on top of Flask, Plotly.js, and React.js, which are popular web development tools so you do not need to know HTML, CSS, or other JavaScript frameworks.
With RisingWave, we can consume data streams from various sources, create materialized views that are optimized for complex queries, and query real-time data using SQL. As RisingWave is wire-compatible with PostgreSQL, we can use the psycopg2 (PostgreSQL client library in Python) driver to connect to RisingWave, and make query operations. See in the next section.
Visualize Order Delivery Data Demo
In the demo tutorial, we’ll leverage the following GitHub repository with RisingWave demos where we assume that all necessary things are set up using Docker Compose. You can check other ways to run RisingWave on the official website. We have a Kafka topic named delivery_orders that contains events for every order placed on a food delivery website. Each event includes information about the order, such as the order ID, restaurant ID, and delivery status. The workload generator (Python script called Datagen) simulates generating of random mock data continuously and streams them into Kafka topics. In reality, this mock data can be replaced with data coming from your web app or backend service.
Before You Begin
To complete this tutorial, you need the following:
- Ensure you have Docker and Docker Compose installed in your environment.
- Ensure that the PostgreSQL interactive terminal, psql, is installed in your environment. For detailed instructions, see Download PostgreSQL.
- Download and install Python 3 for your OS.
pipthe command will be automatically installed.
The demo I tested on Windows OS, Docker desktop, and Python 3.10.11version installed.
Step 1: Setting Up RisingWave’s Demo Cluster
First, clone the RisingWave sample repository to your local environment.
git clone <https://github.com/risingwavelabs/risingwave.git>
Then, the integration_tests/delivery directory and start the demo cluster from the docker compose file.
cd risingwave/integration_tests/delivery
docker compose up -d
Make sure that all containers are up and running!
Step 2: Install Dash and Psycopg2 Libraries
To install Dash, you can also refer to the Dash installation guide on the website. Basically, we need to install two libraries (Dash itself and Pandas) by running the following pip install command:
# This also brings along the Plotly graphing library.
# Plotly is known for its interactive charts
# Plotly Express requires Pandas to be installed too.
pip install dash pandas
We should also install psycopg2 to interact with the RisingWave streaming database:
pip install psycopg2-binary
Step 3: Create a Data Source
To ingest real-time data with RisingWave, you first need to set up a data source. In the demo project, Kafka should be defined as the data source. We are going to create a new file called create-a-source.py, the same integration_tests/delivery directory with Python script where we connect to the RisingWave, and create a table to consume and persist delivery_orders Kafka topics. You can simply copy and paste the below code into the new file.
import psycopg2

conn = psycopg2.connect(database="dev", user="root", password="", host="localhost", port="4566") # Connect to RisingWave.

conn.autocommit = True # Set queries to be automatically committed.

with conn.cursor() as cur:
    cur.execute("""
CREATE TABLE delivery_orders_source (
    order_id BIGINT,
    restaurant_id BIGINT,
    order_state VARCHAR,
    order_timestamp TIMESTAMP
) WITH (
    connector = 'kafka',
    topic = 'delivery_orders',
    properties.bootstrap.server = 'message_queue:29092',
    scan.startup.mode = 'earliest'
) ROW FORMAT JSON;""") # Execute the query.

conn.close() # Close the connection.
After you create the file, you run python create-a-source.py and it will create the source table in the RisingWave.
Step 4: Create a Materialized View
Next, we create a new materialized view similar to how we created the table. We create a new file called create-a-materialized-view.py and run an SQL query using the psycopg2 library. It is also possible to merge the above last two steps into one Python script file.
import psycopg2

conn = psycopg2.connect(database="dev", user="root", password="", host="localhost", port="4566")
conn.autocommit = True

with conn.cursor() as cur:
    cur.execute("""CREATE MATERIALIZED VIEW restaurant_orders_view AS
SELECT
    window_start,
    restaurant_id,
    COUNT(*) AS total_order
FROM
    HOP(delivery_orders_source, order_timestamp, INTERVAL '1' MINUTE, INTERVAL '15' MINUTE)
WHERE
        order_state = 'CREATED'
GROUP BY
    restaurant_id,
    window_start;""")

conn.close()
Above, the SQL query calculates the number of total orders created from a specific restaurant within the last 15 mins in real time and caches the result in the materialized view. If there any data change happens or new Kafka topics arrive, RisingWave automatically increments and updates the result of the materialized view. Once you have set up the data source, materialized view, you can start ingesting data and visualize this data using Dash.
Step 5: Building a Dash App
Now we build our Dash app to query and visualize the materialized view content we have in the RisingWave. You can follow the tutorial Dash in 20 mins to understand the basic building blocks of Dash. Our example application code displays restaurant order data in both table and graph formats. See the below Python code in dash-example.py :
import psycopg2
import pandas as pd
import dash
from dash import dash_table
from dash import dcc
import dash_html_components as html
import plotly.express as px

# Connect to the PostgreSQL database
conn = psycopg2.connect(database="dev", user="root", password="", host="localhost", port="4566")

# Retrieve data from the materialized view using pandas
df = pd.read_sql_query("SELECT window_start, restaurant_id, total_order FROM restaurant_orders_view;", conn)

# Create a Dash application
app = dash.Dash(__name__)

# Define layout
app.layout = html.Div(children=[
    html.H1("Restaurant Orders Table"),
    dash_table.DataTable(id="restaurant_orders_table", columns=[{"name": i, "id": i} for i in df.columns], data=df.to_dict("records"), page_size=10),
    html.H1("Restaurant Orders Graph"),
    dcc.Graph(id="restaurant_orders_graph", figure=px.bar(df, x="window_start", y="total_order", color="restaurant_id", barmode="group"))
])

# Run the application
if __name__ == '__main__':
    app.run_server(debug=True)
This code snippet retrieves the data from the restaurant_orders_view materialized view using pandas and displays it in a Dash table using dash_table.DataTable and a bar chart using dcc.Graph. The table and bar chart have columns that correspond to the columns in the materialized view ('window_start', 'total_order', and 'restaurant_id’) and rows that correspond to the data in the materialized view.
Step 6: View the Results
You can run the application by running the above dash-example.py script and navigating to http://localhost:8050/ in your web browser (you will get a message in the terminal telling you to go to this link).
Summary
Overall, Dash is a powerful tool for creating data analytic views that require complex UIs and data visualization capabilities, all using the simplicity and elegance of the Python programming language. When we use it together with RisingWave streaming database, we gain insights into real-time data which can help us make more informed decisions and take action to optimize performance.
Related Resources
Published at DZone with permission of Bobur Umurzokov. See the original article here.
Opinions expressed by DZone contributors are their own.
Comments