Visualize your Apache Kafka Streams using the Quarkus Dev UI
Visualize your Apache Kafka Streams using the Quarkus Dev UI
Join the DZone community and get the full member experience.
Join For FreeThis article shows how you can visualize Apache Kafka Streams with reactive applications using the Dev UI in Quarkus. Quarkus, a Java framework, provides an extension to utilize the Kafka Streams API and also lets you implement stream processing applications based directly on Kafka.
Reactive messaging and Apache Kafka
With the rise of event-driven architectures, many developers are adopting reactive programming to write business applications. The requirements for these applications literally specify that they not be processed in real-time because end users don't really expect synchronous communication experiences through web browsers or mobile devices. Instead, low latency is a more important performance criterion, regardless of data volume or concurrent users.
You might be wondering how reactive programming could meet this very different goal. The secret is an asynchronous communication protocol that decouples senders from the applications that consume and process events. In this design, a caller (e.g., end-user) sends a message to a recipient and then keeps processing other requests without waiting for the reply. Asynchronous processing can also improve high-volume data performance, security, and scalability.
However, it's not easy to implement everything involved in asynchronous communication capabilities with just reactive programming. This is the reason that message-queue platforms have also come to occupy a critical role in event-driven applications. Apache Kafka is one of the most popular platforms for processing event messages asynchronously to support reactive applications. Kafka Streams is a client library that abstracts changing event data sets (also known as streams) continuously in Kafka clusters to support high throughput and scalability. A stream is a collection of data records in the form of key-value pairs.
Example: Using the Quarkus Dev UI
Take a look at the following getMetaData() method to see how Quarkus lets you issue interactive queries to Kafka Streams using a KafkaStreams injection. Find the complete code in the Quarkus Kafka Streams Quickstart.
    @Inject
    KafkaStreams streams;

    public List<PipelineMetadata> getMetaData() {
        return streams.allMetadataForStore(TopologyProducer.WEATHER_STATIONS_STORE)
                .stream()
                .map(m -> new PipelineMetadata(
                        m.hostInfo().host() + ":" + m.hostInfo().port(),
                        m.topicPartitions()
                                .stream()
                                .map(TopicPartition::toString)
                                .collect(Collectors.toSet())))
                .collect(Collectors.toList());
    }
Kafka Streams also lets you build a process topology that represents a graph of sources, processors, and sinks in Kafka topics. Of course, you can monitor the streams using command-line tools (such as kcat), but the text-based output doesn't make it easy to understand how the streams are processing and consuming messages across Kafka topics.
Take a look at another example. The buildTopology() method lets you build the stream's topology. Find the complete code in the Quarkus Kafka Streams Quickstart.
    @Produces
    public Topology buildTopology() {
        StreamsBuilder builder = new StreamsBuilder();

        ObjectMapperSerde<WeatherStation> weatherStationSerde = new ObjectMapperSerde<>(WeatherStation.class);
        ObjectMapperSerde<Aggregation> aggregationSerde = new ObjectMapperSerde<>(Aggregation.class);

        KeyValueBytesStoreSupplier storeSupplier = Stores.persistentKeyValueStore(WEATHER_STATIONS_STORE);

        GlobalKTable<Integer, WeatherStation> stations = builder.globalTable(
                WEATHER_STATIONS_TOPIC,
                Consumed.with(Serdes.Integer(), weatherStationSerde));

        builder.stream(
                TEMPERATURE_VALUES_TOPIC,
                Consumed.with(Serdes.Integer(), Serdes.String()))
                .join(
                        stations,
                        (stationId, timestampAndValue) -> stationId,
                        (timestampAndValue, station) -> {
                            String[] parts = timestampAndValue.split(";");
                            return new TemperatureMeasurement(station.id, station.name, Instant.parse(parts[0]),
                                    Double.valueOf(parts[1]));
                        })
                .groupByKey()
                .aggregate(
                        Aggregation::new,
                        (stationId, value, aggregation) -> aggregation.updateFrom(value),
                        Materialized.<Integer, Aggregation> as(storeSupplier)
                                .withKeySerde(Serdes.Integer())
                                .withValueSerde(aggregationSerde))
                .toStream()
                .to(
                        TEMPERATURES_AGGREGATED_TOPIC,
                        Produced.with(Serdes.Integer(), aggregationSerde));

        return builder.build();
    }
Visualize the Kafka Streams topology
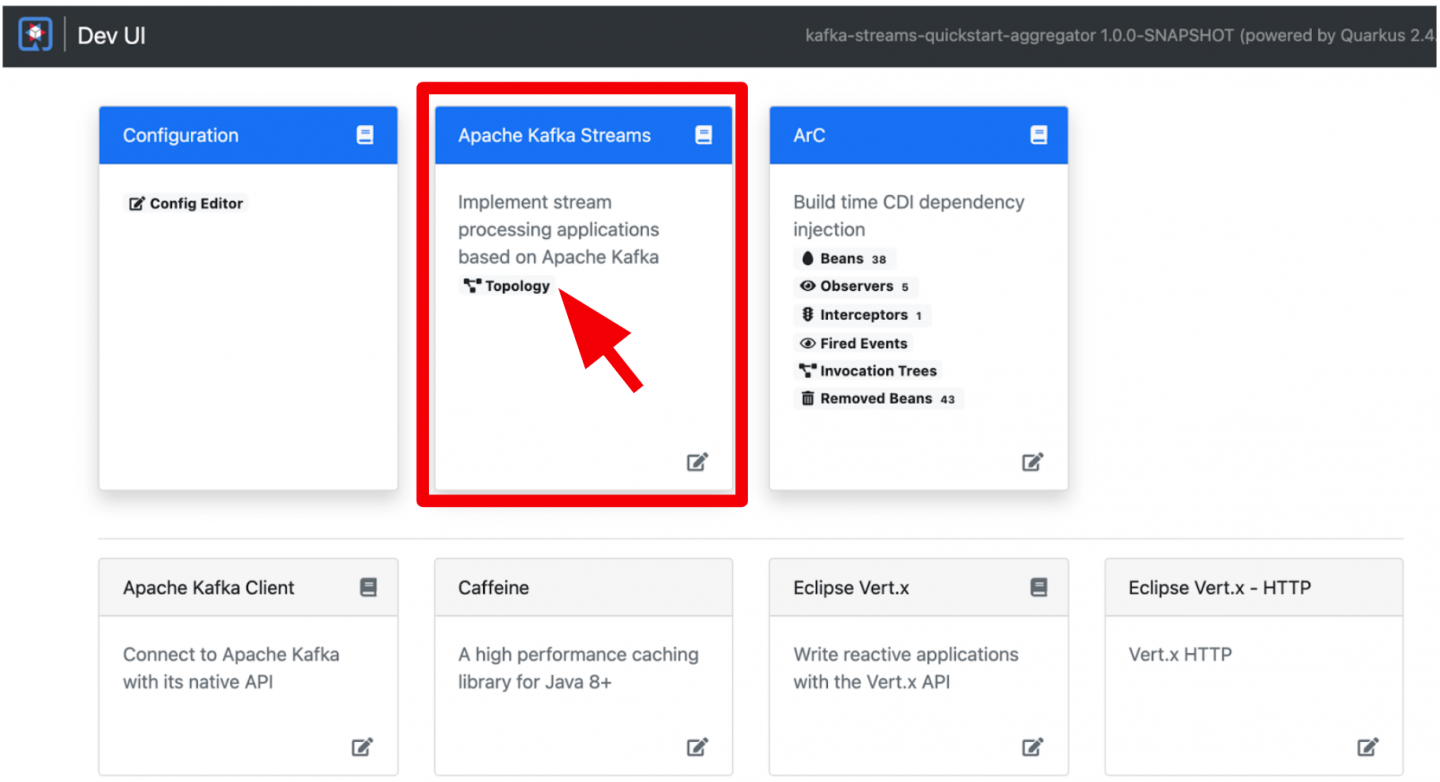
To visualize the Kafka Streams topology, developers traditionally needed additional visualizer tools that run in the cloud or local development environments separately from Kafka clusters. But Quarkus's built-in Dev UI lets you see all the extensions currently loaded with relevant documentation. When you run Quarkus Dev Mode (e.g., ./mvnw quarkus:dev) and add a quarkus-kafka-streams extension in a project, the Dev UI shows the Apache Kafka Streams extension graphically (Figure 1).
When you click on the Topology icon, it brings you to the Kafka Streams topology UI (Figure 2).
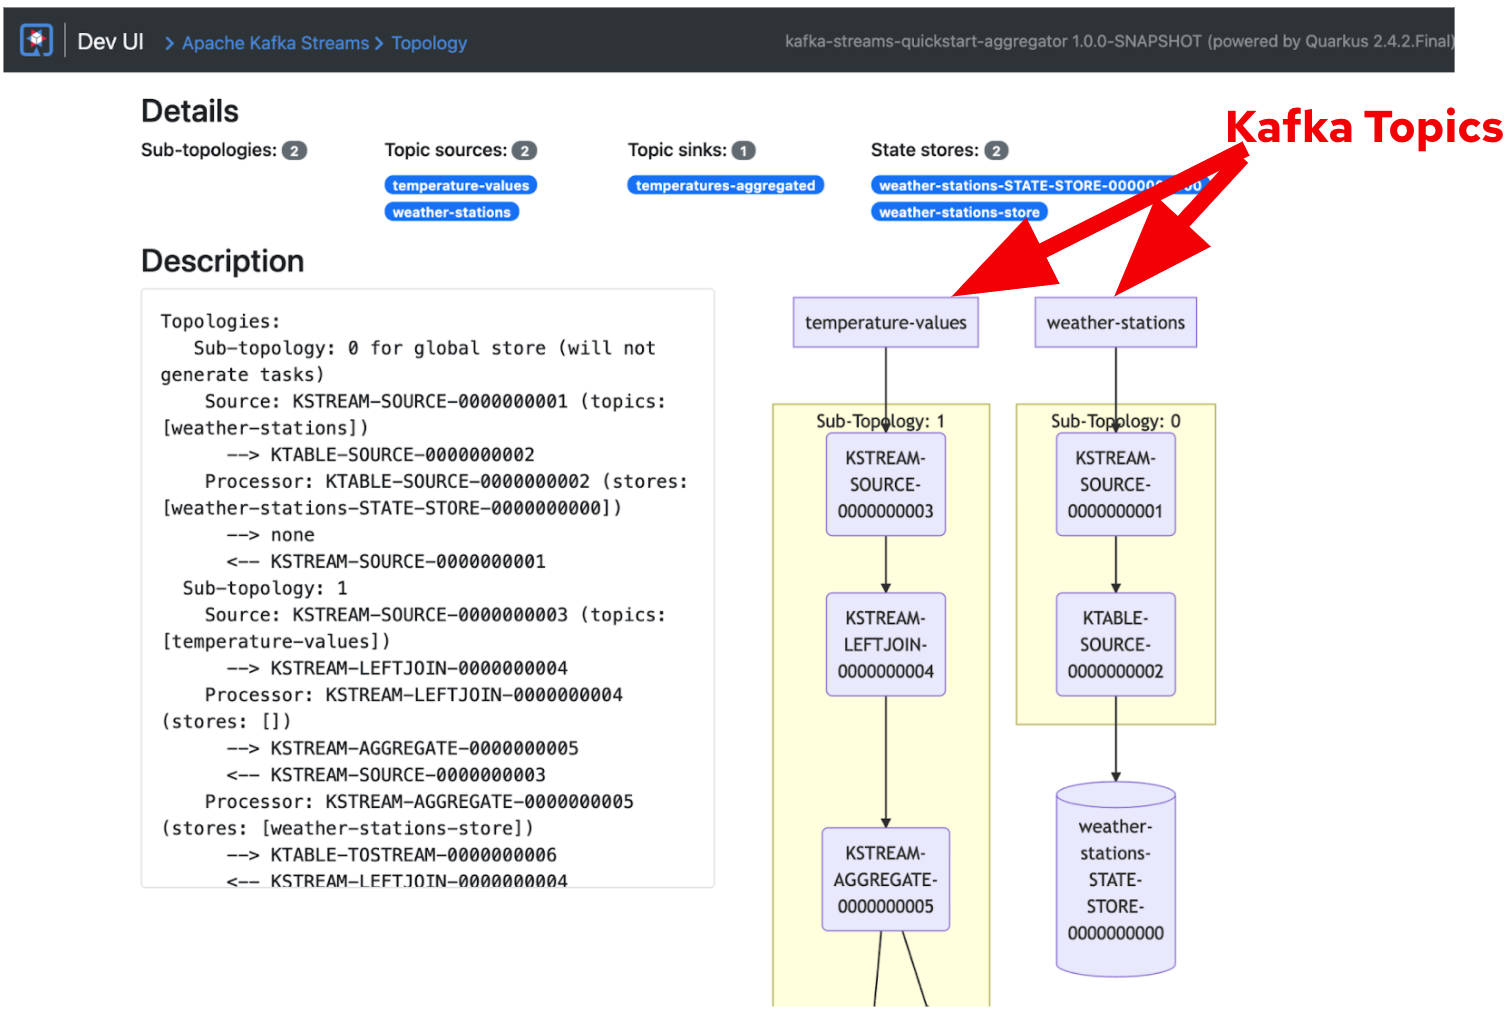
The topology UI shows how the event streams sink in topics (e.g., temperature-values) and how Quarkus applications consume the streams from the topics. Also, you can understand how the application eventually aggregates streams from multiple topics (temperature-values and weather-stations) to one topic (temperatures-aggregated). The Topology UI also showcases the sequences on how the streams are sourced, joined, and aggregated continuously in Kafka clusters.
Where to learn more
This article has shown how to visualize Kafka Streams with Quarkus applications and the Dev UI. Quarkus also provides awesome features to improve your productivity through continuous testing, the Quarkus command-line interface (CLI), and Dev Services. To learn more about Kafka and reactive messaging programming, see the following articles:
- Getting Started to SmallRye Reactive Messaging with Apache Kafka
- How do I run Apache Kafka on Kubernetes?
- Level-up your gaming telemetry using Kafka Streams
- Outbox pattern with OpenShift Streams for Apache Kafka and Debezium
- Kafka at the Edge: an IoT scenario with OpenShift Streams for Apache Kafka
Subscribe to bit.ly/danielohtv for learning cloud-native application development with Kubernetes.
Opinions expressed by DZone contributors are their own.
Comments