Visualizing the Istio Service Mesh Using Kiali
Kiali lets you monitor, visualize, and configure the Istio Service Mesh from within a single user interface. We dive into this platform in this post.
Join the DZone community and get the full member experience.
Join For FreeKiali lets you monitor, visualize, and configure the Istio Service Mesh from within a single user interface. Kiali lets you view configurations, monitor traffic flow between services, and analyze traces. It provides visibility into features likes service health, request routing, circuit breakers, request rate, traffic flow, error rates, and more.
Once you have a number of services deployed inside the service mesh, you will have a number of questions around Istio observability:
- How are the microservices connected inside the service mesh?
- How much traffic is going to each service inside the service mesh?
- How are the microservices performing (response time and requests per second, etc.)?
- Are any of the microservices in an unhealthy state?
- How can I troubleshoot issues with services running inside the service mesh?
Kiali provides the answers to the above questions and provides a big picture of the service mesh. Having observability into the service mesh is critical and you need to have a good overall view of the services running inside the service mesh to ensure it is healthy and you have the ability to identify issues faster.
Kiali Architecture
In Istio, all the metrics data is collated by Mixer and stored in Prometheus. Kiali uses the data stored in Prometheus to show the Service Mesh topology, metrics, traffic information, and more. Without access to Prometheus, Kiali won't be able to display any of the metrics.
You can integrate Jaeger and Grafana with Kiali so that you can view all the required information from the Kiali UI. Kiali does not allow to customize the views/graphs, however you can customize the dashboards and views in Grafana if you have a requirement.
Learn more about Kiali Architecture here.
Kiali Features
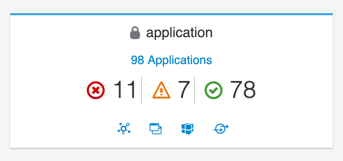
You can see the overview of applications running inside the service mesh.
In the below capture, there are 11 applications throwing Errors, 7 applications are in a Degraded state and 78 applications are in a Healthy state.
For any selected service, you can view the summary of the Traffic containing the Requests per second as well as the number of 200/3XX/4XX/5XX response.
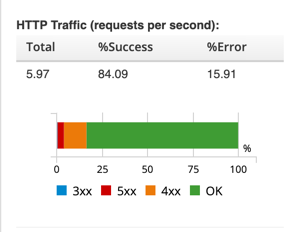
Colors in the graph represents the health of the service inside the mesh. As you can predict, green lines denote healthy components and red/orange lines denote that this mesh needs some attention.

You can view detailed metrics for your application in terms of request and response time. The traffic can be viewed for both inbound or outbound traffic.

Kiali includes Jaeger Tracing to provide distributed tracing out of the box. You can trace the request across a number of services and identify performance and latency issues.

Service to service communication can be displayed in a graph format. This is a powerful feature to visualize the service mesh topology and view the traffic rates and latencies between the services. This is extremely helpful to identify problem areas within your microservice architecture.

The App Graph selected below does not show service versions. If you want to view the various service versions, you can select the 'Versioned app' option.
' Traffic Animation' is a cool feature which you can enable under 'Display,' which shows real-time requests moving between services.

Enable 'Traffic rate per second' on the graph to view the traffic received by each of the microservice inside the service mesh.

Enable 'Response time for the 95th percentile' on the graph to view the service to service interaction performance. This is very helpful in identifying the slowest service and any related performance issues.
 Conclusion
Kiali is an open source project designed for getting observability into your service mesh architecture. Kiali indicates the overall health of the mesh and brings forward any issues with the services. I hope more features are built into Kiali in upcoming days to provide additional insights into the Istio Service Mesh.
If you want to deep dive into Kiali's capabilities I would highly recommend you to go through the resources below:
Published at DZone with permission of Samir Behara. See the original article here.
Opinions expressed by DZone contributors are their own.
Comments