Visualizing What a Neural Network Thinks
We will see how to visualize saliency maps and get an idea of what a neural network considers important in an image.
Join the DZone community and get the full member experience.
Join For FreeOk, Neural Networks don’t really "think", but they surely have an opinion. If you feed a Convolutional Neural Network, let’s say, a classifier with an image, it will tell you what it "thinks" is there, but sometimes you might wonder what contributed to that particular decision, as an attempt to try to "debug" your network.
For example, when designing a gender classification Neural Network, I noticed that the network was paying attention to the ears, and it learned to recognize them. It turned out ears can be used to detect gender, so it was a good sign that my network was looking for them.
In the rest of the article, we will see how to use saliency maps to get an idea of what a Neural Network considers important. The following content is mostly an extract from the book Hands-On Vision and Behavior for Self-Driving Cars that I wrote for Packt Publishing, with the help of Krishtof Korda; in the previous part of the chapter, we trained a Neural Network to learn how to self-drive a car in the simulator Carla, and the model of the network is stored in a variable called model.
Visualizing the Saliency Maps
To understand what the neural network is focusing its attention on, we should use a practical example, so let’s choose an image:
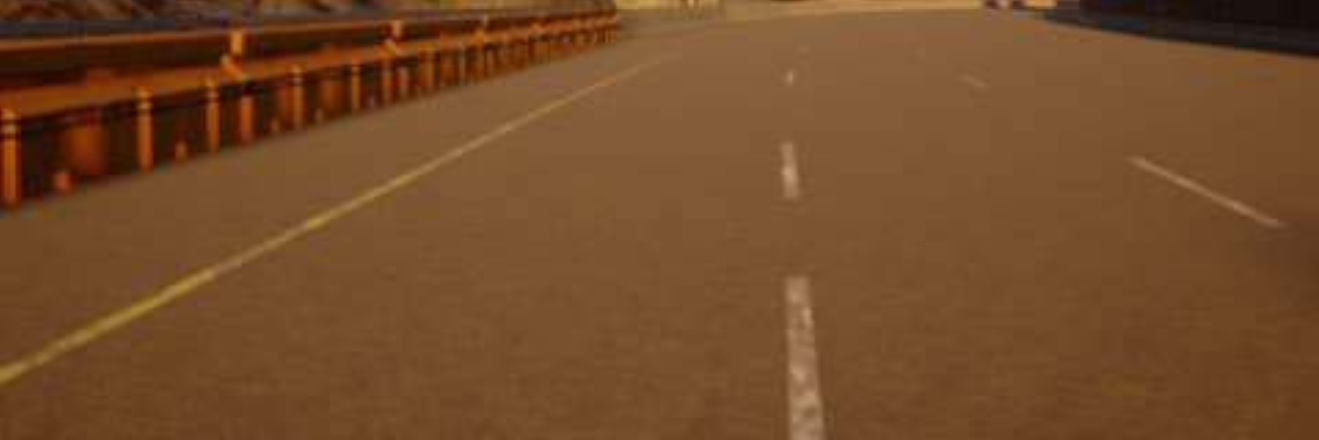 Test image
If we had to drive on this road, as humans, we would pay attention to the lanes and the wall, though admittedly, the wall is not as important as the last lane is before that.
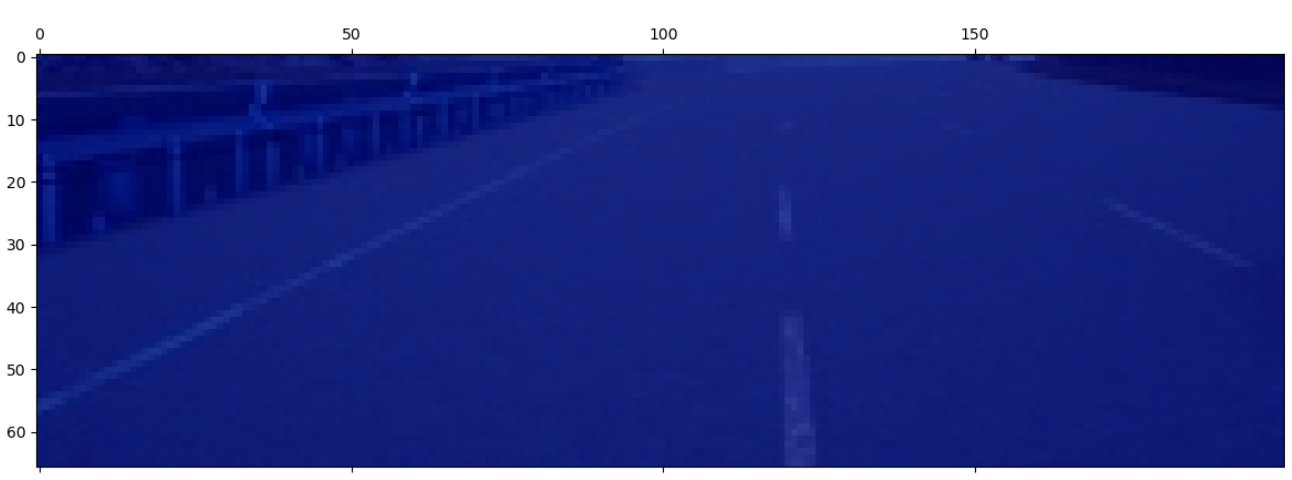
We already know how to get an idea of what a CNN (short for Convolutional Neural Network) such as DAVE-2 is taking into consideration: as the output of a convolution layer is an image, we can visualize it as follows:
 Part of the activations of the first convolutional layer
This is a good starting point, but we would like something more. We would like to understand which pixels contribute the most to the prediction. For that, we need to get a saliency map.
Keras does not directly support them, but we can use keras-vis. You can install it with pip, as follows:
sudo pip install keras-visThe first step to getting a saliency map is to create a model that starts with the input of our model but ends with the layer that we want to analyze. The resulting code is very similar to what we saw for the activations, except that for convenience, we also need the index of the layer:
conv_layer, idx_layer = next((layer.output, idx) for idx, layer in enumerate(model.layers) if
                                 layer.output.name.startswith(conv_name))

act_model = models.Model(inputs=model.input, outputs=[conv_layer])
While not necessary in our case, you might want to change the activation to become linear, then reload the model:
conv_layer.activation = activations.linear
sal_model = utils.apply_modifications(act_model)
Now, it is just a matter of calling visualize_saliency():
grads = visualize_saliency(sal_model, idx_layer,
filter_indices=None, seed_input=img)
plt.imshow(grads, alpha=.6)
We are interested in the saliency map of the last layer, the output, but as an exercise, we will go through all the convolutional layers to see what they understand.
First Test Visualization
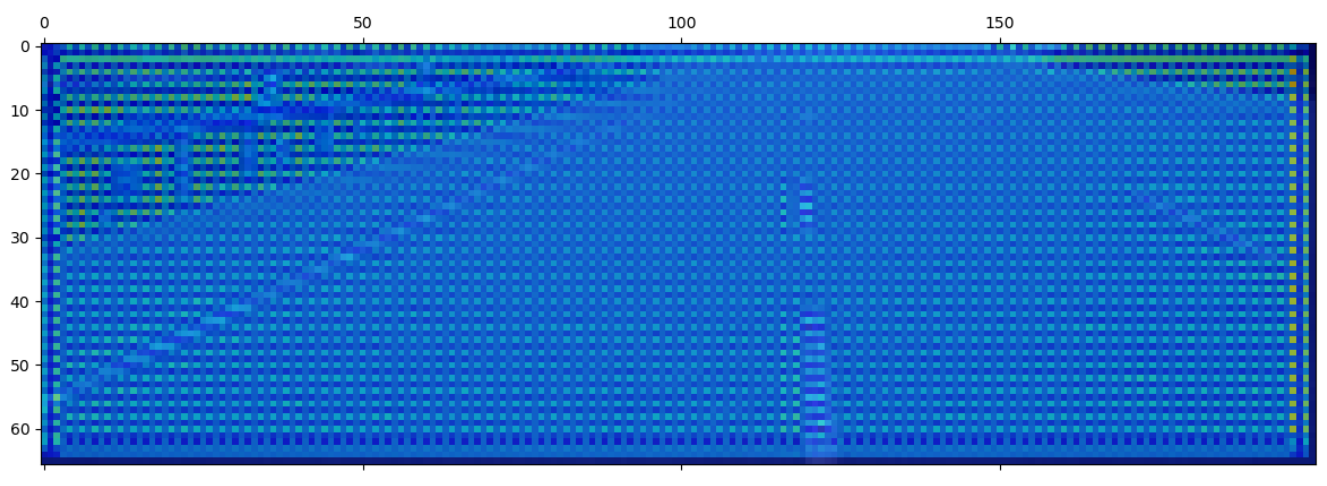
Let’s see the saliency map for the first convolutional layer:
 Saliency map of the first convolutional layer
Not very impressive, as there is no saliency and we only see the original image.
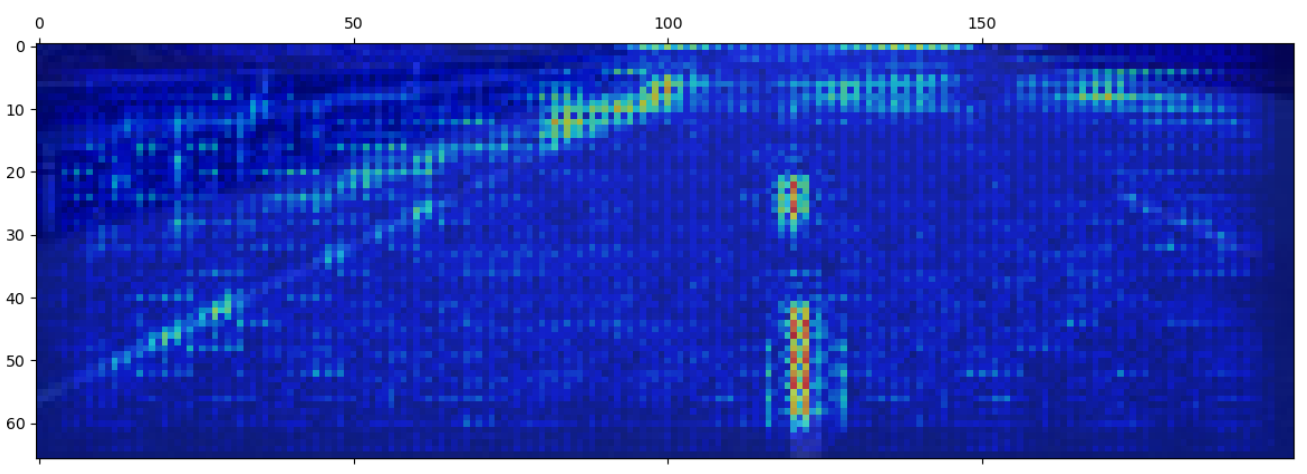
Let’s see how the map of the second layer looks like:
 Saliency map of the second convolutional layer
This is an improvement, but even if we see some attention in the middle line, on the wall, and the land after the right lane, it is not very clear. Let’s see the third layer:
 Saliency map of the third convolutional layer
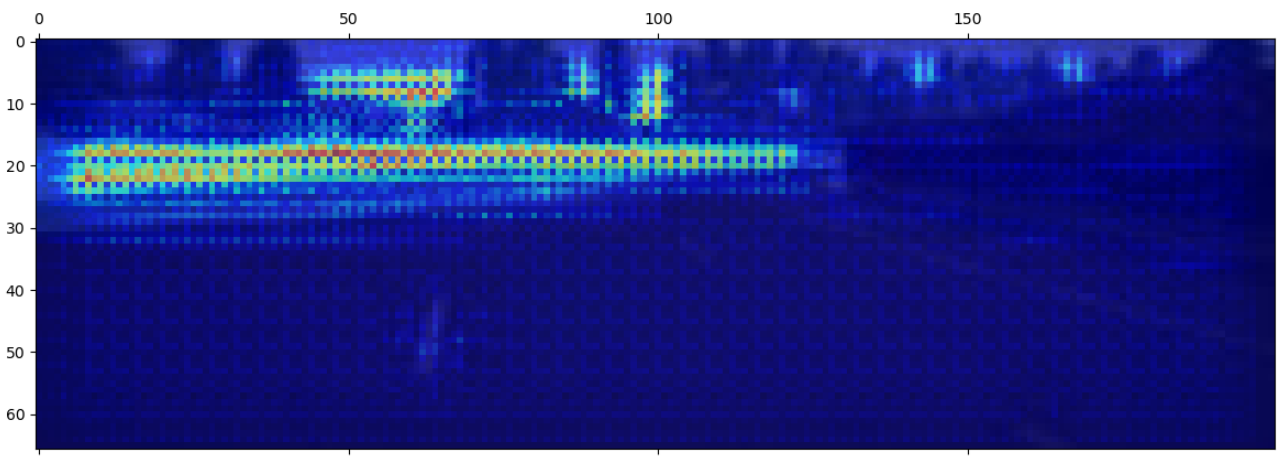
Now we are talking! We can see great attention on the central and left line, and some attention focused on the wall and the right line. The network seems to be trying to understand where the road ends. Let’s also see the fourth layer:
 Saliency map of the fourth convolutional layer
Here, we can see that the attention is mostly focused on the central line, but there are also sparks of attention on the left line and on the wall, as well as a bit on the whole road.
We can also check the fifth and last convolutional layer:
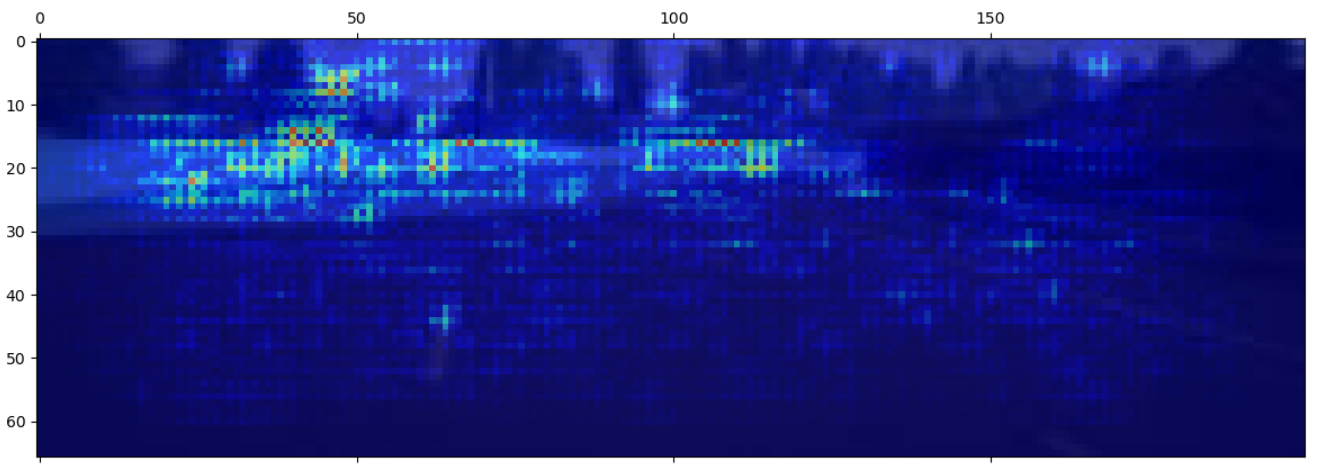
 Saliency map of the fifth convolutional layer
The fifth layer is similar to the fourth layer, plus with some more attention on the left line and on the wall.
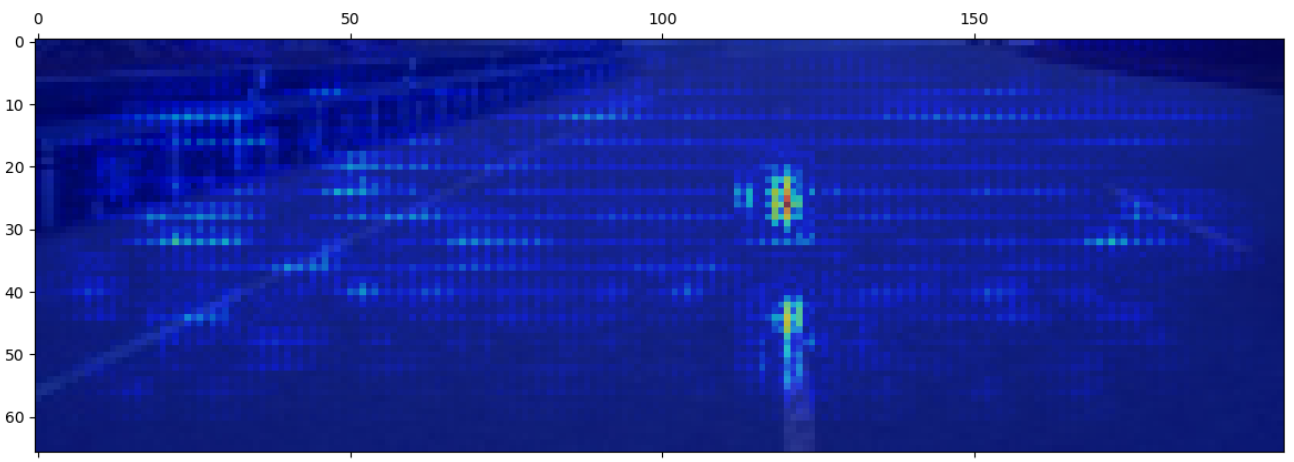
We can also visualize the saliency map for dense layers. Let’s see the result for the last layer, which is what we consider the real saliency map for this image:
 Saliency map of the output layer
The last saliency map, the most important one, shows great attention to the central line and the right line, plus some attention on the upper-right corner, which could be an attempt to estimate the distance from the right lane. We can also see some attention on the wall and the left lane. So, all in all, it seems promising.
Second Test Visualization
Let’s try with another image:
 Second test image
This is an interesting image, as it is taken from a part of the road where the network has not been trained, but it still behaved very well.
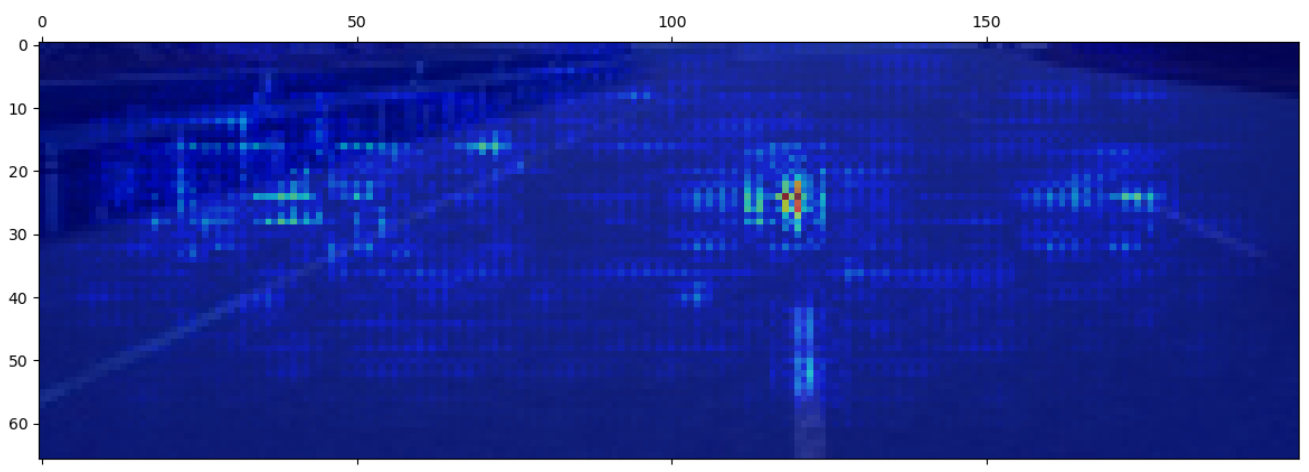
Let’s see the saliency map of the third convolutional layer:
 Saliency map of the third convolutional layer
The neural network seems very concerned with the end of the road and it seems to have detected a couple of trees as well. If it was trained for braking, I bet it would do so!
 Saliency map of the output layer
This is pretty similar to the previous one, but there is some attention to the central line and the right line, and a tiny amount on the road in general. Looks good to me.
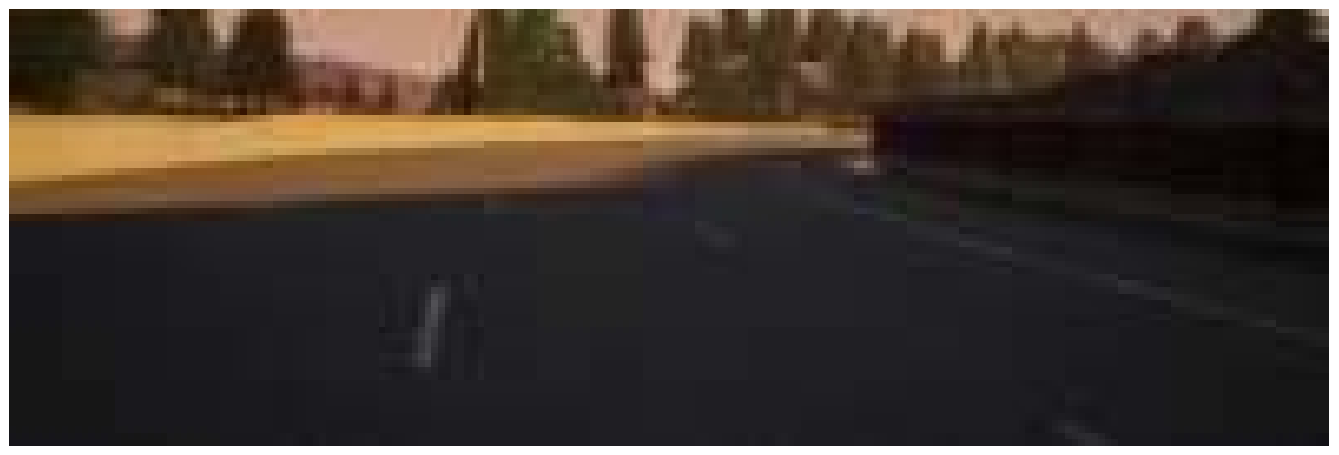
Let’s try with the last image, taken from the training to teach when to turn right:
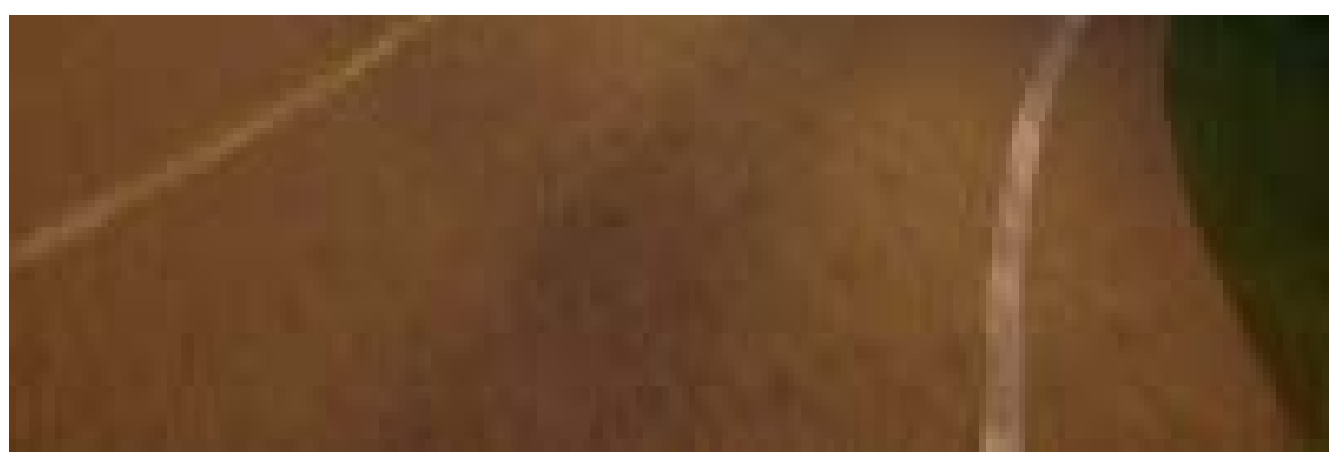 Third test image
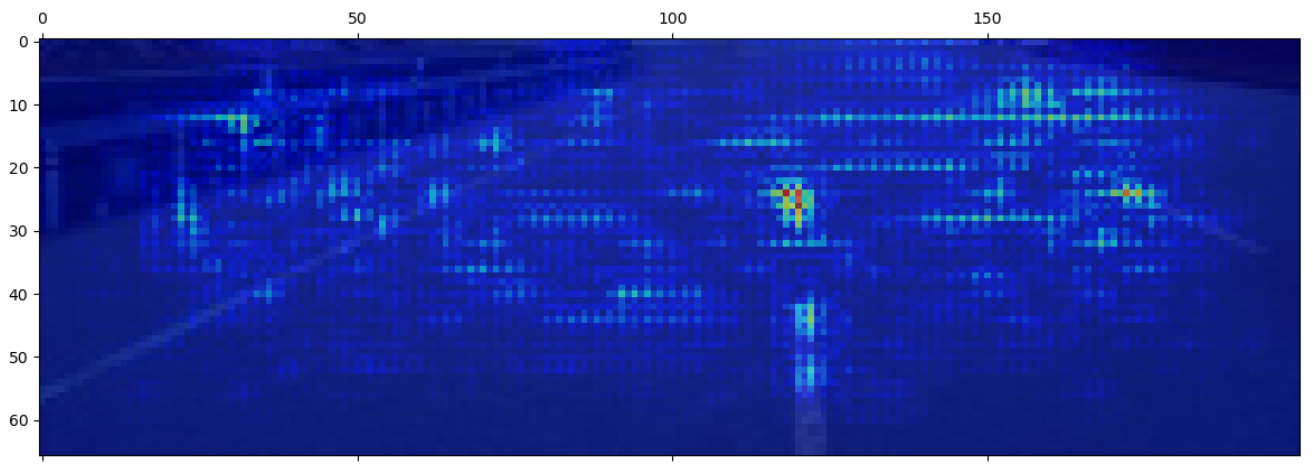
This is the final saliency map for it:
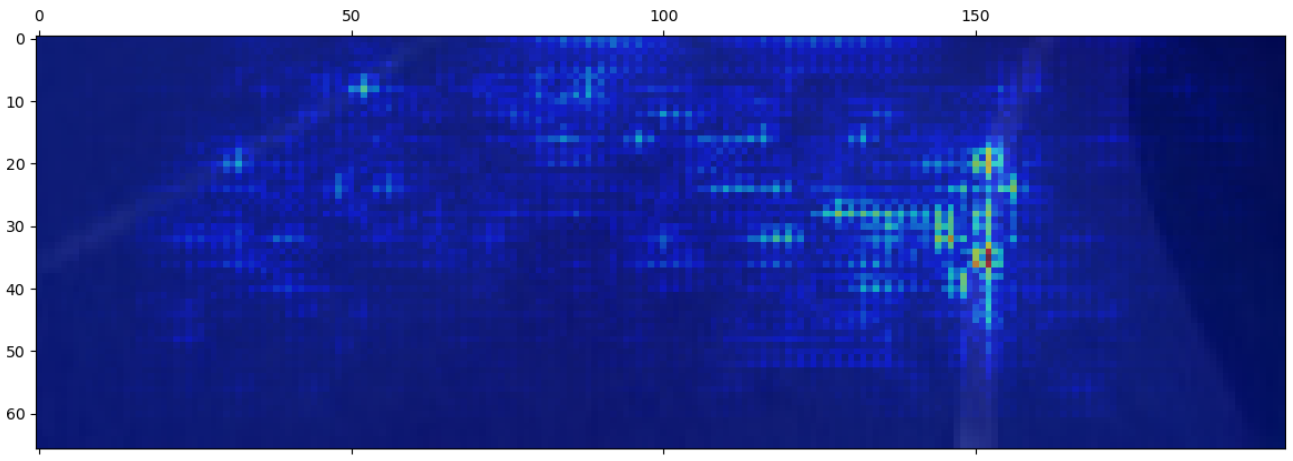 Saliency map of the output layer
You can see that the neural network is giving attention mostly to the right line, also keeping an eye on the whole road and with some spark of attention dedicated to the left line.
As you can see, the saliency map can be a valid tool to understand the behavior of the network a bit more and do a kind of sanity check on its interpretation of the world.
Last Words
This concludes the article. In the book, the rest of the chapter explains how to integrate the Neural Network with the simulator Carla, so you can actually experience a self-driving car, though in a simulator; it also explains how to use generators to enable training with bigger datasets and to do more advanced data augmentation.
If you liked this article and if you are curious about some of the technologies used by self-driving cars, please consider the Hands-On Vision and Behavior for Self-Driving Cars book. It talks also about Lane Detection, Neural Networks, Object Detection, Semantic Segmentation, sensors, lidars, maps, control, and more.
Published at DZone with permission of Luca Venturi. See the original article here.
Opinions expressed by DZone contributors are their own.
Comments