VisualVM 1.2 Adds Powerful New Performance and Memory Profiler
Join the DZone community and get the full member experience.
Join For Freevisualvm 1.2 has just been released and is available for download at https://visualvm.dev.java.net ! after eight months of development, this release introduces many new features and improvements, including a new sampling profiler (read further for details), redesigned charts, unmatched jstatd support and customizable proxy settings. a complete list of changes is available in the release notes .

monitor view showing new graphs
let's take a look at the most important feature in more detail: the visualvm-sampler plugin which is available from the plugins center. the plugin provides the tool with a powerful performance and memory profiler which uses sampling, a technique that allows performance and memory data to be gathered with zero setup and virtually no overhead. by periodically polling the monitored application for thread dumps or memory histograms, the profiler helps in locating potential bottlenecks or memory leaks while still allowing the application to run at full speed.
during cpu profiling, the tool gets thread dumps from the monitored application by a customizable sampling rate and displays the results the same way as the built-in instrumenting profiler. live tabular data showing hot spot methods enable you to immediately detect a bottleneck in the application. you can then save the collected data into a standard .nps snapshot that provides additional call tree and combined views for detailed inspection. the profiler obtains the thread dumps using a jmx connection which means that any jmx-enabled application (jdk 5+ from various vendors) can be profiled both locally and remotely. you can even profile several applications at once. from now you can use visualvm to profile almost any java application no matter if it's a locally running sun jdk application or a remote ibm jdk-powered application server!

cpu sampler showing live results

cpu snapshot created by the sampler
when profiling memory, the tool reads application memory histograms using the attach api and displays live tabular data for both heap and permgen memory spaces. using the deltas mode you can easily watch newly allocated and disposed objects over a specific period of time or while an action is executed which makes it really easy to identify a memory leak. also, the memory data can be saved as a .nps snapshot which can later be compared to other memory snapshots using the compare function. once the memory leak is identified, you can investigate the leak further by using the built-in heapwalker. the heapwalker has been enhanced to support displaying retained sizes and provides a powerful oql scripting engine.
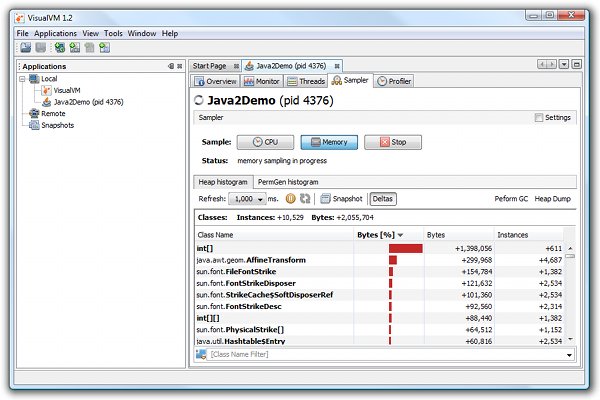
memory sampler showing live objects deltas
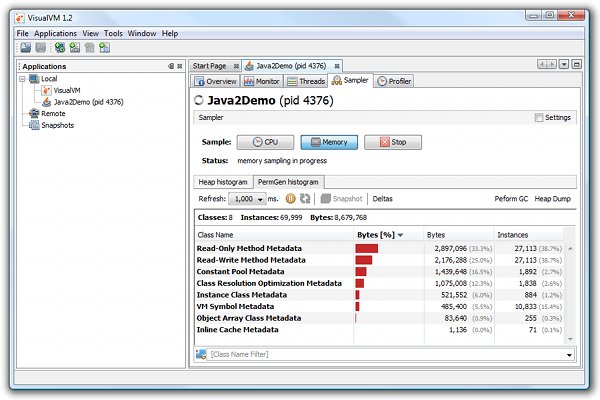
memory sampler showing live permgen histogram
the new visualvm-sampler plugin doesn't replace the built-in instrumentation profiler. in fact, it fills a gap in the optimal profiling workflow. if there is a performance problem and you don't know which part of the application is misbehaving, you can now use the sampler to quickly identify the bottleneck. once identified, you can setup the instrumentation profiler to inspect the affected code, and get exact call trees and invocation numbers while imposing the lowest possible overhead on the application. in future releases of visualvm, these two tools will be merged into a single powerful profiler that combines all the advantages of sampling and instrumentation.
visualvm 1.2 is free and open source, which makes it a good choice for all java developers who care about the performance and memory management of their applications. go and download visualvm 1.2 from https://visualvm.dev.java.net to try it yourself!
Opinions expressed by DZone contributors are their own.
Comments