What's Wrong With Big Objects In Java?
The G1 garbage collector, despite its advantages, is currently not good at handling bigger objects, called Humongous. Learn how to diagnose and fix the problem.
Join the DZone community and get the full member experience.
Join For FreeBy design, the G1 garbage collector manages the heap by dividing it into a fixed number of same-size regions. By default, the maximum number of regions is 2048, and region size corresponds to the maximum heap size as follows: heap size < 4GB: 2MB, <8GB: 4MB, <16GB: 8MB, and so on. Normally objects are allocated into a given region until it's full, and then at some point, the GC frees up the entire region by evacuating all live objects from it.
All these changes, however, if an object (typically an array) is bigger than half the region size. Such objects are called Humongous in G1 terminology, and are handled as follows:
- A humongous object is allocated directly in the Old Generation (note that this may or may not the case in JDK 11 and newer).
- A separate humongous region is created for each such object by concatenating several contiguous regions. Some of these regions may need to be GCed first.
- Each humongous region can accommodate only one Humongous object and nothing else. That is, the space between the end of the humongous object and the end of the humongous region (which in the worst case can be close to half the normal region size) is unused (this is true at least in JDK 8-11, but may be addressed in latest JDK versions)
Further details are available on Oracle's web site, but from the above description it should be clear that humongous objects are bad from the performance perspective, because
- If allocated in the Old Gen, they cannot be GCed quickly even if they are short-lived (the Old Gen is collected less frequently than the Young Gen, and it takes more time)
- Creating a humongous region out of several normal regions may need a non-trivial amount of time
- If there are many humongous objects on the heap, it can lead to heap fragmentation because of unused "gaps" in humongous regions.
Depending on the number, size, and allocation frequency of Humongous objects, consequences may vary. A relatively mild outcome is increased GC pauses. In the worst case, severe heap fragmentation results in the JVM crashing with OutOfMemoryError when the used heap portion is much smaller than the entire heap. Here is a short app that illustrates this problem:
xxxxxxxxxx
import java.util.ArrayList;
// This app runs until it crashes with OOM, to measure how many 1MB arrays
// can be allocated on the heap. For these arrays to be treated as Humongous,
// heap size (-Xmx) should be set to less than 4G.
public class ExhaustHeap {
private static final int ONE_MB = 1024 * 1024;
public static void main(String args[]) {
ArrayList<byte[]> list = new ArrayList<>(5000);
for (int i = 0; i < 5000; i++) {
// Note that a byte[] array with 1MB elements needs additional 16 bytes
// of memory for its header. Thus it's bigger than half the 2MB region.
list.add(new byte[ONE_MB]);
System.out.println("Allocated arrays: " + i);
}
}
}
This app runs until it exhausts the heap and crashes with OutOfMemoryError. The last line that it prints shows how many 1MB arrays it was able to allocate. I ran this code on JDK 8 and JDK 11 with a 3900MB heap size. When the Concurrent Mark-Sweep (CMS) GC is used (it doesn't divide heap into small regions), 3830 arrays, i.e. 3830 MB, get allocated. However, when G1 GC is used, twice less - 1948 arrays - get allocated. In other words, with CMS, nearly the entire heap can be utilized, whereas with the G1 GC the app, in effect, can use only about half the heap! If this code is changed to simulate a more realistic scenario where both big and small arrays are allocated alternately, the outcome is not much better: the app managed to allocate about 2600MB total, at the price of allocating a smaller number - 1310 instead of 1948 - of 1MB arrays.
Such a situation may lead to confusion when analyzing a heap dump generated after OOM (if the -XX:+HeapDumpOnOutOfMemoryError JVM flag is enabled): such a dump may be much smaller than the heap size. This is counterintuitive: if a dump is small, it means that the heap is not fully utilized, i.e. there is free space in it. But if free space is available, then why does the JVM claim that it ran out of the heap? The answer is: yes, there is (a lot of) free space in the heap, but it's not accessible to new object allocations. This may be further exacerbated by the fact that even when some of the humongous objects are garbage, the GC, for an unknown reason, may (as we observed several times) be unable to start Full GC that would release these objects and free up space.
Diagnosing Humongous Object Allocations
The place where humongous object allocations are easiest to spot is your application's GC log. Just grep it for "humongous" and you may see things like:
2020-07-17T13:16:31.567+0000: 18663.443: Total time for which application threads were stopped: 0.0404361 seconds, Stopping threads took: 0.0002145 seconds
 18663.749: [G1Ergonomics (Concurrent Cycles) request concurrent cycle initiation, reason: occupancy higher than threshold, occupancy: 9663676416 bytes, allocation request: 4415064 bytes, threshold: 9663676380 bytes (45.00 %), source: concurrent humongous allocation]
 18663.751: [G1Ergonomics (Concurrent Cycles) request concurrent cycle initiation, reason: requested by GC cause, GC cause: G1 Humongous Allocation]
 18663.751: [G1Ergonomics (Concurrent Cycles) initiate concurrent cycle, reason: concurrent cycle initiation requested]
2020-07-17T13:16:31.875+0000: 18663.751: [GC pause (G1 Humongous Allocation) (young) (initial-mark)
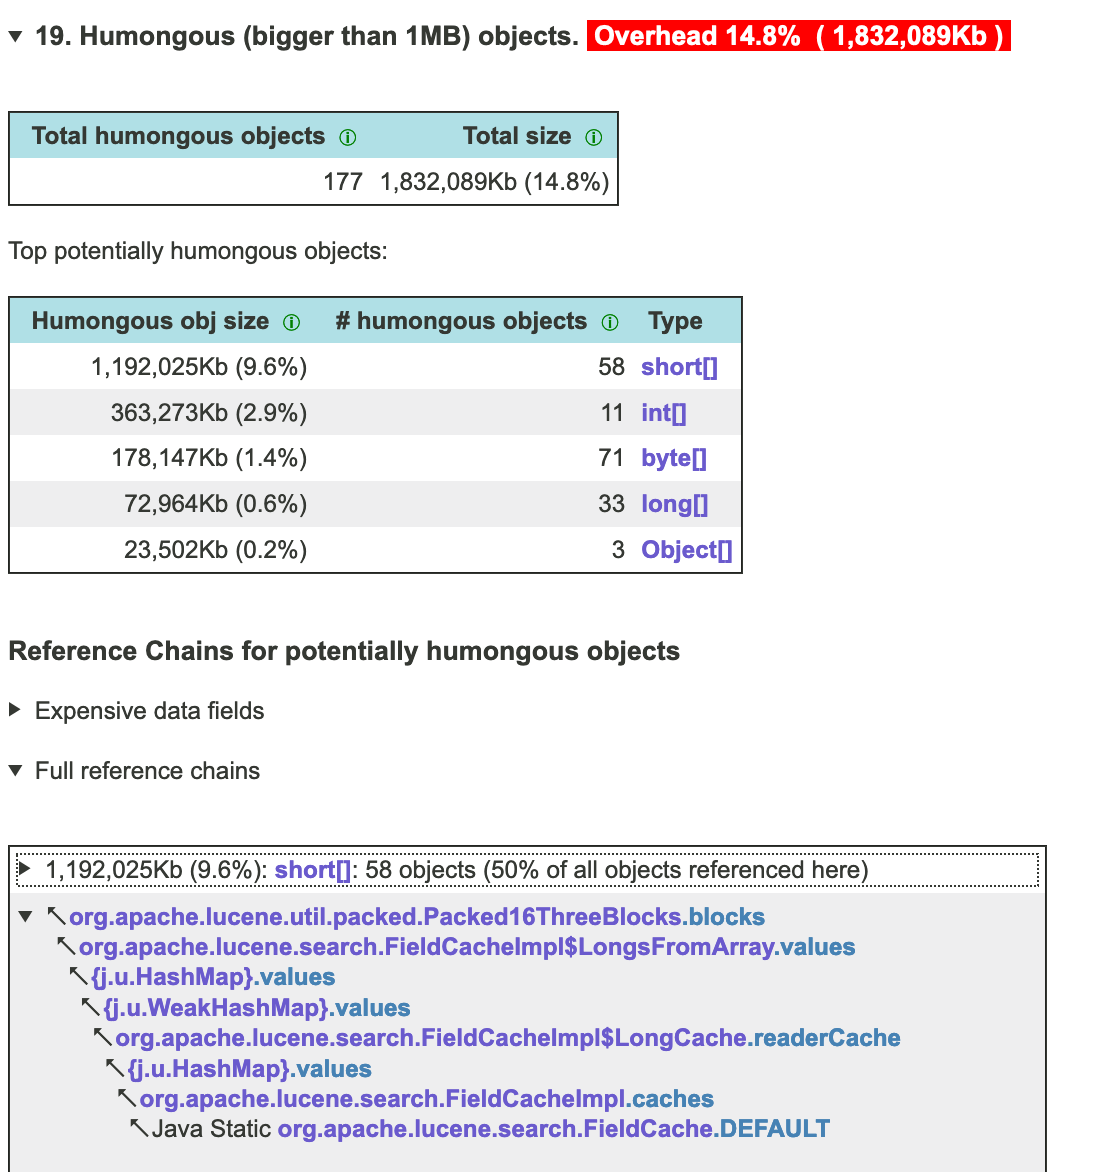
If you observe frequent Humongous object allocations, and/or long GC pauses associated with them, the next step is to identify who allocates/manages such objects. This can be done, for example, via heap dump analysis, using the JXRay tool. This tool has an "inspection" that looks for all objects of size 1MB and bigger. For every such object, it shows the shortest path (reference chain) back to some GC root. Objects that have identical paths are aggregated together, which makes it easy to identify "hot spots" in the code that manage many problematic objects.
For Humongous object detection, taking a full heap dump (i.e. one with all objects, including garbage, rather than with only live objects) is highly recommended. That's because certain Humongous objects (for example, temporary arrays used when serializing and sending messages) may be short-lived, i.e. quickly become garbage and not show up in the live heap dump. However, the problem with garbage objects is that there are, by definition, no references to them from live data structures. Thus, when analyzing a full heap dump, it's often difficult to determine who (what part of the app code) once created and managed them. If it's not obvious where a given humongous object "came from", you may need to take full dumps several times from the same app and then analyze all of them or choose the biggest one, that has a higher chance of containing both garbage and live Humongous objects. Here is an excerpt from one JXRay report with Humongous objects:
Mitigating Problems with Humongous Objects
There are several ways to fix or at least mitigate this problem: tune the GC, change the GC type, fix the root cause, or upgrade to the newer JDK.
Tuning GC, in this case, means increasing the heap or increasing the region size with -XX:G1HeapRegionSize so that previously Humongous objects are no longer Humongous and follow the regular allocation path. However, the latter will decrease the number of regions, that may negatively affect GC performance. It also means coupling GC options with the current workload (which may change in the future and break your current assumptions). However, in some situations, that's the only way to proceed.
A more fundamental way to address this problem is to switch to the older Concurrent Mark-Sweep (CMS) garbage collector, via the -XX:+UseParNewGC -XX:+UseConcMarkSweepGC flags (unless you use one of the most recent JDK versions in which this collector is deprecated). CMS doesn't divide the heap into numerous small regions and thus doesn't have a problem handling several-MB objects (though every garbage collector may struggle to free up space for bigger objects, that take, say, 10 percent of the heap). In fact, in relatively old Java versions CMS may perform even better overall than G1, at least if most of the objects that the application creates fall into two categories: very short-lived and very long-lived.
Fixing the root cause means changing the code to stop generating Humongous objects, in one way or another. For example, sometimes you may find that your Humongous objects are buffers that are too big and underutilized, thus their size can be reduced safely. In other situations, you may need to make more fundamental changes to your code or consider replacing a problematic third-party library with a different one.
Finally, in the latest JDKs, starting from version 11, problems with Humongous objects may be less acute. In these JDKs, such objects are allocated in the Young Gen, and thus short-lived Humongous objects should be collected much faster. They may also be handled better in other aspects, resulting in shorter humongous-related GC pauses, and, possibly, in Humongous regions being able to accommodate normal objects as well.
Opinions expressed by DZone contributors are their own.
Comments