Why You Should Never, Ever print() in a Lambda Function
A deep dive into the logging module in the python runtime of AWS Lambda functions and how to best take advantage of the expert debugging patterns it enables!
Join the DZone community and get the full member experience.
Join For FreeA Tale of Two Lambda Users
Tale #1: The Amateur
One moment everything is fine, then … Bam! Your Lambda function raises an exception, you get alerted and everything changes instantly.
Critical systems could be impacted, so it’s important that you understand the root cause quickly.
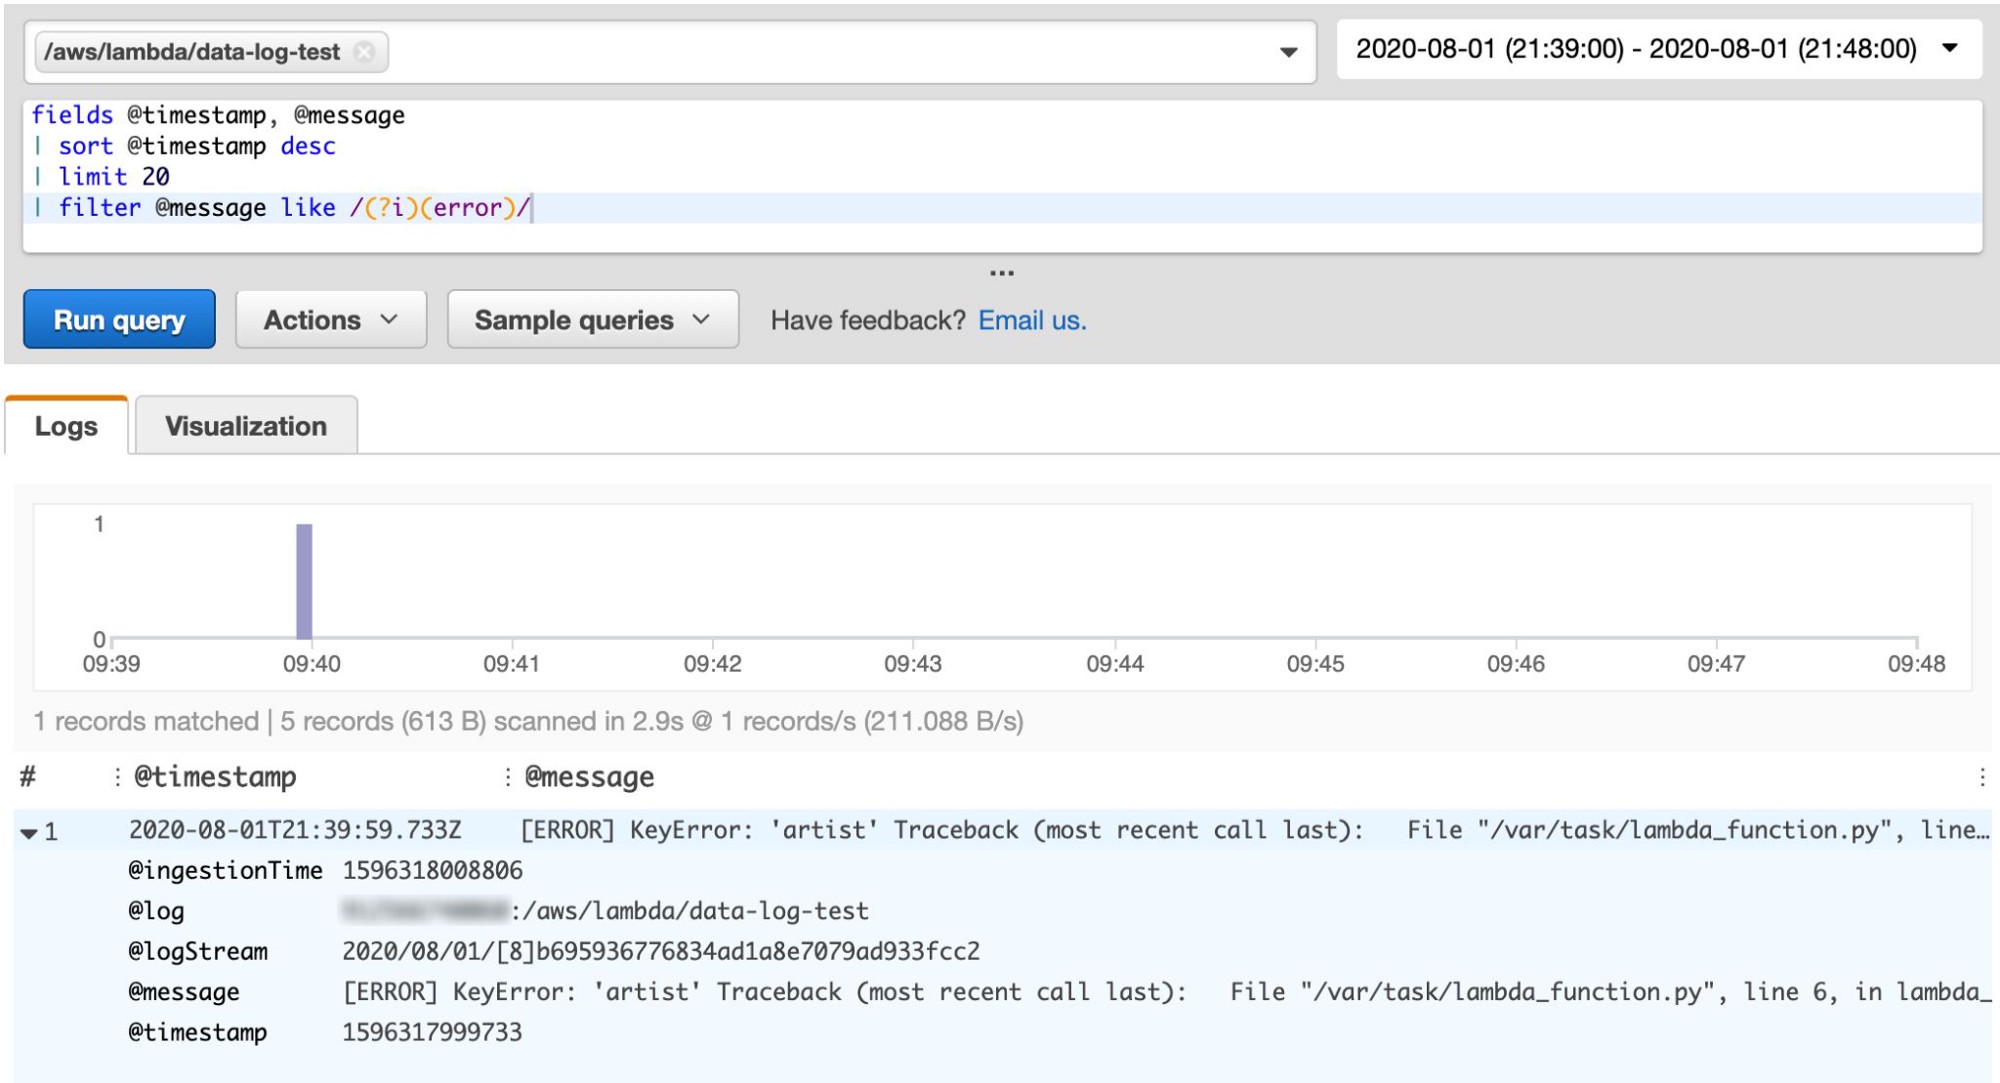
Now, this isn’t some low-volume Lambda where you can scroll through CloudWatch Logs and find the error in purely manual fashion. So instead you head to CloudWatch Insights to run a query on the log group, filtering for the error:

Looks like we found our error! While helpful, unfortunately it omits any other log messages associated with the failed invocation.
With the information shown above maybe — just maybe — you can figure out what the root cause is. But more likely than not, you won’t be confident.
Do you tell people you aren’t sure what happened and that you’ll spend more time investigating if the issue happens again? As if!
So instead you head to the CloudWatch Logs Log Stream, filter records down to the relevant timestamp, and begin manually scrolling through log messages to find the full details on the specific errored invocation.
Resolution Time: 1–2 hours
Lambda Enjoyment Usage Index: Low
Tale #2: The Professional
Same Lambda function, same error. But this time the logging and error handling are improved. As the title implies, this involves replacing print() statements with something a ‘lil better.
What is that something and what does this Lambda function look like anyway? Let’s first go through what error debugging looks like for the professional, then take a look at code. Fair?
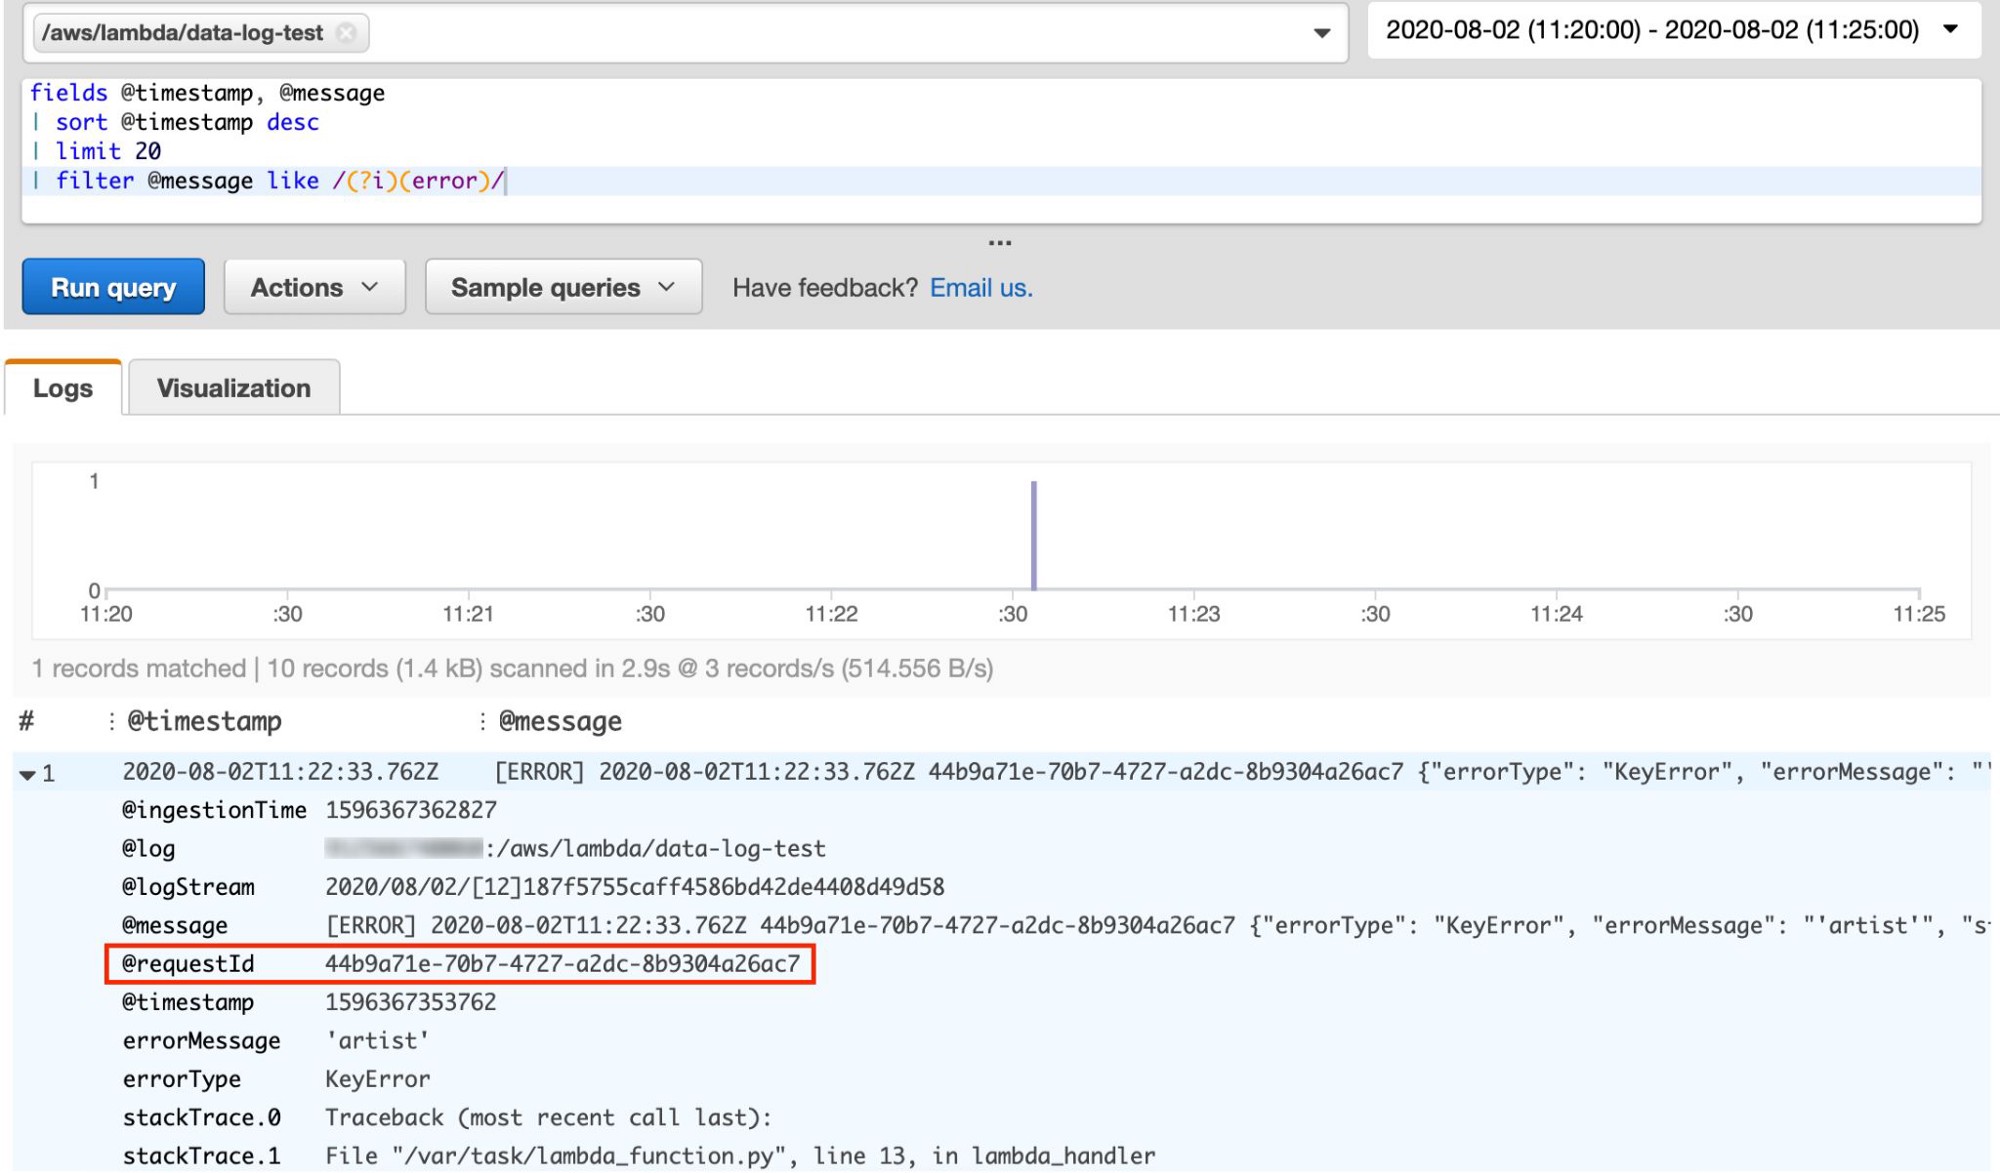
Again, we start with an Insights query:

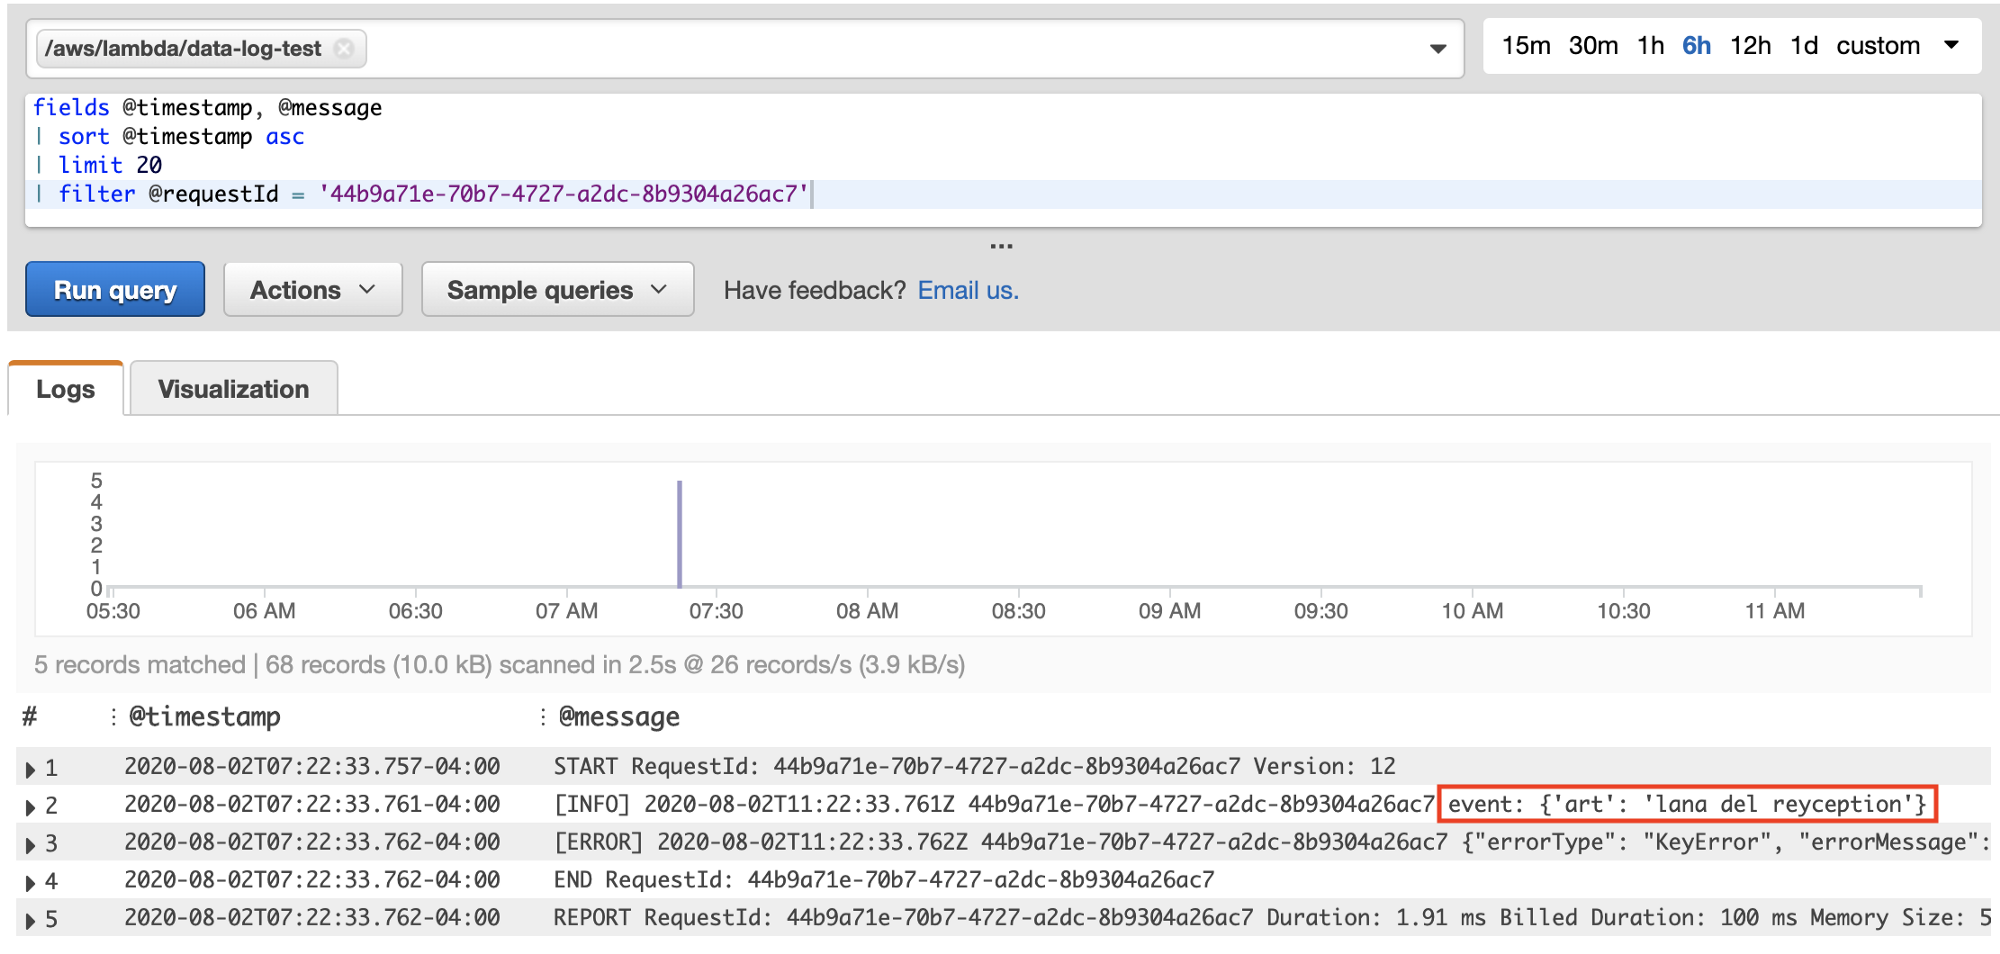
And again we find the error in the logs, but unlike last time, the log event now includes the @requestId from the Lambda invocation. What this allows us to do is run a second Insights query, filtered on that requestId to see the full set of logs for the exact invocation we are interested in!

Now we get 5 results, which together paint the full crime scene picture of what happened for this request. Most helpfully, we immediately see the exact input passed to trigger the Lambda. From this we can either deduce what happened mentally, or run the Lambda code locally with the exact same input event to debug.
Resolution Time: 10–20 minutes
Lambda Enjoyment Usage Index: High!
The Code Reveal
I’d like to imagine my readers are on the edge of their seats, begging to know the difference between the Amateur and the Pro’s code from the tale above.
Whether that’s true or not, here is the Amateur Lambda:
def lambda_handler(event, context):
'''Simple Lambda function. event = {'artist': 'Lana Del Rey'}
'''
try:
print(f'event: {event}')
artist = event['artist']
print(f'The artist is: {artist}')
return {"status": "success", "message": None}
except Exception as e:
raise e
It is, of course, intentionally simple for illustrative purposes. Errors were generated by simply passing an event dictionary without artist as a key, for example: event = {'artisans': 'Leonardo Da Vinci'}.
Now for the Professional Lambda, which performs the same basic function but improves upon the print() statements and error handling.
xxxxxxxxxx
import sys
import logging
import traceback
import json
logger = logging.getLogger()
logger.setLevel(logging.INFO)
def lambda_handler(event, context):
'''Simple Lambda function.'''
try:
logger.info(f'event: {event}')
artist = event['artist']
logger.info(f'The artist is: {artist}')
return {"status": "success", "message": None}
except Exception as exp:
exception_type, exception_value, exception_traceback = sys.exc_info()
traceback_string = traceback.format_exception(exception_type, exception_value, exception_traceback)
err_msg = json.dumps({
"errorType": exception_type.__name__,
"errorMessage": str(exception_value),
"stackTrace": traceback_string
})
logger.error(err_msg)
Interesting! So why are we using the logging module and formatting exception tracebacks?
Lovely Lambda Logging
First, the Lambda runtime environment for python includes a customized logger that is smart to take advantage of.
It features a formatter that, by default, includes the aws_request_id in every log message. This is the critical feature that allows for an Insights query, like the one shown above that filters on an individual @requestId, to show the full details of one Lambda invocation.
Exceptional Exception Handling
Next, you are probably noticing the fancy error handling. Although intimidating looking, using sys.exec_info is the standard way to retrieve information about an exception in python.
After retrieving the exception name, value, and stacktrace , we format it into a json-dumped string so all three appear in one log message, with the keys automatically parsed into fields. This also makes it easy to create custom metrics based off specific errors without requiring complex string parsing.
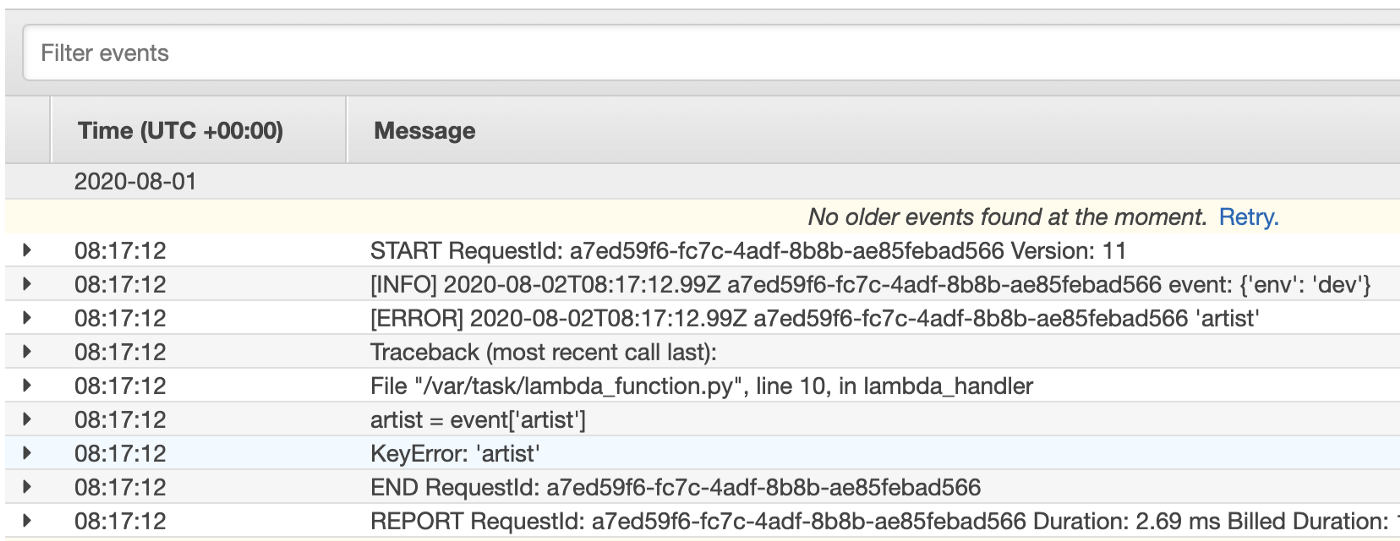
Lastly, it is worth noting that in contrast, logging an exception with the default Lambda logger without any formatting results in an unfortunate multi-line traceback looks something like this:

Wrapping Up
I hope if your Lambda functions look more like the Amateur Lambda at the moment, this article inspires you to upgrade your dance and go Pro!
Before I let you go, I should warn that the downside to replacing print statements with proper logging is that you lose any terminal output generated from local executions of your Lambda.
There are clever ways around this involving either environment variables or some setup code in a lambda_invoke_local.py type of file. If interested, let me know and I’ll be happy to go over the details in a future article.
Lastly, as a final bit of inspiration, instead of needing to run Cloudwatch Insights queries to debug yourself, it should be possible to set up an Alarm against the Lambda Errors metric that notifies an SNS topic when in state “In Alarm”. Another Lambda could then trigger off that SNS topic to run the same debugging Insights queries as the Pro automatically, and return the relevant logs in Slack or something.
Would be cool, no?
Published at DZone with permission of Paul Singman. See the original article here.
Opinions expressed by DZone contributors are their own.

Comments