Monitor Applications Via Application Insights Using Log Alerts
This article explains the basic features of Application Insight Log Alert and how to use Log Analytics Query to evaluate resources and Logs every set frequency.
Join the DZone community and get the full member experience.
Join For FreeIntroduction
In this article, I want to showcase how one can get an email notification as an alert when "Something went wrong" using Log Analytics query to evaluate resources and Logs every set frequency (fire an alert based on the results). This article covers the basic features of Application Insight Log Alert.
Alerts in Microsoft Azure
Alerts proactively notify you when issues found with your infrastructure or application using your monitoring data in Azure Monitor. They allow you to identify and address issues before the users of your system notice them.
Application Insight Monitors Followings
1. Request rates, response times, and failure rates: Find out which pages are most popular, at what times of day, and where your users are. See which pages perform best. If your response times and failure rates go high when there are more requests, then perhaps you have a resourcing problem.
2. Dependency rates, response times, and failure rates: Find out whether external services are slowing you down.
3. Exceptions: Analyze the aggregated statistics, or pick specific instances and drill into the stack trace and related requests. Both server and browser exceptions are reported.
4. Page views and load performance: Reported by your users' browsers. AJAX calls from web pages - rates, response times, and failure rates. User and session count.
5. Performance counters from your Windows or Linux server machines, such as CPU, memory, and network usage. Host diagnostics from Docker or Azure.
6. Diagnostic trace logs from your app: so that you can correlate trace events with requests.
7. Custom events and metrics that you write yourself in the client or server code, to track business events such as items sold or games won.
It sends all logs and telemetry data to central database.
Overview
We are not monitoring the monitors all the time that is why we can configure Application Insights to send us alerts whenever something went wrong like '404 Errors', ‘500 Errors’, ‘<Specific String Search>’ etc.
Log Analytics and Application Insights From the Alerts Management
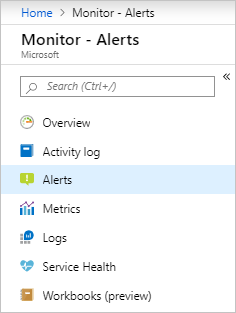
1. Go to Application Insight resource and click "Alerts" in the "Monitoring" section.

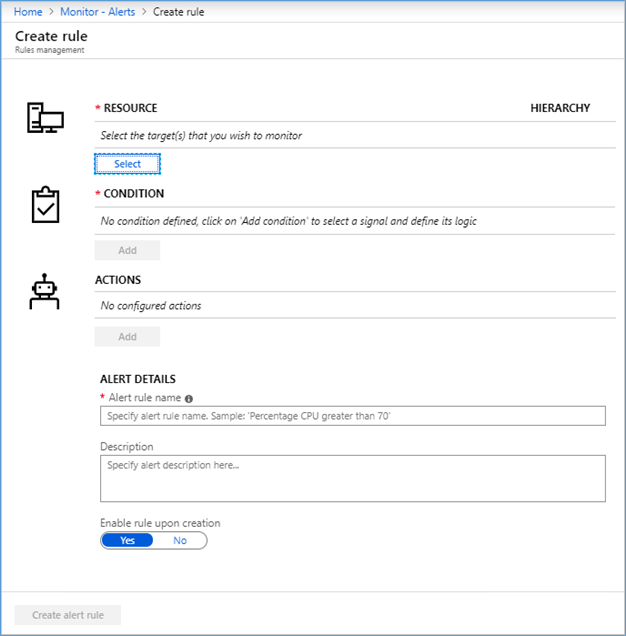
2. The "Create Alert" pane appears. It has four parts:
- The resource to which the alert applies.
- The condition to check.
- The actions to take if the condition is true.
- The details to name and describe the alert.
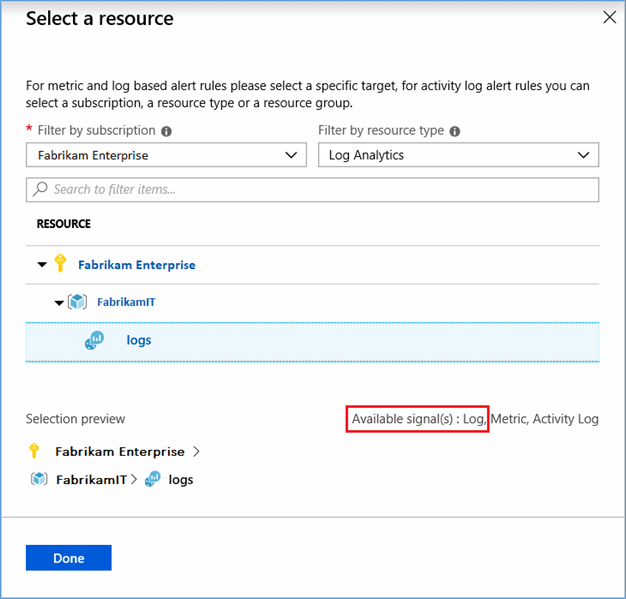
3. Press on the "Select Resource" button. Filter by choosing the subscription, resource type, and select a resource. Ensure the resource has logs available.
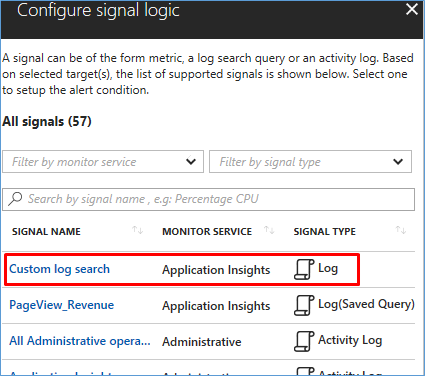
4. Next, use the "Add Condition" button to view the list of signal options available for the resource. Select the "Custom Log" search option.
5. Once selected, write, paste, or edit the alerting query in the "Search Query" field.
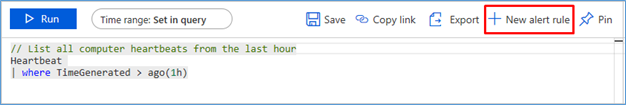
Start from the Condition tab and check that the measure, aggregation type, and aggregation granularity are correct. By default, the rule counts the number of results in the last 5 minutes. If we detect summarized query results, the rule will be updated automatically within a few seconds to capture that.
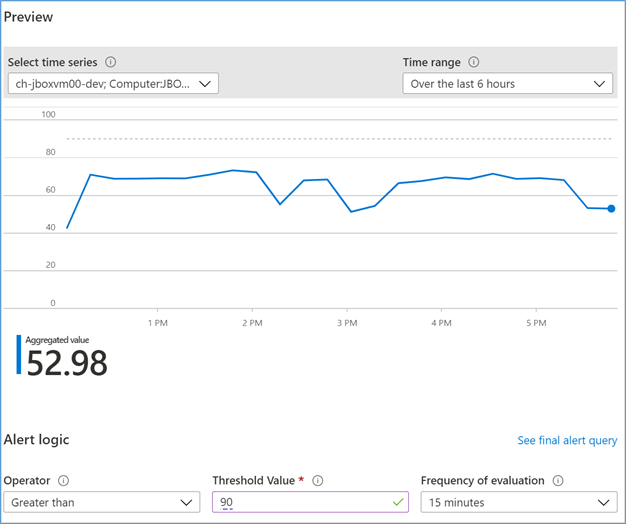
Next, based on the preview data, set the "Alert logic Operator", "Threshold Value", and Frequency."
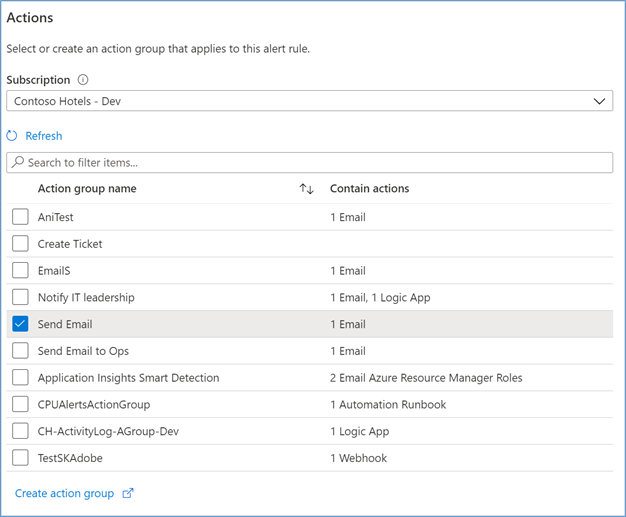
6. In the "Actions" tab, select or create the required action groups.
In the "Details" tab, define the "Alert Rule Details", and "Project Details." You can optionally set whether to not Start running now or "Mute Actions" for a period after the alert rule fires.
Conclusion
The other Application Insight Alerts not covered in this article.
Many thanks for reading this article. Please write your feedback and suggestions in the comment section below.
Opinions expressed by DZone contributors are their own.
Comments