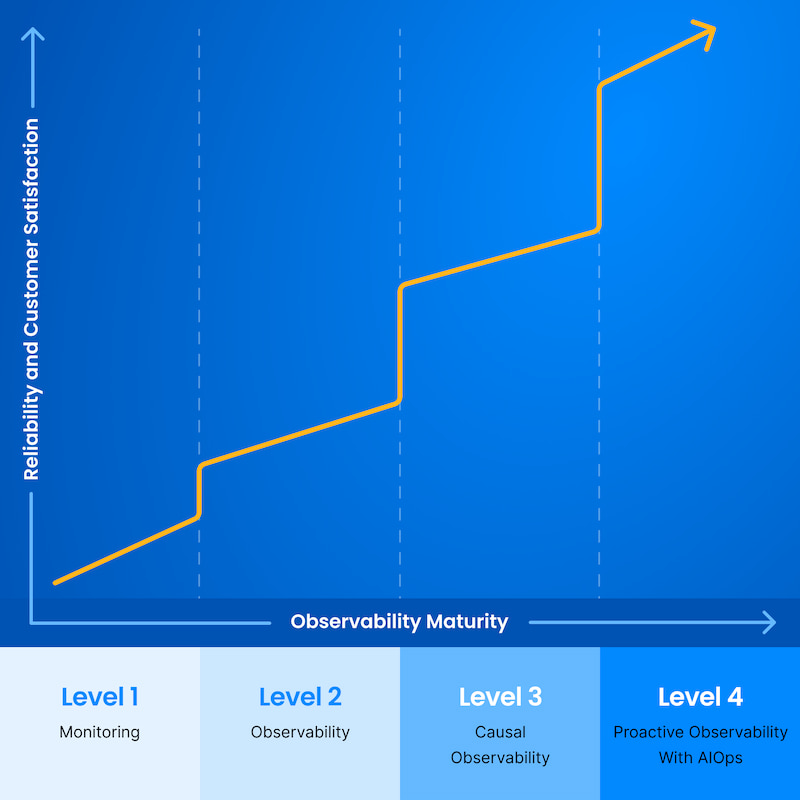
In this section, we go into detail about what functionality you need at each level of the maturity model and what benefits you should expect.
Level 1: Monitoring
Ensure that individual components are working as expected.
The first level of the Observability Maturity Model, Monitoring, is not new to IT. A monitor tracks a specific parameter of an individual system component to make sure it stays within an acceptable range; if the value moves out of the range, the monitor triggers an action, such as an alert, state change, notification, or warning. With traditional monitoring, sometimes referred to as application performance monitoring (APM), the use case is, "Notify me when something is not operating satisfactorily."
You can think of monitoring in terms of traffic light colors:
- The component is available and healthy (green)
- The component is at risk (orange or yellow)
- The component is broken (red)
Monitoring looks at a pre-defined set of values with pre-defined sets of failure modes. It focuses on basic component-level parameters, such as availability, performance, and capacity, and generates events that report on the state of the monitored value. Events are noteworthy changes in the IT environment. Though events may be purely informative, they often describe critical incidents that require action. Events may trigger alerts or notifications that arrive via various channels, such as email, chat, a mobile app, or an incident management system.
As a first step toward observability, implement monitoring to get basic insights into the health and status of individual components and be notified when something breaks. Monitoring creates a foundation for more mature observability, but it doesn't give you actionable information to quickly solve problems. Table 2 gives an overview of the key capabilities for Level 1.
Table 2: Level 1 summary
| Monitoring |
| Use basic traffic-light monitoring to understand the availability of the individual components that make up your IT services. |
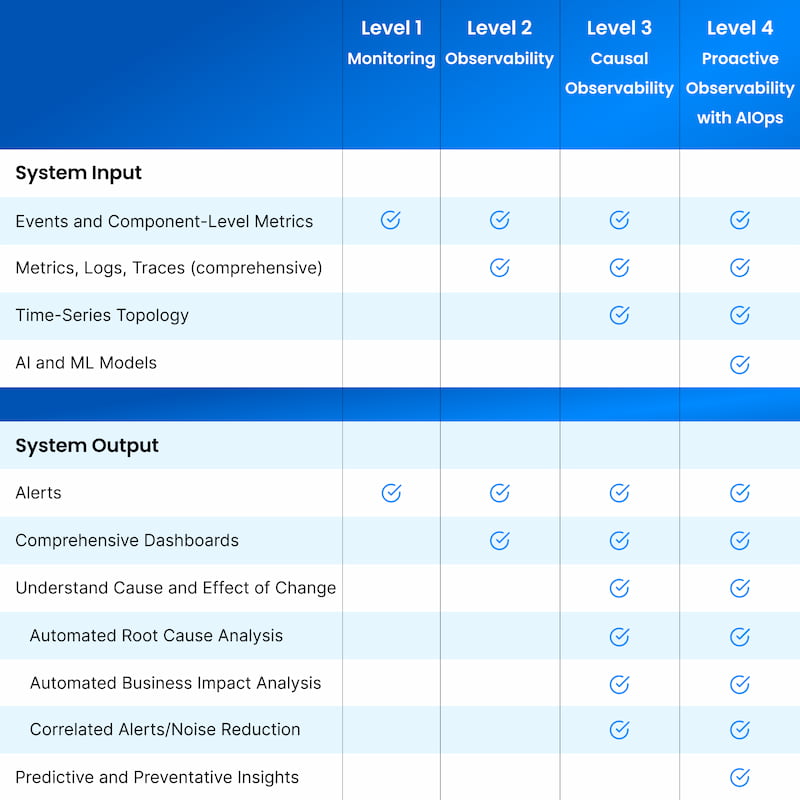
| System input |
System output |
| Events and component-level metrics (e.g., "API response time is higher than our SLO of five seconds") |
Alerts or notifications (e.g., "order fulfillment service is down") |
| What you get |
- Basic information such as the health status of a component — is it working?
- Alerts and notifications when issues occur
- Easiest way to get started; many open-source and SaaS solutions are available |
Next Step: Observability
Level 1 gives you limited insights into the state of the overall environment: It shows you individual component health but generally no information about the big picture. It tells you something is broken but not why, who to call, nor when and where the original problem started. Setting up and maintaining monitoring checks and notification channels requires a lot of manual work.
At Level 1, you also need to do root cause analysis and impact analysis manually, and you have a limited set of data. Investigating the sources of problems takes time. In addition, a single issue may cause storms of alerts from multiple components, causing further confusion and delays in pinpointing the root cause.
While Level 1, Monitoring, can detect a limited number of known types of failures, Level 2, Observability, can help you discover unknown failure modes. As you move from Level 1 to Level 2, you will gain more in-depth information that provides a better understanding of the availability, performance, and behavior of your services.
Level 2: Observability
Determine why the system is not working.
To keep today's complex and dynamic IT systems running reliably, you need to not only know what's working (monitoring) but also understand why it's not working (observability). Traditional monitoring tracks the basic health of a component or system. Observability evolved naturally to provide deeper insights into the behavior of a system over time. When something goes wrong and your team receives an alert, you need to quickly figure out, "What happened? Where, when, why, and who do we call?" Observability data helps you answer these questions.
At full maturity (Level 4 in this model), observability provides all the data you need, in the proper context, to automatically detect and remediate issues, and even to proactively identify and prevent them. When an alert pops up, you look to understand the state of your system to find the problem's source. At Level 2, observability typically delivers system insights by focusing on three critical types of telemetry data: metrics, logs, and traces.2
These three pillars of observability are collected from IT components such as microservices, applications, and databases to provide an overall perspective into a system's behavior. Each pillar gives a different type of information, as outlined in Table 3.
Table 3: Three pillars of observability
| Pillar |
Definition |
| Metrics |
Numerical measurements that help you understand the performance and status of services — for example, the famous four golden signals: latency, traffic, error rate, and saturation.3 |
| Logs |
Time-stamped records of relevant events that happen in a system (e.g., transactions, warnings, errors), which help you understand a system's behavior at a given point in time. |
| Traces |
Detailed snapshots showing how data flows through an application from end to end (e.g., a user request), which help troubleshoot performance and sometimes give code-level visibility into how your app performs. |
These three pillars, along with events and alerts, are typically plotted on dashboards so teams can easily keep track of important activities. Some observability tools provide out-of-the box dashboards that bring together these different types of data on one screen and allow you to deep-dive into them for further investigation.
Level 2 data has much greater breadth and depth than Level 1, and it often involves some data consolidation across your environment into a single view. You may need to build additional dashboards if you want more insights, especially if your environment has multiple domains and you are using multiple monitoring tools. The challenge then becomes how to resolve information from too many dashboards. At Level 2, you can infer suspected reasons for incidents by manually correlating data, but this approach often involves complex manual queries across systems.
At Level 2, teams have not yet developed an automated way to unify and correlate the siloed data from various tools and domains, so it is still labor intensive and time consuming to pinpoint the root cause of an issue. Consequently, MTTD and MTTR are higher than they should be, customers are more adversely affected, and more revenue is lost than at higher maturity levels.
Table 4: Level 2 summary
| Observability |
| Observe the behavior of IT environments by capturing metrics, logs, and traces in addition to events and health state. |
| System input |
System output |
| Level 1 inputs + comprehensive metrics, logs, and traces |
Level 1 outputs + comprehensive dashboards with graphs, gauges, flame charts, logs, etc. |
| What you get |
- Deeper, broader, and more holistic view of overall system health by collecting additional data from more sources, which better supports problem diagnosis
- Ability to discover unknown failure modes in addition to known types of failures
- Beneficial insights from individual types of data — e.g., traces help identify performance bottlenecks, metrics make excellent KPIs, and logs can be used to find software defects |
Next Step: Causal Observability
Observability generates a huge amount of data and sorting out the meaningful information can be difficult. At Level 2, your team is likely challenged by both data silos and volume, which cause inefficiencies in cross-domain and cross-team troubleshooting. When something goes wrong, too many people get involved because nobody knows where the problem is, resulting in "incident ping-pong" and blame games. You may need to build ad hoc solutions to query multiple observability silos to troubleshoot a single issue; creating these queries requires practitioners with development skills, knowledge of data structures, and understanding of system architecture.
In addition, the telemetry-centric and siloed views that are typical in Level 2 often require substantial manual work to extract actionable insights. Setting up efficient dashboards can take considerable time and they require ongoing maintenance. Root cause analysis, impact analysis, and alert noise reduction are important in maintaining a reliable and resilient stack, but these activities are challenging at this level.
Note: Teams are increasingly adopting the OpenTelemetry standard to facilitate the capture of metrics, logs, and traces. OpenTelemetry is extremely helpful to efficiently collect these types of data, but it was not designed to bridge silos, create better context for data, or analyze the data.
In order to move to Level 3 and understand how your observability data is related, you need to provide context for events, logs, metrics, and traces across the data silos in your IT environment. At Level 3 (Causal Observability), you get a precise map of the topology of your business processes, applications, and infrastructure, and you can track how it all changes over time. When something goes wrong, you can use this contextual data combined with automation to quickly determine the cause of an issue without having to manually wade through silos of uncorrelated data.
Level 3: Causal Observability
Find the cause of the incident and determine its impact across the system.
It is not surprising that most failures are caused by a change somewhere in a system,4 such as a new code deployment, configuration change, auto-scaling activity, or auto-healing event. As you investigate the root cause of an incident, the best place to start is to look at what changed. To understand what change caused a problem and what effects propagated across your stack, you need to be able to see how the relationships between the stack's components have changed over time:
- What did the stack look like when a problem began?
- What components are affected?
- How are all the alerts related?
We call this level of insight, which lets you track cause and effect across your stack, causal observability — it builds on the foundation laid in Levels 1 and 2.
Topology is the first necessary dimension for causal observability. Topology is a map of all the components in your IT environment that spans all layers, from network to application to storage, showing how everything is related. Topology incorporates logical dependencies, physical proximity, and other relationships between components to provide human-readable visualization and operationalized relationship data.
Modern environments consist of so many dynamic layers, microservices, serverless applications, and network technology that adding an up-to-date topology to your observability mix is essential to separate cause from effect. Topology provides anchor points for thousands of unconnected data streams to give them structure, making previously invisible connections visible. Topology visualization lets you view telemetry from network, infrastructure, application, and other areas in the context of full-stack activity; it also gives you crucial context to know how your business is affected when something breaks.
For most companies, adding topology is not enough to provide causal observability on its own. The second necessary dimension is time. To understand the dynamic behaviors of modern IT environments and get the context required to achieve causal observability, you need to correlate your environment's topology with its associated metric, log, event, and trace data over time.
Figure 2: Capture time-series topology to track stack changes and find root cause
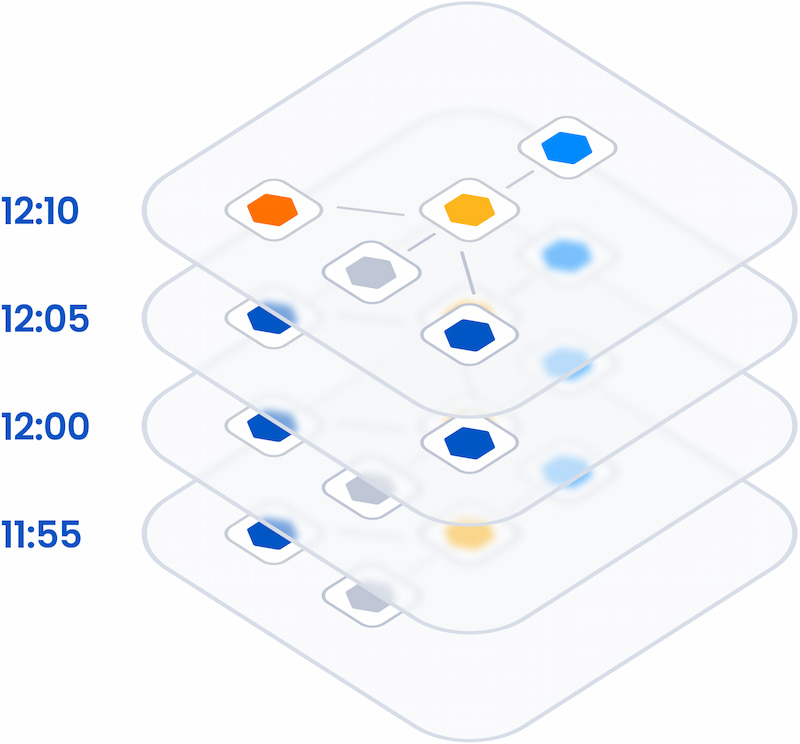
At Level 3, the additional dimensions of topology and time show you the cause and impact of any change or failure across the different layers, data silos, teams, and technologies — significantly improving resolution times and business outcomes. You also have the foundation to begin automating root cause analysis, business impact analysis, and alert correlation.
Table 5: Level 3 summary
| Causal Observability |
| Contextualize telemetry data (metrics, traces, events, logs) through a single topology. Correlate all data over time to track changes as they propagate across your stack. |
| System input |
System output |
| Levels 1 and 2 + time-series topology |
Levels 1 and 2 + correlated topology, telemetry, and time data displayed in contextual visualizations, showing the effects of changes across your stack |
| What you get |
- Clear, correlated, contextual view of the environment's state through unification of siloed data in a time-series topology
- Significant acceleration in resolution times through topology visualization and analysis to understand cause and effect
- Foundation for basic automated investigations such as root cause analysis, business impact analysis, and alert correlation
- Context needed to automatically cluster alerts related to the same root cause, reducing noise and distractions
- Ability to visualize the impact of network, infrastructure, and application events on business services and customers |
Next Step: Proactive Observability With AIOps
Level 3 is a big step forward, but unifying data from different silos poses challenges in terms of data normalization, correlation, and quality that may require new capabilities or even organizational changes to resolve. In addition, it is difficult to collect and operationalize high-quality topology data at scale, especially in less modern environments. Storing topology that is correlated with telemetry over time presents an even bigger challenge. Consider these issues as you develop your implementation plan.
The velocity, volume, and variety of data at Level 3 is usually so large that to achieve your overall reliability goals, AI is likely necessary to help separate the signal from the noise. When you take the step to Level 4, you add artificial intelligence for IT operations (AIOps) on top of Levels 1-3 to gain more accurate insights.
Level 4: Proactive Observability With AIOps
Analyze large volumes of data, automate responses to incidents, and prevent anomalies from becoming problems.
Proactive Observability With AIOps is the most advanced level of the Observability Maturity Model. AIOps, in the context of monitoring and observability, is about applying AI and machine learning (ML) to sort through mountains of data. AIOps platforms analyze metrics, logs, traces, events, and topology to find patterns that drive proactive responses at the soonest opportunity, by both humans and automated systems. They serve four key functions for observability:
- Analyze complex data across domains, layers, and teams
- Correlate related events and alerts to reduce noise
- Recognize patterns that give early warning of impending issues and point to probable root cause
- Assist with automated remediation, often supplying more precise information to self-healing systems (probable root cause, correlated alerts, etc.)
AIOps builds on core capabilities from previous levels in this maturity model — such as gathering and operationalizing data, topology assembly, and correlation of data — and adds in pattern recognition, anomaly detection, and more accurate suggestions for remediating issues. Causal Observability is a necessary foundation: Time-series topology provides an essential framework.
AIOps can help teams find problems faster and even prevent them altogether. AI/ML algorithms look for changes in patterns that precede warnings, alerts, and failures, helping teams know when a service or component starts to deviate from normal behavior and address the issue before something fails. However, anomalies occur frequently. They do not necessarily mean a problem will occur nor that remediation will be high priority. AIOps helps determine which anomalies require attention and which can be ignored.
Another goal of AIOps for observability is to drive automated remediation through IT service management (ITSM) and self-healing systems. If these systems receive incorrect root cause input, for example, they can self-correct the wrong issue and cause bigger problems. AIOps delivers more accurate input that enhances their effectiveness.
At Level 4, you should notice more efficient and incident-free IT operations that deliver a better customer experience. To achieve these goals, set up AIOps to transcend silos and ingest data gathered from across the environment. The AI/ML models should analyze all the observability data types we discussed in previous levels: events, metrics, logs, traces, changes, and topology, all correlated over time.
Table 6: Level 4 summary
| Proactive Observability With AIOps |
| Use AIOps to sort through mountains of data and identify the most significant patterns and impactful events so teams can focus their time on what matters. |
| System input |
System output |
| Levels 1-3 + AI/ML models |
Levels 1-3 + proactive insights that enable fast MTTR and prevent failures |
| What you get |
- New insights into IT environment operations using AI/ML to gather and correlate actionable information from large volumes of data
- Predictions and anomaly detection that highlight issues before they impact the business
- Greater efficiency and reduced toil as teams focus effort on the most impactful events
- Improved accuracy of automatic root cause analysis, business impact analysis, and alert correlation
- Incident data that is accurate enough to use effectively with automated ITSM and self-healing systems |
Next Steps
Most AIOps solutions today require significant configuration and training time but often yield inaccurate results, especially if topology changes over time are not considered. Right now, AIOps can take a long time to show results and demonstrate ROI, but platforms continue to improve. Level 4 is the final observability maturity level for now, but as IT continues to evolve, we fully expect a Level 5 to emerge.