A Quick Guide For React Native Debugging
Join the DZone community and get the full member experience.
Join For FreeBuy my first book The Practical React Native - a book for a beginner to intermediate level React Native developers, will guide you to build a simple app that serves post from WordPress API. It covers essential topics in the React Native development cycle such as React Hook, React Navigation, Dark mode, Offline handler, In-app purchase, and Admob. This book aims to teach you how to create real-world monetizing app features that deliver use cases such as Admob and pay to remove ads. Buy on Gumroad.
React Native Debugger is a powerful tool that helps developers debug React Native applications more quickly. It provides a suite of impressive features, such as UI inspector, redux inspector, breakpoints, and networking inspector. In this article, we are going to learn how to install and use the React Native Debugger, which will boost your development productivity by an order of magnitude.
In layman’s terms, a Debugger is a tool used for debugging. If you are a developer of any programming background, you must have already come across a debugger in your life. React Native Debugger is a standalone debugger tool built using the Electron framework. You can easily integrate this debugger tool along with the Chrome Dev tool. This debugger tool is based on the remote debugger which is included in React Native out of the box. However, the React Native debugger packs a lot more features than the remote one.
Installing React Native Debugger
The installation process is quite easy. We can simply download the latest installation file from the release page. For macOS, we can use Homebrew Cask to install. We can run the following command in the terminal:
xxxxxxxxxx
brew update && brew cask install react-native-debugger
After installation, simply open the React Native Debugger.app file in your Applications folder (or use Spotlight search to locate it).
Using The React Native Debugger
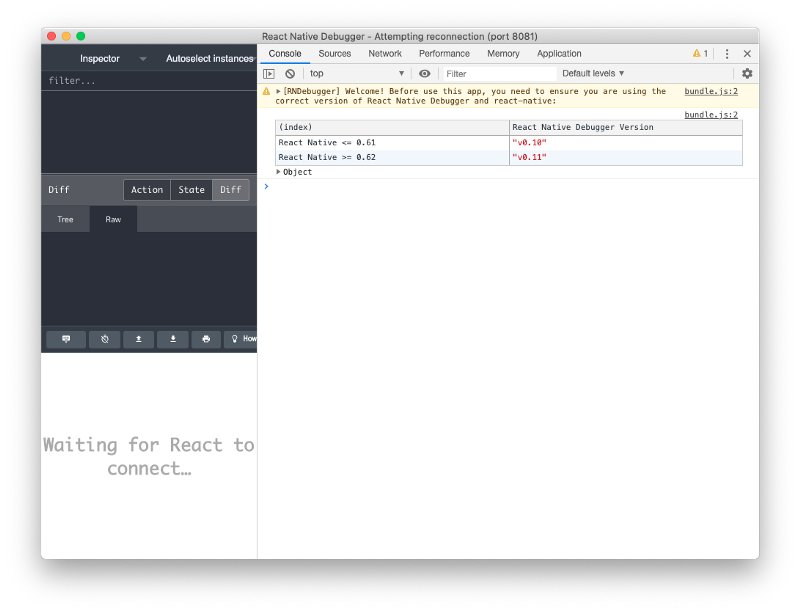
After a successful installation, we can simply open the React Native Debugger launch file. Hence, we will see the re-connection status on the title bar of the debugger app window. The debugging process will be executed on port 8081 as shown in the screenshot below:
Now, when we run the React Native App on debug mode, we no longer need to open the browser. To have your React Native app enter debug mode, simply shake your device and choose “Debug” in the menu that pops up. If you are on a simulator, simply press Command + Shift + Z to open the menu.
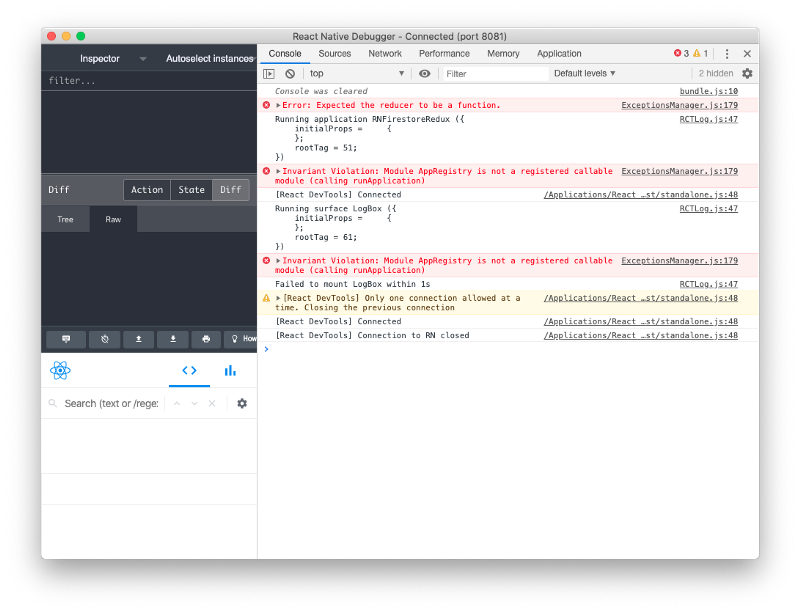
Once the app is in the debug mode, with the React Native Debugger already opened, you will notice that the app connects to the React Native Debugger instead of the Chrome Dev Tools. All the console logs and debugging options will appear in the debugger app as shown in the screenshot below:
Now, as we have learned about the installation and use cases, we are ready to use this Debugger app.
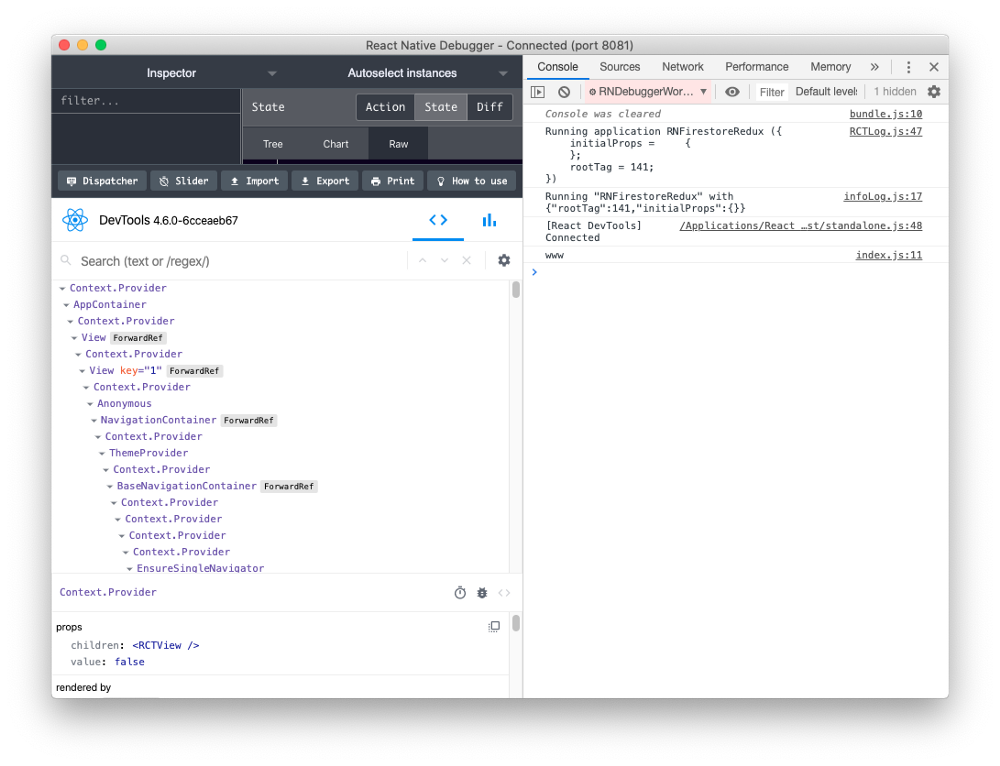
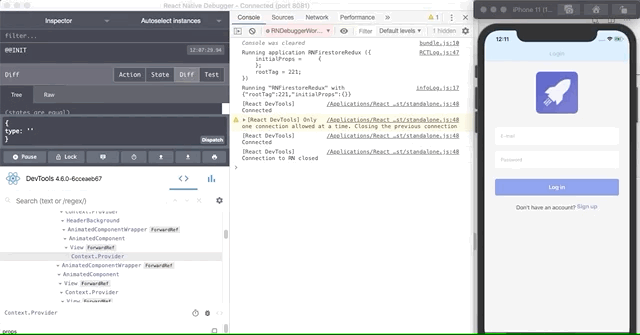
Chrome Dev Tools, React Dev Tools, Redux Dev tools
As you can notice, all these above important debugging extensions are under a single window. One benefit is that the app window size does not need to be full screen. Hence, we can use the debugger adjacently with the emulator as shown in the screenshot below:
The Network Inspector
When developing an app that needs to connect to a server, in general, we may not know what is going on behind the scenes. For example, when we are sending a request to the server, it may be difficult to track an error if it occurs. Developers usually debug this by printing or alerting error messages, but this is extremely time-consuming (despite the fact that most people do that), since it takes a lot of iterations to understand the entire state properly.
So, with the help of the React Native Debugger, we can easily monitor every inbound and outbound traffic request between app and server.
- We can monitor React components, Redux store, also network activity all under a single window.
- We can modify CORS on the fly.
- We can modify the request header configurations such as names, origin, and user-agent. It enables us to control everything in a network request.
AsyncStorage Management
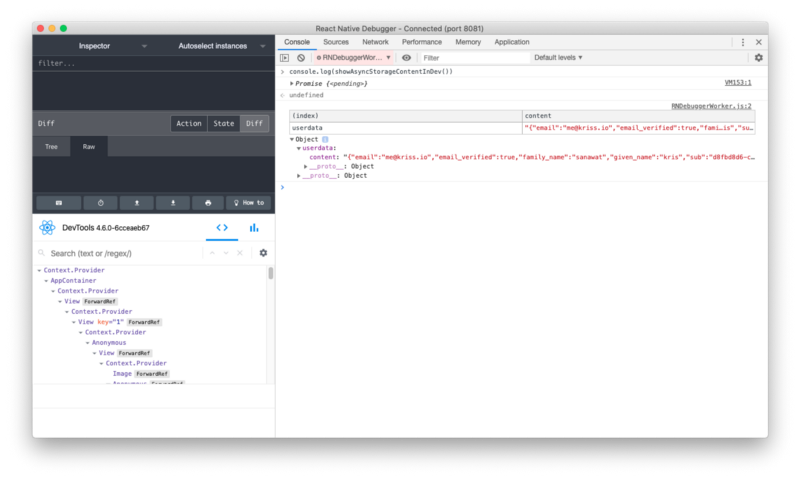
We can also debug AsyncStorage configurations using the React Native Debugger. We can simply log it to the console using the line in the code snippet below:
xxxxxxxxxx
console.log(showAsyncStorageContentInDev())
Once you add that line to your project, you will get the following result in the React Native Debugger console window:
Debugging Redux State and Actions
As mentioned in the official React Native Debugger documentation, the tool already has an amazingly powerful built-in Redux Dev Tool. However, redux devtools will not work properly until we explicitly activate redux devtools in our app. In order to use redux devtools in the react-native-debugger, we need to activate redux in our app by adding some configuration lines to our App.js file or to our redux main function as highlighted in the code snippet below:
xxxxxxxxxx
const composeEnhancers = window.__REDUX_DEVTOOLS_EXTENSION_COMPOSE__ || compose;
const store = createStore(reducers, /* preloadedState, */ composeEnhancers(middlewares));
Now if we reload our RN Debugger tool and run some actions, we will get the following result in our debugger console:
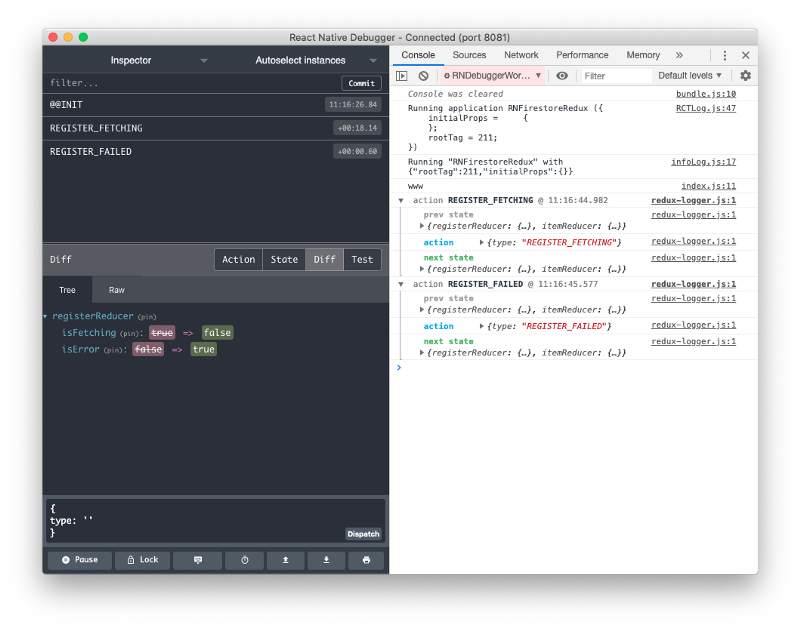
As you can see, the React Native Debugger exposes the whole Redux state, so there’s no need for you to add breakpoints or console logs to understand how the data flows within the redux ecosystem. One amazing feature is that you can actually go back in time directly from the debugger, to reverse the Redux actions and re-run them again. Another huge feature is that you can visualize the precise diff between two state transitions, which is extremely helpful for apps with complex Redux states.
UI Inspector in React Native Debugger
The React Native Debugger tool also offers a powerful UI Inspector. We can use it to inspect app UI layouts that will help us tremendously in understanding the app’s UI structure. We can fix the UI elements style just by inspecting the layout.
This is by far the most efficient way to inspect the UI hierarchy in React Native apps and to debug layout issues.
Breakpoints in React Native Debugger
React Native Debugger also enables us to stop the execution task on a certain point. This will enable developers to understand app behavior or view some data states at any point in the app’s lifecycle. You can learn more details on adding and using breakpoints in our Debugging React Native app with Breakpoints article.
Debugging Expo Apps
If you opted to use Expo CLI instead of React Native CLI for your app development, the good news is that the React Native Debugger works great with Expo too.
Usually, the Expo Debugger runs on port 19001. To switch to React Native Debugger for support, you need to run the following command:
xxxxxxxxxx
open "rndebugger://set-debugger-loc?host=localhost&port=19001"
Conclusion
In this article post, we discovered the React Native Debugger tool, its installation process, how it works, use-cases, and core features. Surely, it will make the life of any React Native developer easier, more productive, and more efficient. Your apps will also be more performant and will contain fewer bugs.
We highly recommend using the React Native Debugger instead of the Chrome Dev Tools, since it contains a set of core features that will boost your development speed tremendously.
Published at DZone with permission of krissanawatt kaewsanmunag. See the original article here.
Opinions expressed by DZone contributors are their own.
Comments