Analyze Your ALB/NLB Logs With ClickHouse
Explore AWS Load Balancer Logs with ClickHouse for efficient log analysis and implement a scalable solution to analyze AWS NLB or ALB access logs in real time.
Join the DZone community and get the full member experience.
Join For FreeIn the dynamic world of cloud computing, data engineers are constantly challenged with managing and analyzing vast amounts of data. A critical aspect of this challenge is effectively handling AWS Load Balancer Logs. This article examines the integration of AWS Load Balancer Logs with ClickHouse for efficient log analysis. We start by exploring AWS’s method of storing these logs in S3 and its queuing system for data management. The focus then shifts to setting up a log analysis framework using S3 and ClickHouse, highlighting the process with Terraform. The goal is to provide a clear and practical guide for implementing a scalable solution for analyzing AWS NLB or ALB access logs in real time.
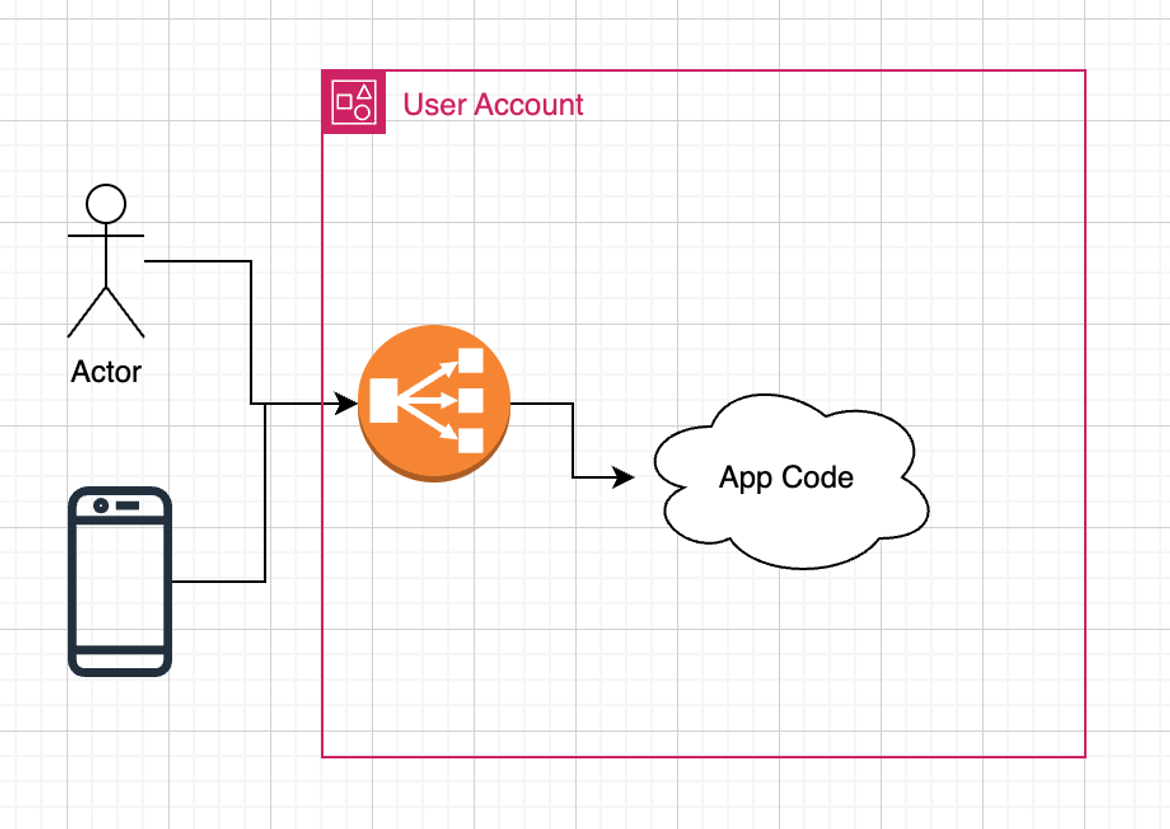
To understand the application of this process, consider a standard application using an AWS Load Balancer. Load Balancers, as integral components of AWS services, direct logs to an S3 bucket. This article will guide you through each step of the process, demonstrating how to make these crucial load-balancer logs available for real-time analysis in ClickHouse, facilitated by Terraform. However, before delving into the specifics of Terraform’s capabilities, it’s important to first comprehend the existing infrastructure and the critical Terraform configurations that enable the interaction between S3 and SQS for the ALB.
Setting Up the S3 Log Storage
Begin by establishing an S3 bucket for ALB log storage. This initial step is vital and involves linking an S3 bucket to your ALB. The process starts with creating an S3 Bucket, as demonstrated in the provided code snippet (see /example_projects/transfer/nlb_observability_stack/s3.tf#L1-L3).
resource "aws_s3_bucket" "nlb_logs" {
  bucket = var.bucket_name
}
The code snippet demonstrates the initial step of establishing an S3 bucket. This bucket is specifically configured for storing AWS ALB logs, serving as the primary repository for these logs.
resource "aws_lb" "alb" {
  /* your config
	*/

  dynamic "access_logs" {
    for_each = var.access_logs_bucket != null ? { enabled = true } : {}

    content {
      enabled = true
      bucket  = var.bucket_name
      prefix  = var.access_logs_bucket_prefix
    }
  }
}
Next, we configure an SQS queue that works in tandem with the S3 bucket. The configuration details for the SQS queue are outlined here.
resource "aws_sqs_queue" "nlb_logs_queue" {
  name   = var.sqs_name
  policy = <<POLICY
{
  "Version": "2012-10-17",
  "Id": "sqspolicy",
  "Statement": [
    {
      "Effect": "Allow",
      "Principal": "*",
      "Action": "sqs:SendMessage",
      "Resource": "arn:aws:sqs:*:*:${var.sqs_name}",
      "Condition": {
        "ArnEquals": { "aws:SourceArn": "${aws_s3_bucket.nlb_logs.arn}" }
      }
    }
  ]
}
POLICY
}
This code initiates the creation of an SQS queue, facilitating the seamless delivery of ALB logs to the designated S3 bucket.
As logs are delivered, they are automatically organized within a dedicated folder:
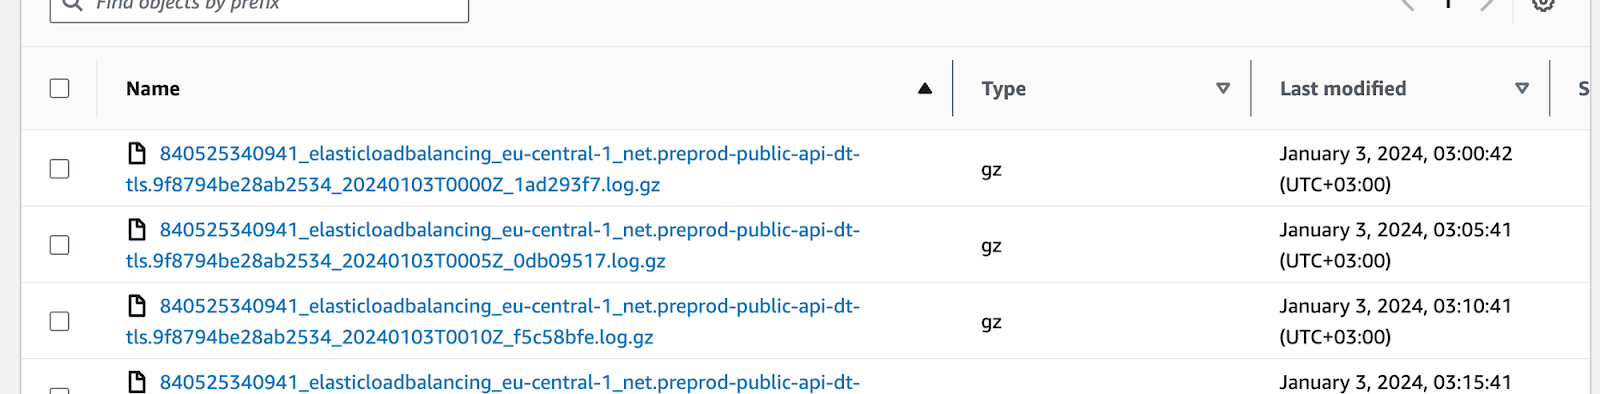
Regularly generated new log files demand a streamlined approach for notification and processing. To establish a seamless notification channel, we'll configure an optimal push notification system via SQS. Referencing the guidelines outlined in Amazon S3's notification configuration documentation, our next step involves the creation of an SQS queue. This queue will serve as the conduit for receiving timely notifications, ensuring prompt handling and processing of newly generated log files within our S3 bucket.
This linkage is solidified through the creation of the SQS queue (see /example_projects/transfer/nlb_observability_stack/s3.tf#L54-L61).
resource "aws_s3_bucket_notification" "nlb_logs_bucket_notification" {
  bucket = aws_s3_bucket.nlb_logs.id

  queue {
    queue_arn = aws_sqs_queue.nlb_logs_queue.arn
    events    = ["s3:ObjectCreated:*"]
  }
}
The configurations established thus far form the core infrastructure for our log storage system. We have methodically set up the S3 bucket, configured the SQS queue, and carefully linked them. This systematic approach lays the groundwork for efficient log management and processing, ensuring that each component functions cohesively in the following orchestrated setup: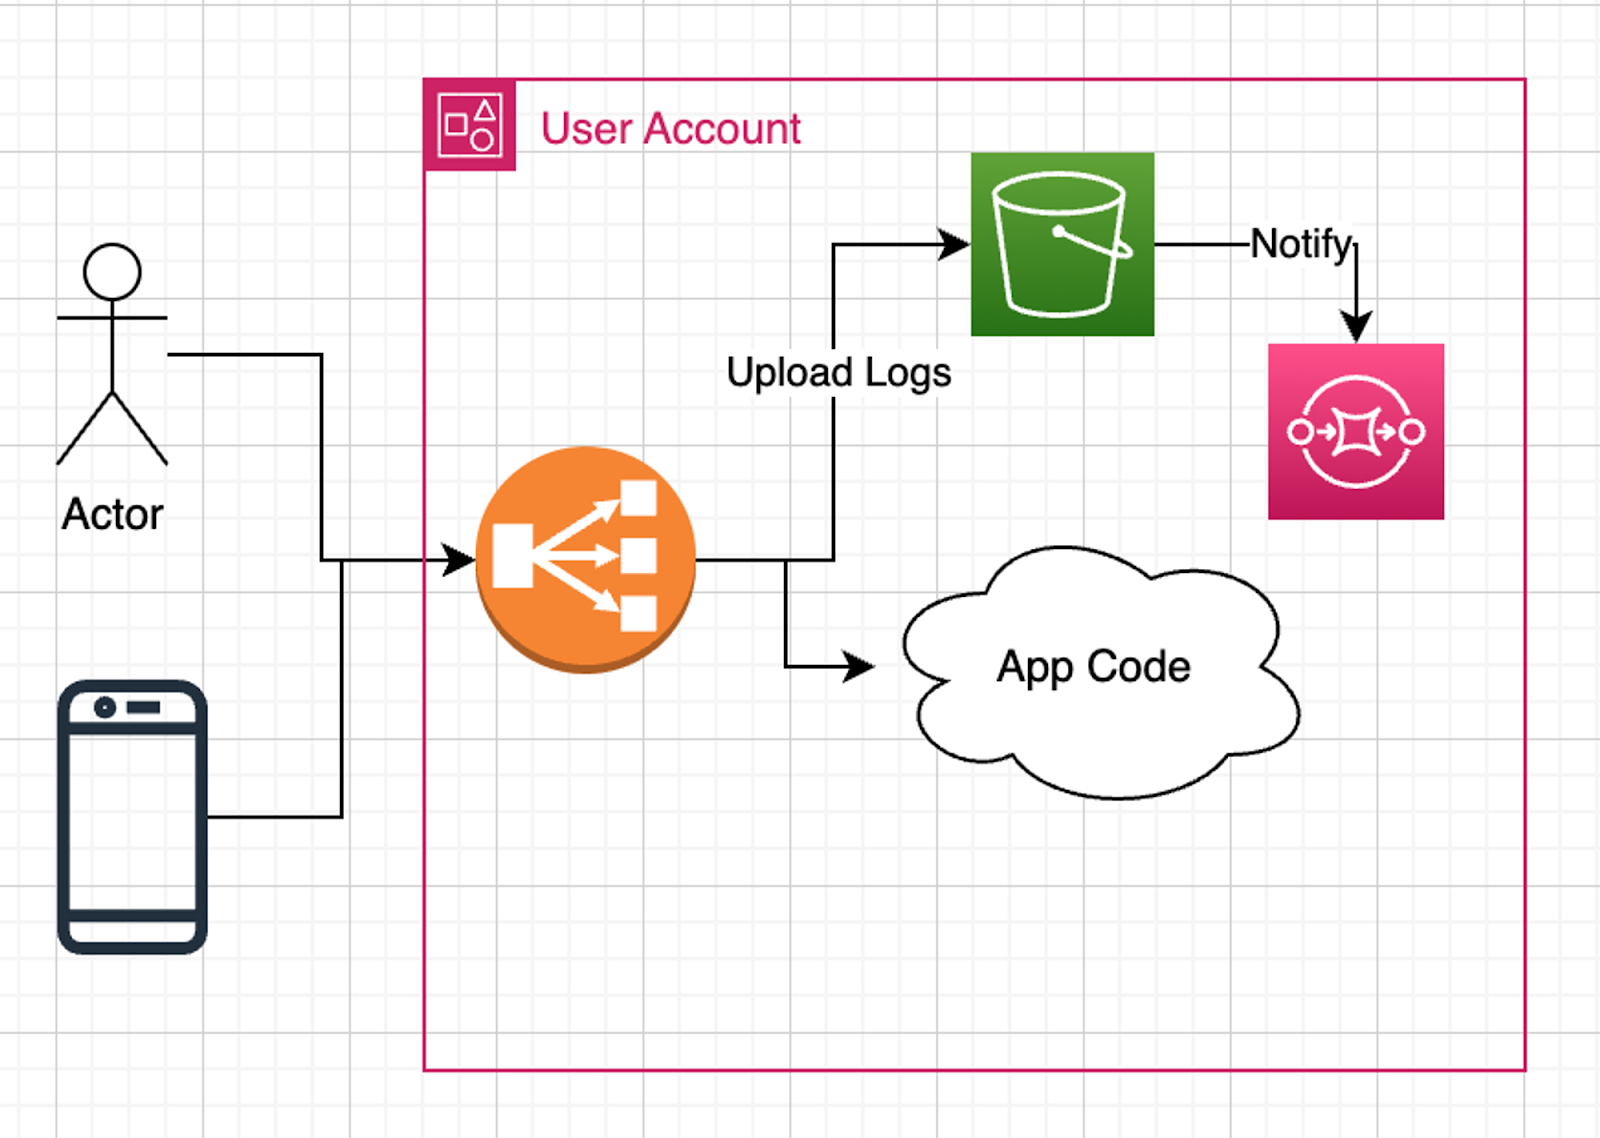
The illustration above showcases the composed architecture, where the S3 bucket, SQS queue, and their interconnection stand as pivotal components for storing and managing logs effectively within the AWS environment.
Logs are now in your S3 bucket, but reading these logs may be challenging. Let’s take a look at a data sample:
tls 2.0 2024-01-02T23:58:58 net/preprod-public-api-dt-tls/9f8794be28ab2534 4d9af2ddde90eb82 84.247.112.144:33342 10.0.223.207:443 244 121 0 15 - arn:aws:acm:eu-central-1:840525340941:certificate/5240a1e4-c7fe-44c1-9d89-c256213c5d23 - ECDHE-RSA-AES128-GCM-SHA256 tlsv12 - 18.193.17.109 - - "%ef%b5%bd%8" 2024-01-02T23:58:58The snippet above represents a sample of the log data residing within the S3 bucket. Understanding this data's format and content will help us to build an efficient strategy to parse and store it.
Let’s move this data to DoubleCloud Managed Clickhouse.
Configuring VPC and ClickHouse With DoubleCloud
The next step involves adding a Virtual Private Cloud (VPC) and a managed ClickHouse instance. These will act as the primary storage systems for our logs, ensuring secure and efficient log management (see /example_projects/transfer/nlb_observability_stack/network.tf#L1-L7).
resource "doublecloud_network" "nlb-network" {
  project_id      = var.project_id
  name            = var.network_name
  region_id       = var.region
  cloud_type      = var.cloud_type
  ipv4_cidr_block = var.ipv4_cidr
}
Next, we’ll demonstrate how to integrate a VPC and ClickHouse into our log storage setup. The following step is to establish a ClickHouse instance within this VPC, ensuring a seamless and secure storage solution for our logs (see /example_projects/transfer/nlb_observability_stack/ch.tf#L1-L35).
resource "doublecloud_clickhouse_cluster" "nlb-logs-clickhouse-cluster" {
  project_id = var.project_id
  name       = var.clickhouse_cluster_name
  region_id  = var.region
  cloud_type = var.cloud_type
  network_id = resource.doublecloud_network.nlb-network.id

  resources {
    clickhouse {
      resource_preset_id = var.clickhouse_cluster_resource_preset
      disk_size          = 34359738368
      replica_count      = 1
    }
  }

  config {
    log_level       = "LOG_LEVEL_INFORMATION"
    max_connections = 120
  }

  access {
    data_services = ["transfer"]
    ipv4_cidr_blocks = [
      {
        value       = var.ipv4_cidr
        description = "VPC CIDR"
      }
    ]
  }
}

data "doublecloud_clickhouse" "nlb-logs-clickhouse" {
  project_id = var.project_id
  id         = doublecloud_clickhouse_cluster.nlb-logs-clickhouse-cluster.id
}
Integrating S3 Logs With ClickHouse
To link S3 and ClickHouse, we utilize DoubleCloud Transfer, an ELT (Extract, Load, Transform) tool. The setup for DoubleCloud Transfer includes configuring both the source and target endpoints. Below is the Terraform code outlining the setup for the source endpoint (see /example_projects/transfer/nlb_observability_stack/transfer.tf#L1-L197).
resource "doublecloud_transfer_endpoint" "nlb-s3-s32ch-source" {
  name       = var.transfer_source_name
  project_id = var.project_id
  settings {
    object_storage_source {
      provider {
        bucket                = var.bucket_name
        path_prefix           = var.bucket_prefix
        aws_access_key_id     = var.aws_access_key_id
        aws_secret_access_key = var.aws_access_key_secret
        region                = var.region
        endpoint              = var.endpoint
        use_ssl               = true
        verify_ssl_cert       = true
      }
      format {
        csv {
          delimiter = " " // space as delimiter
          advanced_options {
          }
          additional_options {
          }
        }
      }
      event_source {
        sqs {
          queue_name = var.sqs_name
        }
      }
      result_table {
        add_system_cols = true
        table_name      = var.transfer_source_table_name
        table_namespace = var.transfer_source_table_namespace
      }
      result_schema {
        data_schema {
          fields {
            field {
              name     = "type"
              type     = "string"
              required = false
              key      = false
              path     = "0"
            }
            field {
              name     = "version"
              type     = "string"
              required = false
              key      = false
              path     = "1"
            }
            /*
	            Rest of Fields
            */
            field {
              name     = "tls_connection_creation_time"
              type     = "datetime"
              required = false
              key      = false
              path     = "21"
            }
          }
        }
      }
    }
  }
}
This Terraform snippet details the setup of the source endpoint, including S3 connection specifications, data format, SQS queue for event notifications, and the schema for data in the S3 bucket. Next, we focus on establishing the target endpoint, which is straightforward with ClickHouse (see /example_projects/transfer/nlb_observability_stack/transfer.tf#L199-L215).
resource "doublecloud_transfer_endpoint" "nlb-ch-s32ch-target" {
  name       = var.transfer_target_name
  project_id = var.project_id
  settings {
    clickhouse_target {
      clickhouse_cleanup_policy = "DROP"
      connection {
        address {
          cluster_id = doublecloud_clickhouse_cluster.nlb-logs-clickhouse-cluster.id
        }
        database = "default"
        password = data.doublecloud_clickhouse.nlb-logs-clickhouse.connection_info.password
        user     = data.doublecloud_clickhouse.nlb-logs-clickhouse.connection_info.user
      }
    }
  }
}
The preceding code snippets for the source and target endpoints can now be combined to create a complete transfer configuration, as demonstrated in the following Terraform snippet (see /example_projects/transfer/nlb_observability_stack/transfer.tf#L217-L224).
resource "doublecloud_transfer" "nlb-logs-s32ch" {
  name       = var.transfer_name
  project_id = var.project_id
  source     = doublecloud_transfer_endpoint.nlb-s3-s32ch-source.id
  target     = doublecloud_transfer_endpoint.nlb-ch-s32ch-target.id
  type       = "INCREMENT_ONLY"
  activated  = false
}
With the establishment of this transfer, a comprehensive delivery pipeline takes shape:
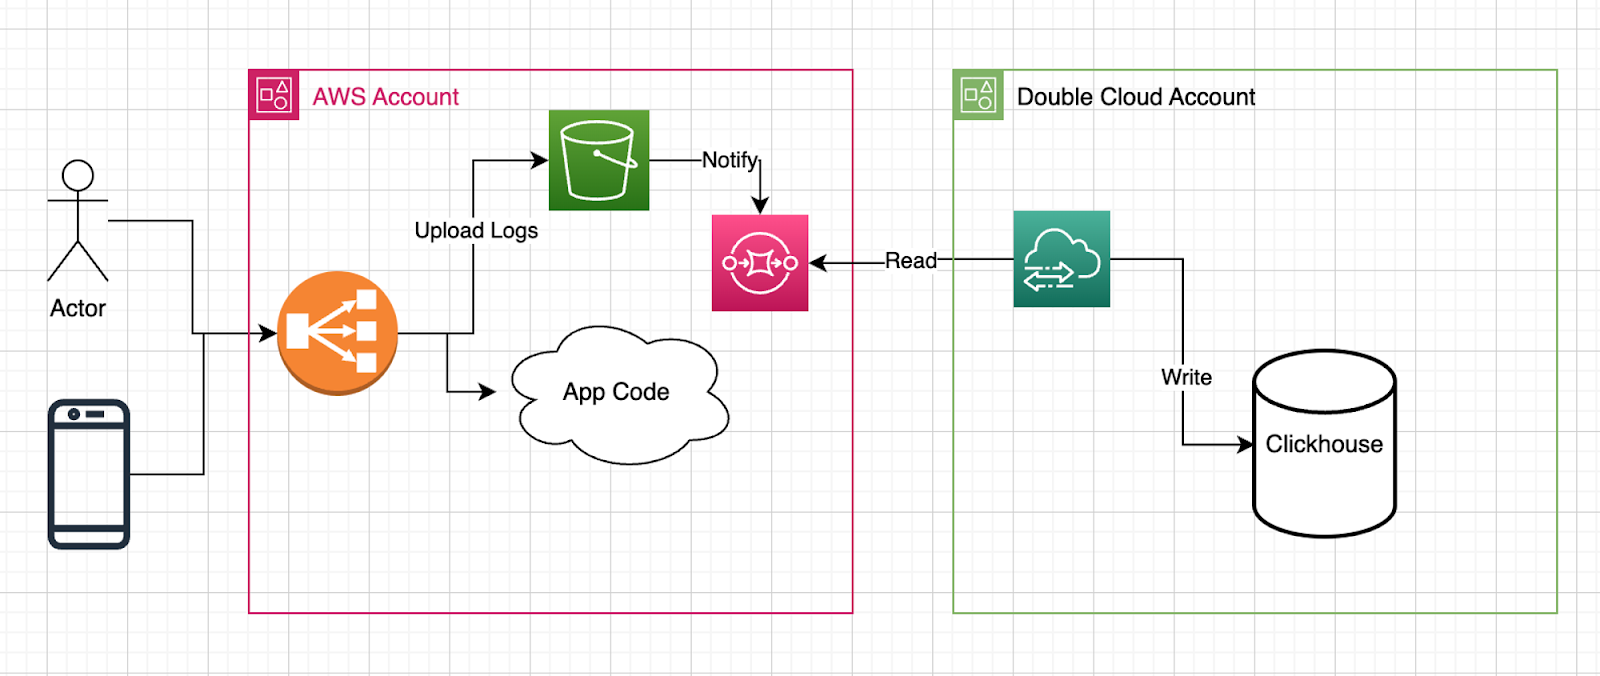

The illustration above represents the culmination of our efforts — a complete delivery pipeline primed for seamless data flow. This integrated system, incorporating S3, SQS, VPC, ClickHouse, and the orchestrated configurations, stands ready to handle, process, and analyze log data efficiently and effectively at any scale.
Exploring Logs in ClickHouse
With ClickHouse set up, we now turn our attention to analyzing the data. This section guides you through querying your structured logs to extract valuable insights from the well-organized dataset. To begin interacting with your newly created database, the ClickHouse-client tool can be utilized:
clickhouse-client \
	--host $CH_HOST \
	--port 9440 \
	--secure \
	--user admin \
	--password $CH_PASSWORD
Begin by assessing the overall log count in your dataset. A straightforward query in ClickHouse will help you understand the scope of data you’re dealing with, providing a baseline for further analysis.
SELECT count(*)
FROM logs_alb

Query id: 6cf59405-2a61-451b-9579-a7d340c8fd5c

┌──count()─┐
│ 15935887 │
└──────────┘

1 row in set. Elapsed: 0.457 sec.
Now, we'll focus on retrieving a specific row from our dataset. Executing this targeted query allows us to inspect the contents of an individual log entry in detail.
SELECT *
FROM logs_alb
LIMIT 1
FORMAT Vertical

Query id: 44fc6045-a5be-47e2-8482-3033efb58206

Row 1:
──────
type:                         tls
version:                      2.0
time:                         2023-11-20 21:05:01
elb:                          net/*****/*****
listener:                     92143215dc51bb35
client_port:                  10.0.246.57:55534
destination_port:             10.0.39.32:443
connection_time:              1
tls_handshake_time:           -
received_bytes:               0
sent_bytes:                   0
incoming_tls_alert:           -
chosen_cert_arn:              -
chosen_cert_serial:           -
tls_cipher:                   -
tls_protocol_version:         -
tls_named_group:              -
domain_name:                  -
alpn_fe_protocol:             -
alpn_be_protocol:             -
alpn_client_preference_list:  -
tls_connection_creation_time: 2023-11-20 21:05:01
__file_name:                  api/AWSLogs/******/elasticloadbalancing/eu-central-1/2023/11/20/****-central-1_net.****.log.gz
__row_index:                  1
__data_transfer_commit_time:  1700514476000000000
__data_transfer_delete_time:  0

1 row in set. Elapsed: 0.598 sec.
Next, we'll conduct a simple yet revealing analysis. By running a “group by” query, we aim to identify the most frequently accessed destination ports in our dataset.
SELECT
    destination_port,
    count(*)
FROM logs_alb
GROUP BY destination_port

Query id: a4ab55db-9208-484f-b019-a5c13d779063

┌─destination_port──┬─count()─┐
│ 10.0.234.156:443  │   10148 │
│ 10.0.205.254:443  │   12639 │
│ 10.0.209.51:443   │   13586 │
│ 10.0.223.207:443  │   10125 │
│ 10.0.39.32:443    │ 4860701 │
│ 10.0.198.39:443   │   13837 │
│ 10.0.224.240:443  │    9546 │
│ 10.10.162.244:443 │  416893 │
│ 10.0.212.130:443  │    9955 │
│ 10.0.106.172:443  │ 4860359 │
│ 10.10.111.92:443  │  416908 │
│ 10.0.204.18:443   │    9789 │
│ 10.10.24.126:443  │  416881 │
│ 10.0.232.19:443   │   13603 │
│ 10.0.146.100:443  │ 4862200 │
└───────────────────┴─────────┘

15 rows in set. Elapsed: 1.101 sec. Processed 15.94 million rows, 405.01 MB (14.48 million rows/s., 368.01 MB/s.)
Conclusion
This article has outlined a comprehensive approach to analyzing AWS Load Balancer Logs using ClickHouse, facilitated by DoubleCloud Transfer and Terraform. We began with the fundamental setup of S3 and SQS for log storage and notification, before integrating a VPC and ClickHouse for efficient log management. Through practical examples and code snippets, we demonstrated how to configure and utilize these tools for real-time log analysis.
The seamless integration of these technologies not only simplifies the log analysis process but also enhances its efficiency, offering insights that are crucial for optimizing cloud operations. Explore the complete example in our Terraform project here for a hands-on experience with log querying in ClickHouse. The power of ClickHouse in processing large datasets, coupled with the flexibility of AWS services, forms a robust solution for modern cloud computing challenges.
As cloud technologies continue to evolve, the techniques and methods discussed in this article remain pertinent for IT professionals seeking efficient and scalable solutions for log analysis.
Opinions expressed by DZone contributors are their own.
Comments