Audit Trail Dashboard with CloudBees Jenkins Analytics
In this post, we will explore how to integrate the Audit Trail plugin with CloudBees Jenkins Analytics to provide a centralized audit dashboard of audit activity.
Join the DZone community and get the full member experience.
Join For FreeAnalytics is an important feature of the CloudBees Jenkins Platform. Elasticsearch is used to index build and performance data of CloudBees Jenkins Enterprise masters that are connected to CloudBees Jenkins Operations Center (and optionally index data from CloudBees Jenkins Operations Center as well), and display that information via a set of built-in Kibana dashboards. However, your are not limited to the provided dashboards and may modify them or create completely new dashboards. Kibana is exposed via the CloudBees Jenkins Operations Center Analytics Dashboard Creator link, allowing you to customize existing dashboards or create new ones. In this post, I will walk you through the process of creating a custom Kibana dashboard for a very specific use case: a Jenkins Audit Trail dashboard.
Jenkins and Audit Tracking
Tracking changes is an important part of most enterprise organizations, whether it is for legal compliance, enterprise policies, other standards, all of the above or something else entirely. In the IT space, this type of tracking is often referred to as audit logging or an audit trail. Valentina Armenise explored audit logging strategies for Jenkins over a year ago.
In this post, we will explore how to integrate one of the plugins mentioned in Valentina’s post, the Audit Trail plugin, with CloudBees Jenkins Analytics to provide a centralized audit dashboard of audit activity across multiple CloudBees Jenkins Enterprise masters connected to the CloudBees Jenkins Operations Center.
Putting it all Together: Audit Trail Analytics
Logstash and Syslog
In order to view data in a CloudBees Jenkins Analytics dashboard, it has to be available in the Elasticsearch index configured to be used by CloudBees Jenkins Operations Center. However, we don’t want to pollute the existing build-* and metrics-* indexes with audit data, so we will create a new Elasticsearch index and we will see how this will make it much easier to create our custom Audit Trail dashboard.
There are a number of ways to push data into Elasticsearch, but we are going to use Logstash because it is able to easily consume the Syslog format as input and because the Audit Trail plugin supports Syslog as one of its outputs. More specifically, the Audit Trail plugin supports the output of RFC 3164 compliant Syslog - making it very easy for Logstash to consume and manipulate.
We are going to run Logstash as a Docker container using the official image from Docker Hub. Starting the logstash container with the following command (the logstash configuration is included in the docker run command) will allow it to consume Syslog output from the Jenkins Audit Trail plugin and output that data into a custom ‘audit-trail-*’ Elasticsearch index via the Logstash Elasticsearch plugin using the dynamic syntax for the index. In this case, a new index will be created everyday (of course replacing the elasticsearch_url, password, user_name with your values and possibly the ports):
docker run -d -p 5000:5000/udp -p 5000:5000 --restart=always --name=logstash logstash:2.3 logstash -e
  'input {syslog {port => 5000 type => syslog}}
    filter {mutate {rename => { "program" => "master" }}}
    output {stdout { }
    elasticsearch {hosts => "http://{elasticsearch_url}" index => "audit_trail-%{+YYYY.MM.dd}" password => {password} user => "{user_name}"}}'
Also note that we are using the logstash mutate filter to rename the Syslog ‘program’ field to ‘master’ as we will use this field to capture the name of the Jenkins master where the audit activity occurred and renaming it will provide for more meaningful labels in the Kibana dashboard we will create.
One other important consideration is in regards to how Elasticsearch creates indexes and indexes data. If you don’t create an index ahead of time or need dynamic indexes, as in this case where we are creating a new index each day, Elasticsearch will create the index and dynamically map fields based on the first record that is pushed to Elasticsearch to be indexed. This is very important in regards to aggregating data for Kibana based reports, as certain aspects of Kibana dashboards may be difficult to manage and result in undesirable output if fields are analyzed. By default, Elasticsearch will analyze all string based fields with the built-in standard analyzer and will break up fields based on Unicode text segmentation. So, in the case of our master (Syslog App Name) field, it will be tokenized based on dashes, spaces and will be lower-cased. In order to avoid having the master field analyzed we will use an Elasticsearch index template that will allow us to preconfigure the mapping for the ‘master’ field based on a wild-card match to the index name:
curl -u username:password -XPUT http://elasticsearch_url/_template/template_audit_trail -d '
{
  "template": "audit_trail-*",
  "mappings": {
    "syslog": {
      "properties": {
        "master": {
          "type": "string",
          "index": "not_analyzed",
          "store": true
        }
      }
    }
  }
}
'
Once you have the Logstash container running and have set up the custom index template for the ‘master’ field, you are ready to install and configure the Audit Trail plugin in Jenkins.
First, install the Audit Trail plugin via your Jenkins Plugin Manager. Once it is installed you will need to configure it under Manage Jenkins » System Configuration to point to your Logstash instance. Here is an example what the Audit Trail configuration looks like on a Jenkins master:
We have specified the Jenkins master name as the value of the ‘Syslog App Name’ field. Once this is saved, all auditable actions will be pushed to Elasticsearch via Logstash, the same Elasticsearch instance we have configured for CloudBees Jenkins Operations Center to use.
Analytics Dashboard Creator - Kibana
Now that we have Audit Trail data flowing into a new custom index in Elasticsearch it is time to create a custom dashboard to display that data. We start by clicking on the Analytics Dashboard Creator link in CloudBees Jenkins Operations Center, bringing up the Kibana interface. NOTE: Before running through these instructions you will want to push some Audit Trail data from two or more masters to Elasticsearch in order to verify that everything is working - you can save a few job configurations and the Jenkins system config for example.
What follows is a detailed set of instructions to:
- Create a new audit_trail-* index pattern
- Create a new saved Kibana search, Audit Trail Search, based on that index pattern
- Set up two visualizations based on the Audit Trail Search
- Create a new Kibana dashboard that consumes the new search and two new visualizations
- Create a new CloudBees Jenkins Analytics view that will display the new dashboard in CloudBees Jenkins Operations Center
Configure Index Pattern
The first thing we need to do is to add our new audit_trail-* index pattern by clicking Settings and selecting Indices as seen below:
After you have entered the pattern, click the Create button.
Note: The trailing asterisk is very important because the audit data is being indexed daily and without it there will be no match. Non-wildcard index patterns require an exact match.
Create a Saved Search
Now that we have a new index pattern, we will be able to create a new search based on it. Click on the Discover tab in the top navigation and then select the audit_trail-* index pattern from the left drop-down:
Next, under Available Fields, hover over the master field and click the add button; then do the same for the the message field (Time is included by default):
Next, click the save button (disk icon in upper right), name the new search Audit Trail Search and click the Save button:
Now that we have a custom search saved, we can create some visualizations based on it.
Create Visualizations
Select the Visualize tab in the top menu and then select Pie chart from the list of new visualizations:
Next, we will need to select a search source for the visualization - select From a saved search and then select Audit Trail Search:

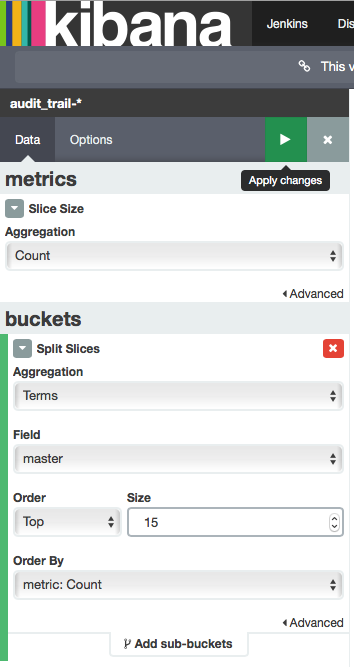
Now we need to customize our new Pie chart visualization. We will stick with the default metrics aggregation type of count, but in order to display something useful we will add a bucket to our visualization by selecting Split Slices underneath the Select bucket types:
Now we need to configure the bucket we just added. For the Aggregation select Terms, then for the Field select master, for Order select Top and for Size enter 15 (default values for everything else):
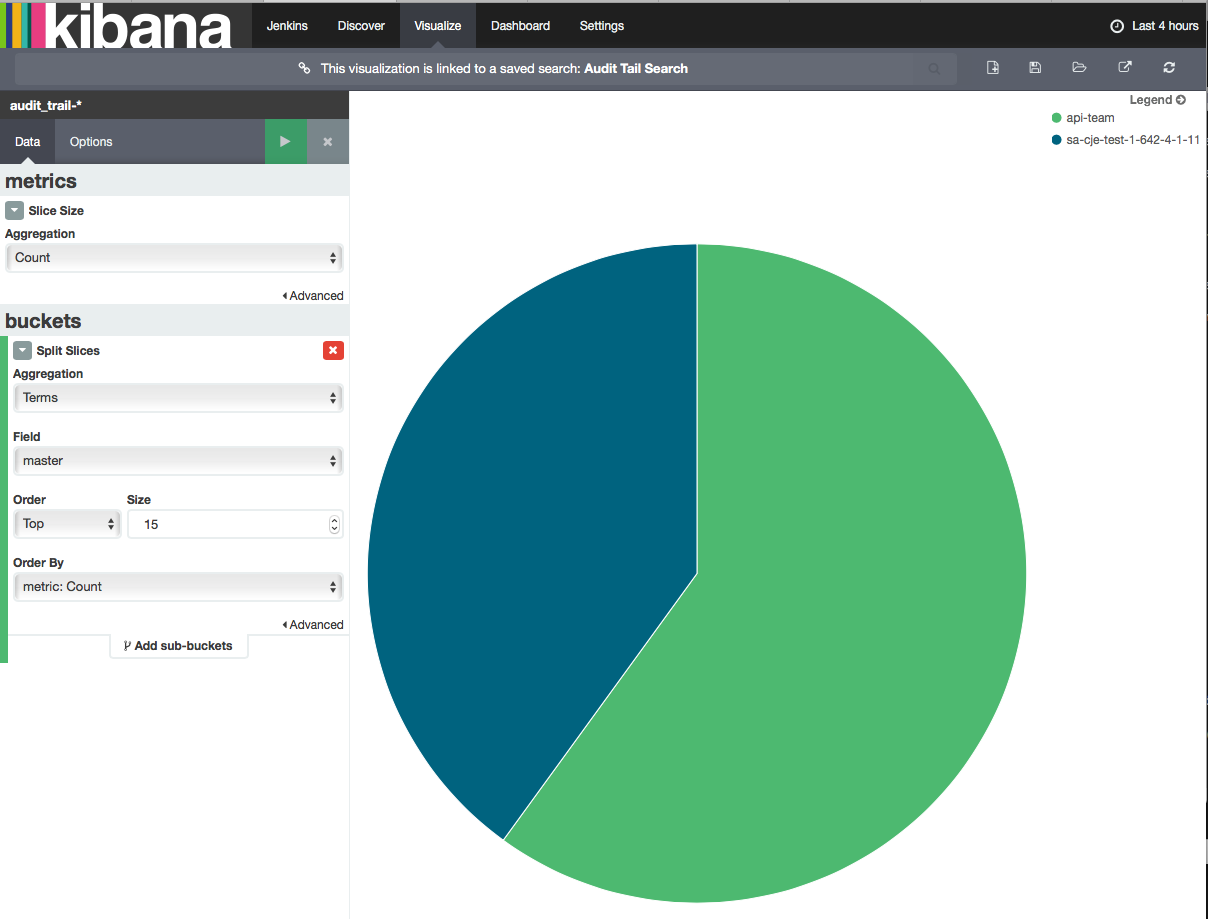
Your new pie chart visualization should look something like this:
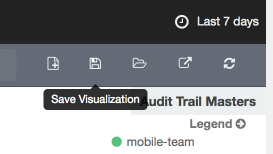
Finally, click on the save icon and save the visualization with a Title of Audit Trail Masters:
Next we will create an Area chart visualization to summarize audit activity on multiple CloudBees Jenkins Enterprise masters over a timeline:

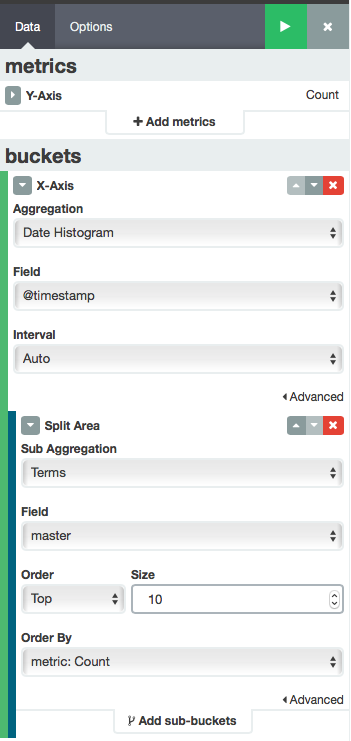
For Step 2 select the saved Audit Trail Search once again. Then to configure the Area chart visualization go with the default settings for the Y-Axis - Count - select X-Axis for the bucket type with an Aggregation value of Date Histogram, @timestamp as the Field value and Auto as the Interval. Then click on Add sub-buckets, selecting Split Area as the bucket type, Terms as the Sub Aggregation value, master for the Field, an Order of Top with a Size of 10 and select metric: count as the Order By value:
Save the visualization with a Title of Audit Trail Summary.
Create a Kibana Dashboard
Now that we have a saved search and two Audit Trail visualizations, we can put them together into a cohesive dashboard. Click on the Dashboard link in the top navigation and then click the
New Dashboard button.

Next, click on the Add Visualization button, search by the word Audit and select the Audit Trail Masters visualization. Resize the visualization slightly and then move to the top-right corner of the dashboard. Repeat those same steps only select the Audit Trail Summary visualization. Resize the Audit Trail Summary visualization to be the same height as the Audit Trail Masters visualization and take up the rest of the width. Next, click on the Searches tab and select the Audit Trail Search that we created earlier (if you don’t see, search for Audit). Adjust the width of the Audit Trail Search visualization to take up the entire width and adjust the height to your liking. You have a dashboard that looks something like the following:
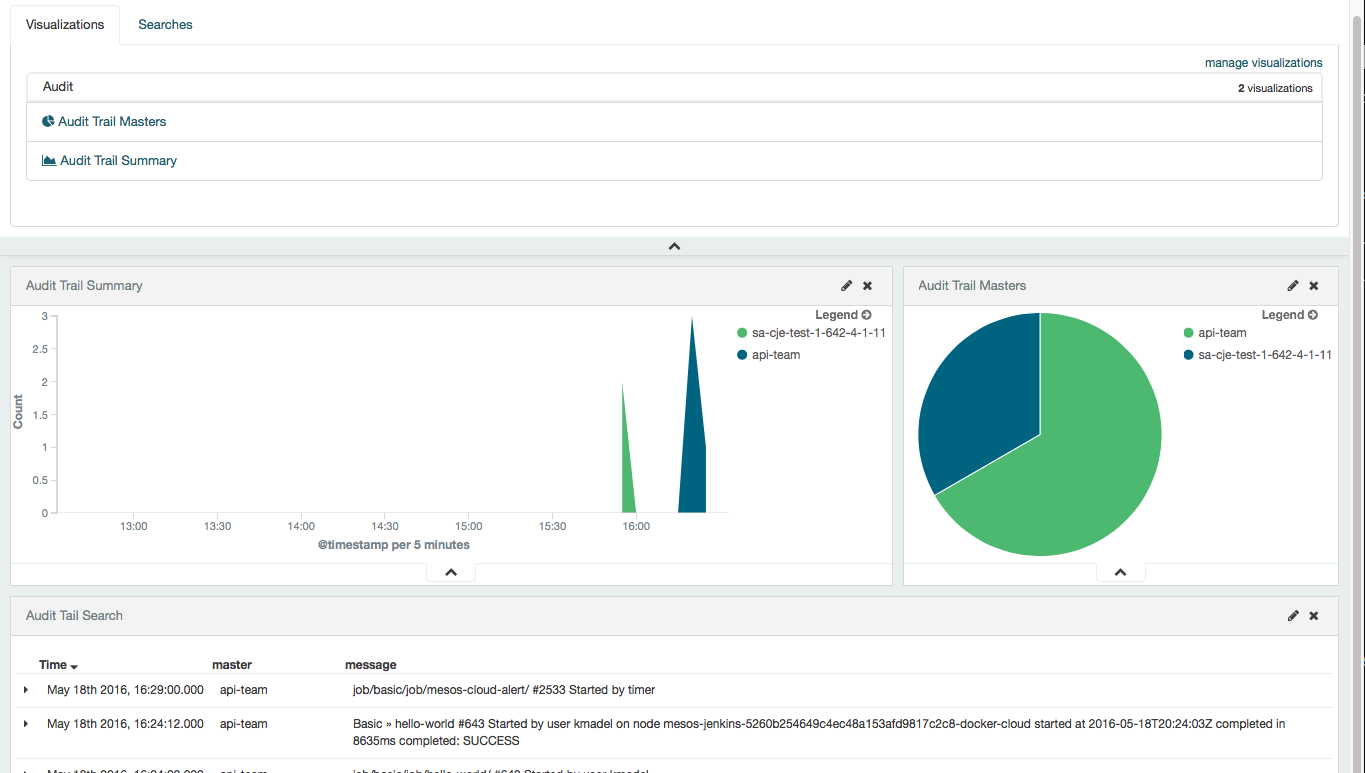
Now click on the Save Dashboard button, name it Audit Trail, check the Store time with dashboard checkbox and click the Save button.

Create a CloudBees Jenkins Analytics Audit Trail View
Now that we have an Audit Trail dashboard saved in Kibana we can add it to CloudBees Jenkins Operations Center as new view. From the root of CloudBees Jenkins Operations Center create a new view named Audit Trail and select Custom Analytics View as the type and click the OK button:
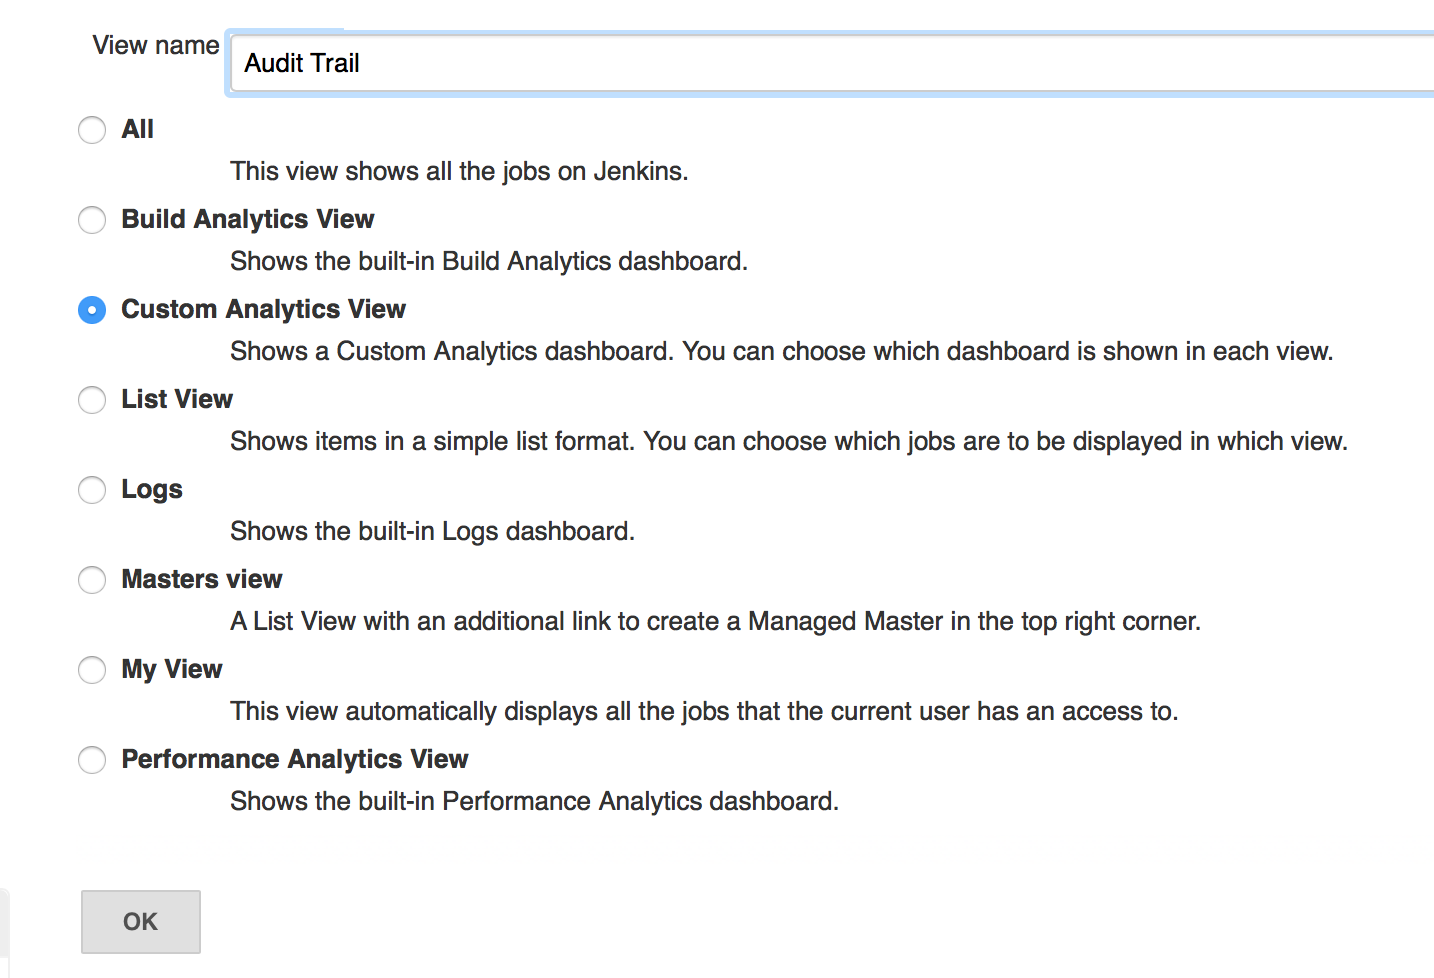
Name the view Audit Trail and then click the Add button to add a dashboard. Enter Audit Trail as the dashboard Name and select the Audit Trail dashboard for the Dashboard selection, and then click the OK button:
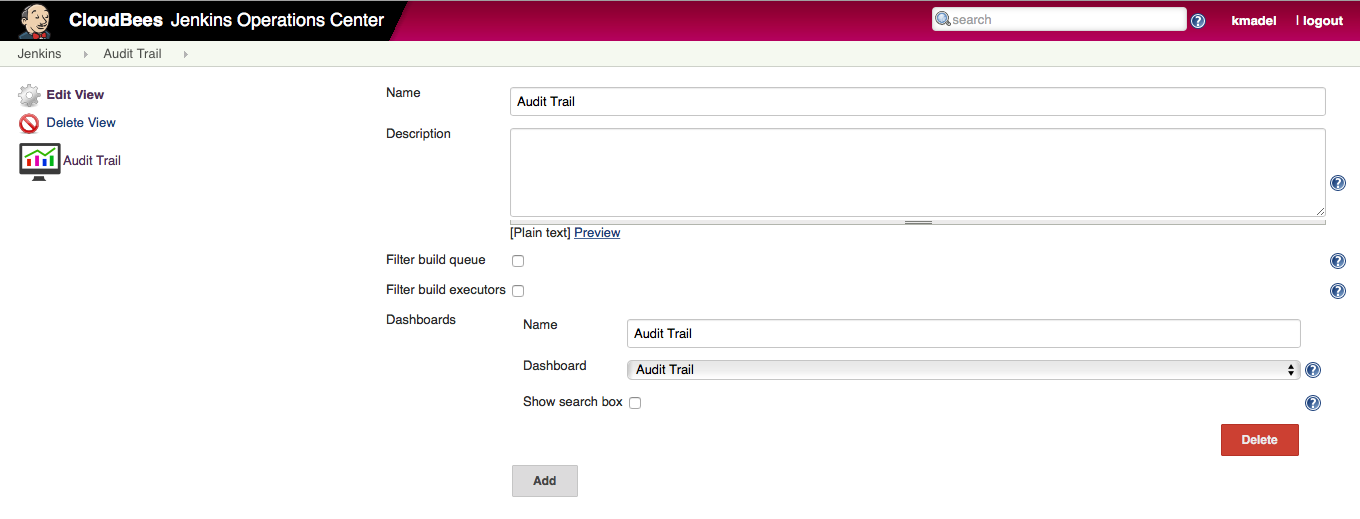
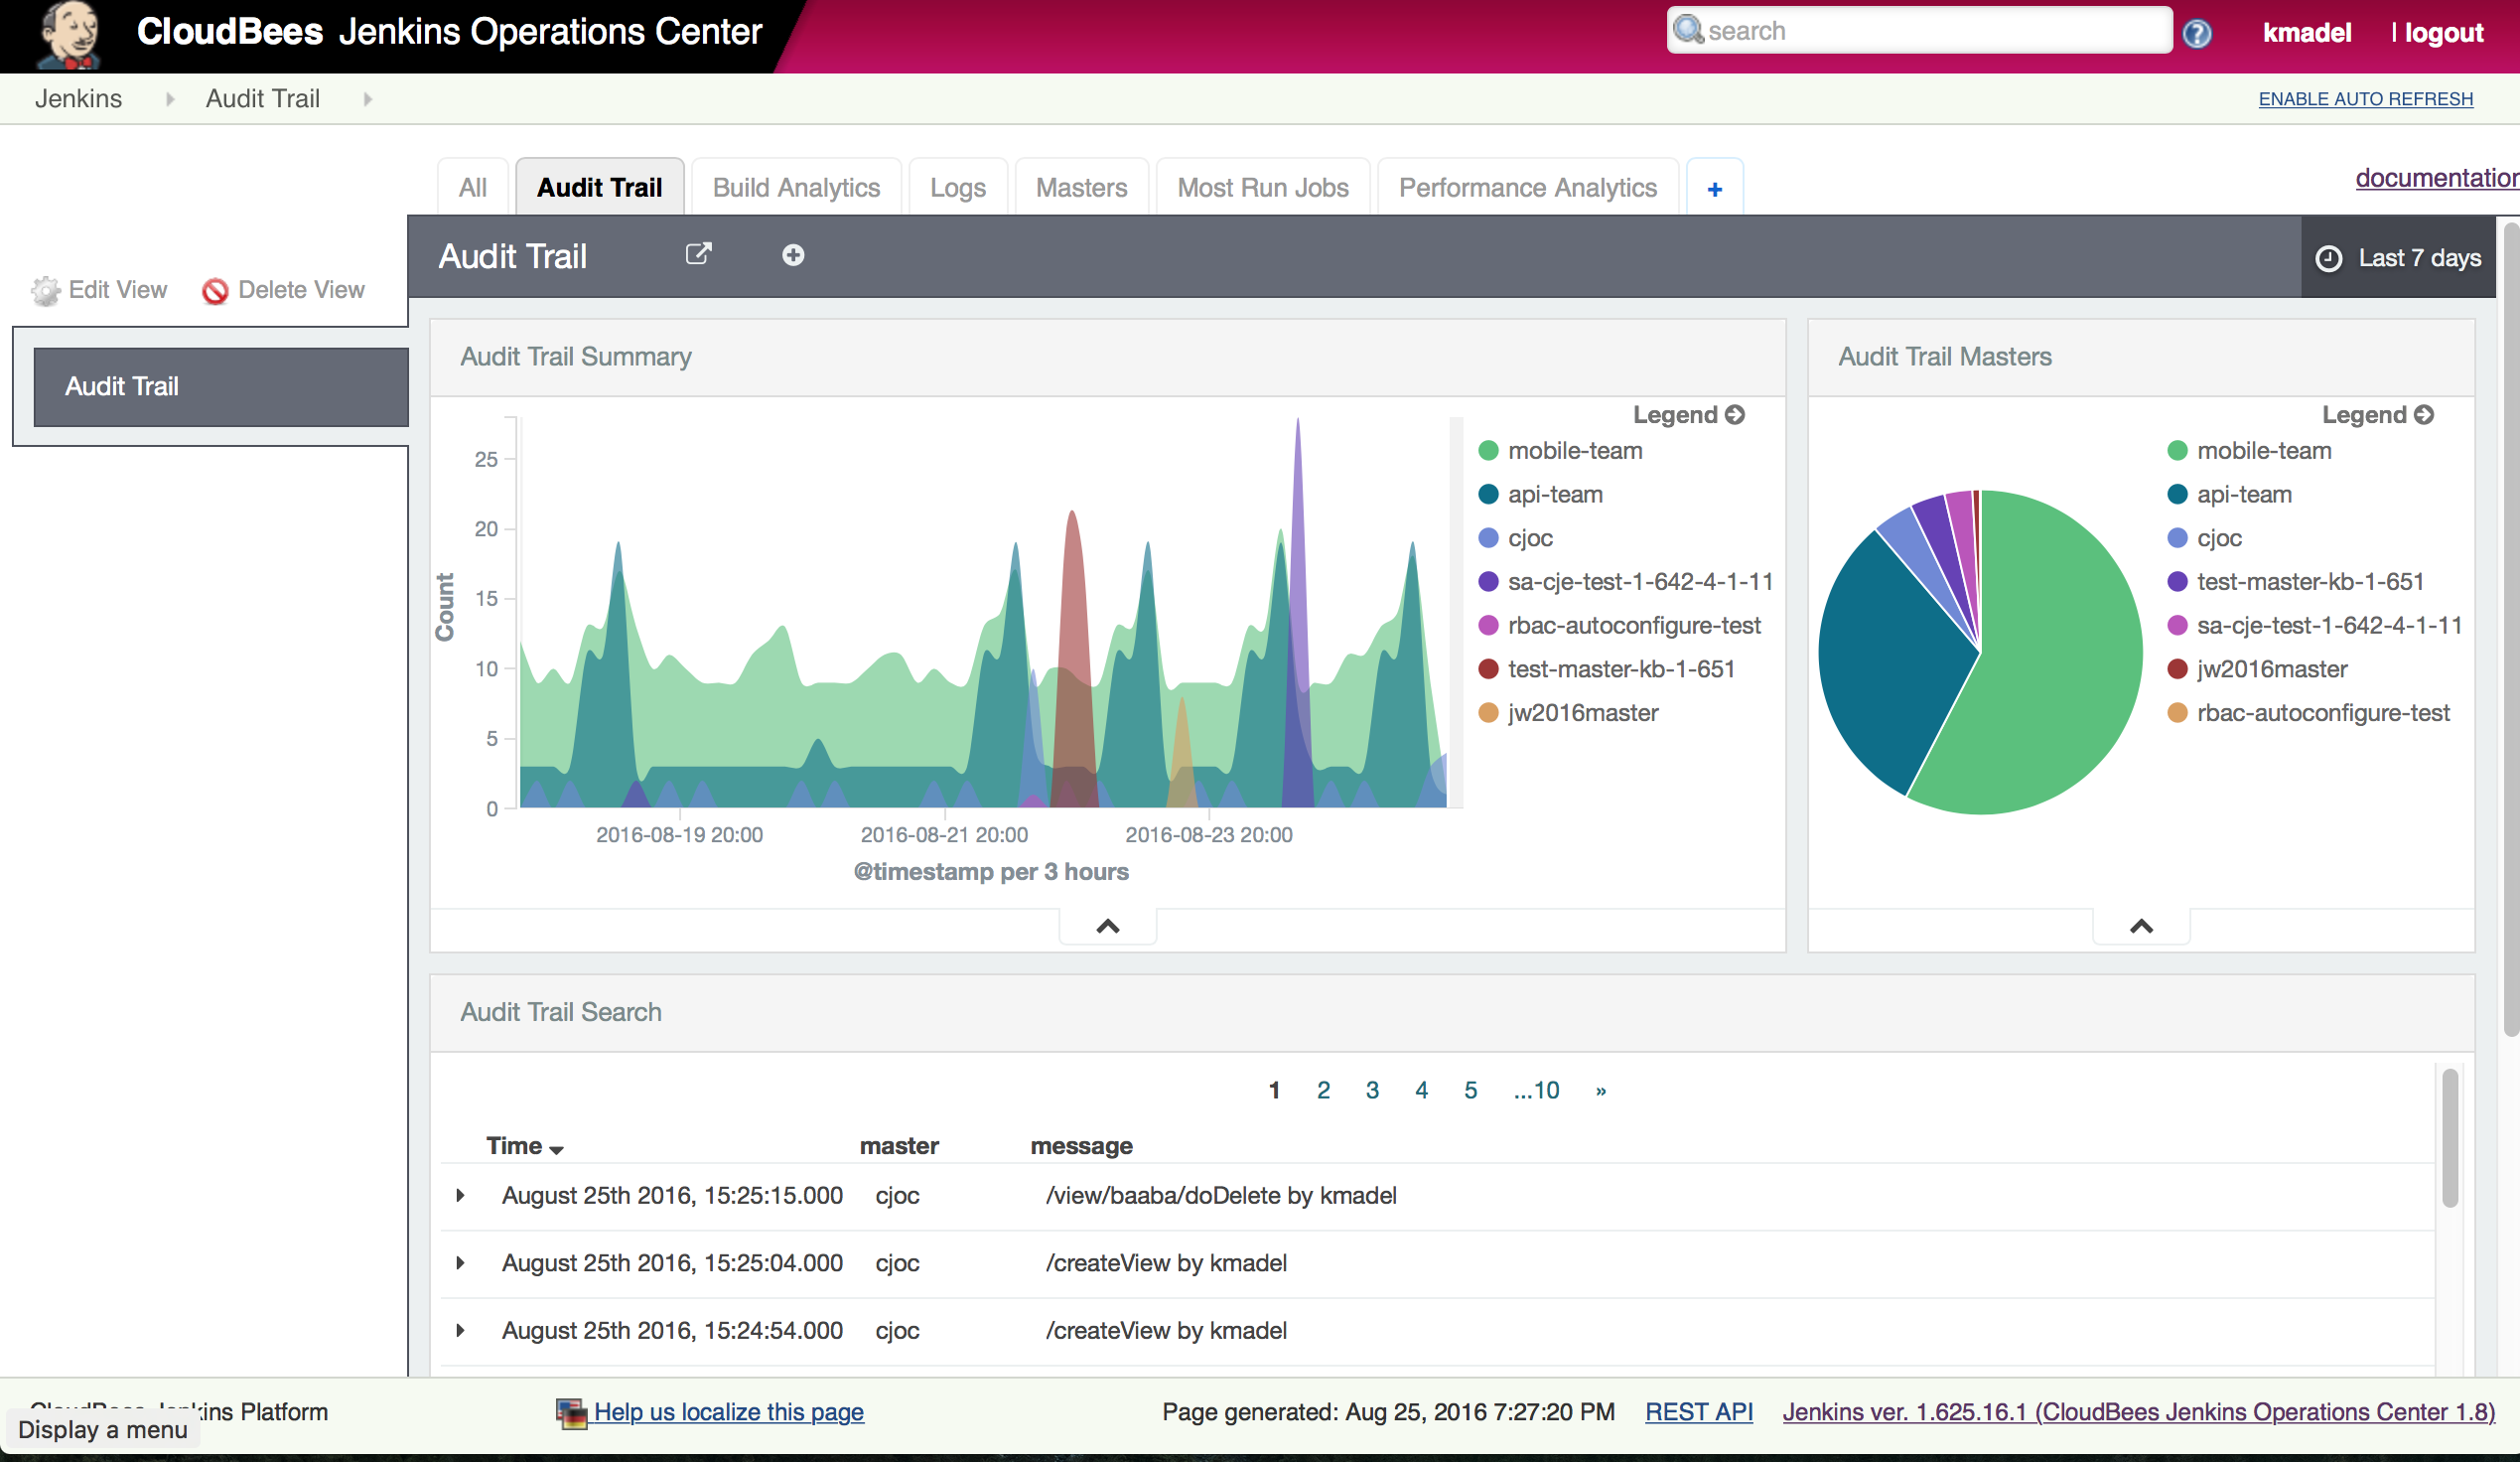
You should now have a new CloudBees Jenkins Analytics Audit Trail view similar to the one pictured below (although you most likely won’t have as much data as is shown here, at least not yet):
Summary
In this post we explored how it is possible to create custom CloudBees Jenkins Analytic Dashboards with a completely new data source - in this case data from the Audit Trail plugin. You can apply these techniques to any data that you push into Elasticsearch and create your own custom CloudBees Jenkins Analytic Dashboards.
Published at DZone with permission of Kurt Madel, DZone MVB. See the original article here.
Opinions expressed by DZone contributors are their own.

Comments