Build a Managed Analytics Platform for an E-Commerce Business on AWS (Part 1)
Learn how to build a complete analytics platform in batch and real-time mode. The real-time analytics pipeline also shows how to detect DDoS and bot attacks.
Join the DZone community and get the full member experience.
Join For FreeWith the increase in popularity of online shopping, building an analytics platform for e-commerce is important for any organization, as it provides insights into the business, trends, and customer behavior. But more importantly, it can uncover hidden insights that can trigger revenue-generating business decisions and actions.
In this blog, we will learn how to build a complete analytics platform in batch and real-time mode. The real-time analytics pipeline also shows how to detect distributed denial of service (DDoS) and bot attacks, which is a common requirement for such use cases.
Introduction
E-commerce analytics is the process of collecting data from all of the sources that affect a certain online business. Data analysts or business analysts can then utilize this information to deduce changes in customer behavior and online shopping patterns. E-commerce analytics spans the whole customer journey, starting from discovery through acquisition, conversion, and eventually retention and support.
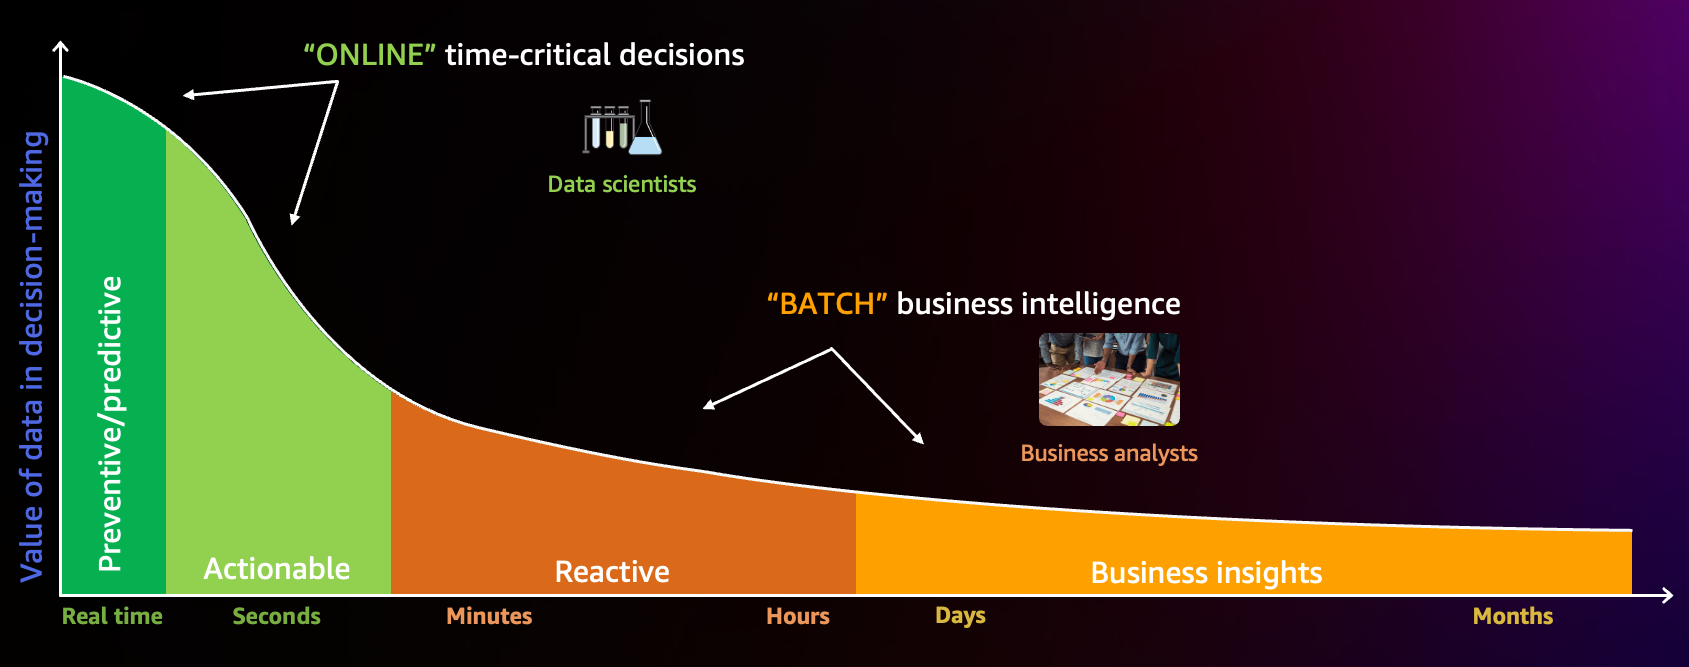
In this two-part blog series, we will build an e-commerce analytical platform that can help to analyze the data in real-time as well as in batch. We will use an e-commerce dataset from Kaggle to simulate the logs of user purchases, product views, cart history, and the user’s journey on the online platform to create two analytical pipelines:
- Batch processing
- Online/real-time processing
You may like to refer to this session presented at AWS re:Invent 2022 for a video walk-through.
Batch Processing
The batch processing will involve data ingestion, lakehouse architecture, processing, and visualization using Amazon Kinesis, AWS Glue, Amazon S3, and Amazon QuickSight to draw insights regarding the following:
- Unique visitors per day
- During a certain time, the users add products to their carts but don’t buy them
- Top categories per hour or weekday (i.e., to promote discounts based on trends)
- To know which brands need more marketing
Online/Real-Time Processing
The real-time processing would involve detecting DDoS and bot attacks using AWS Lambda, Amazon DynamoDB, Amazon CloudWatch, and AWS SNS.
This is the first part of the blog series, where we will focus only on the online/real-time processing data pipeline. In the second part of the blog series, we will dive into batch processing.
Dataset
For this blog, we are going to use the e-commerce behavior data from a multi-category store.
This file contains the behavior data for 7 months (from October 2019 to April 2020) from a large multi-category online store, where each row in the file represents an event. All events are related to products and users. Each event is like a many-to-many relationship between products and users.
Architecture
Real-Time Processing
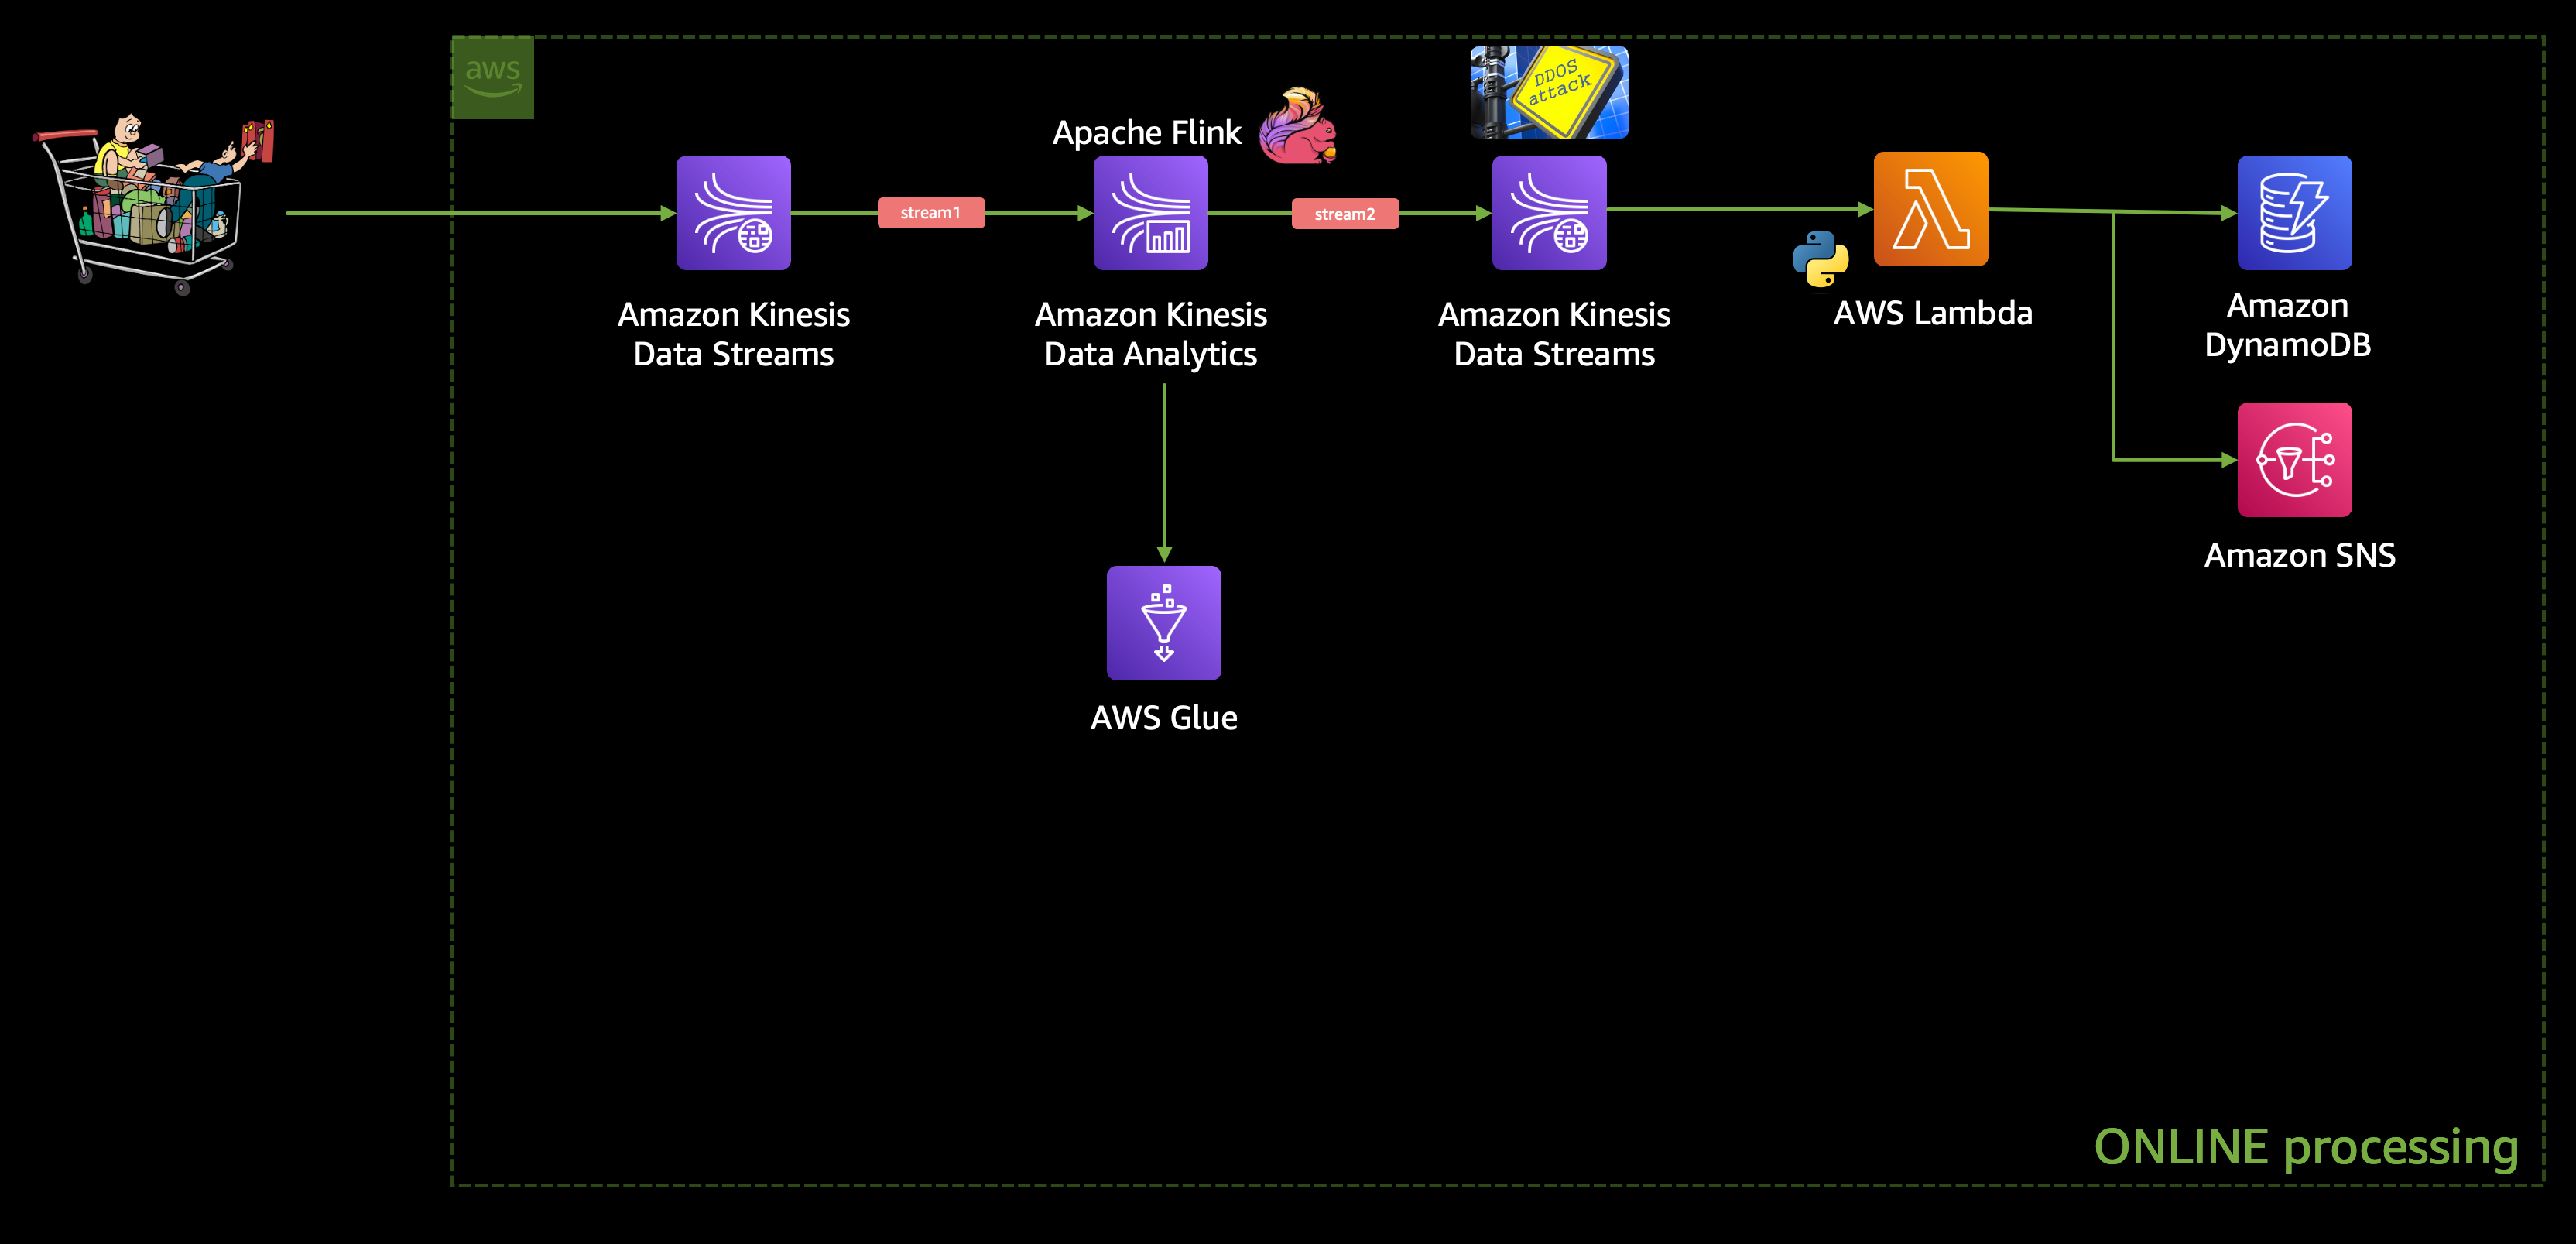
We are going to build an end-to-end data engineering pipeline where we will start with this e-commerce behavior data from a multi-category store dataset as an input, which we will use to simulate a real-time e-commerce workload.
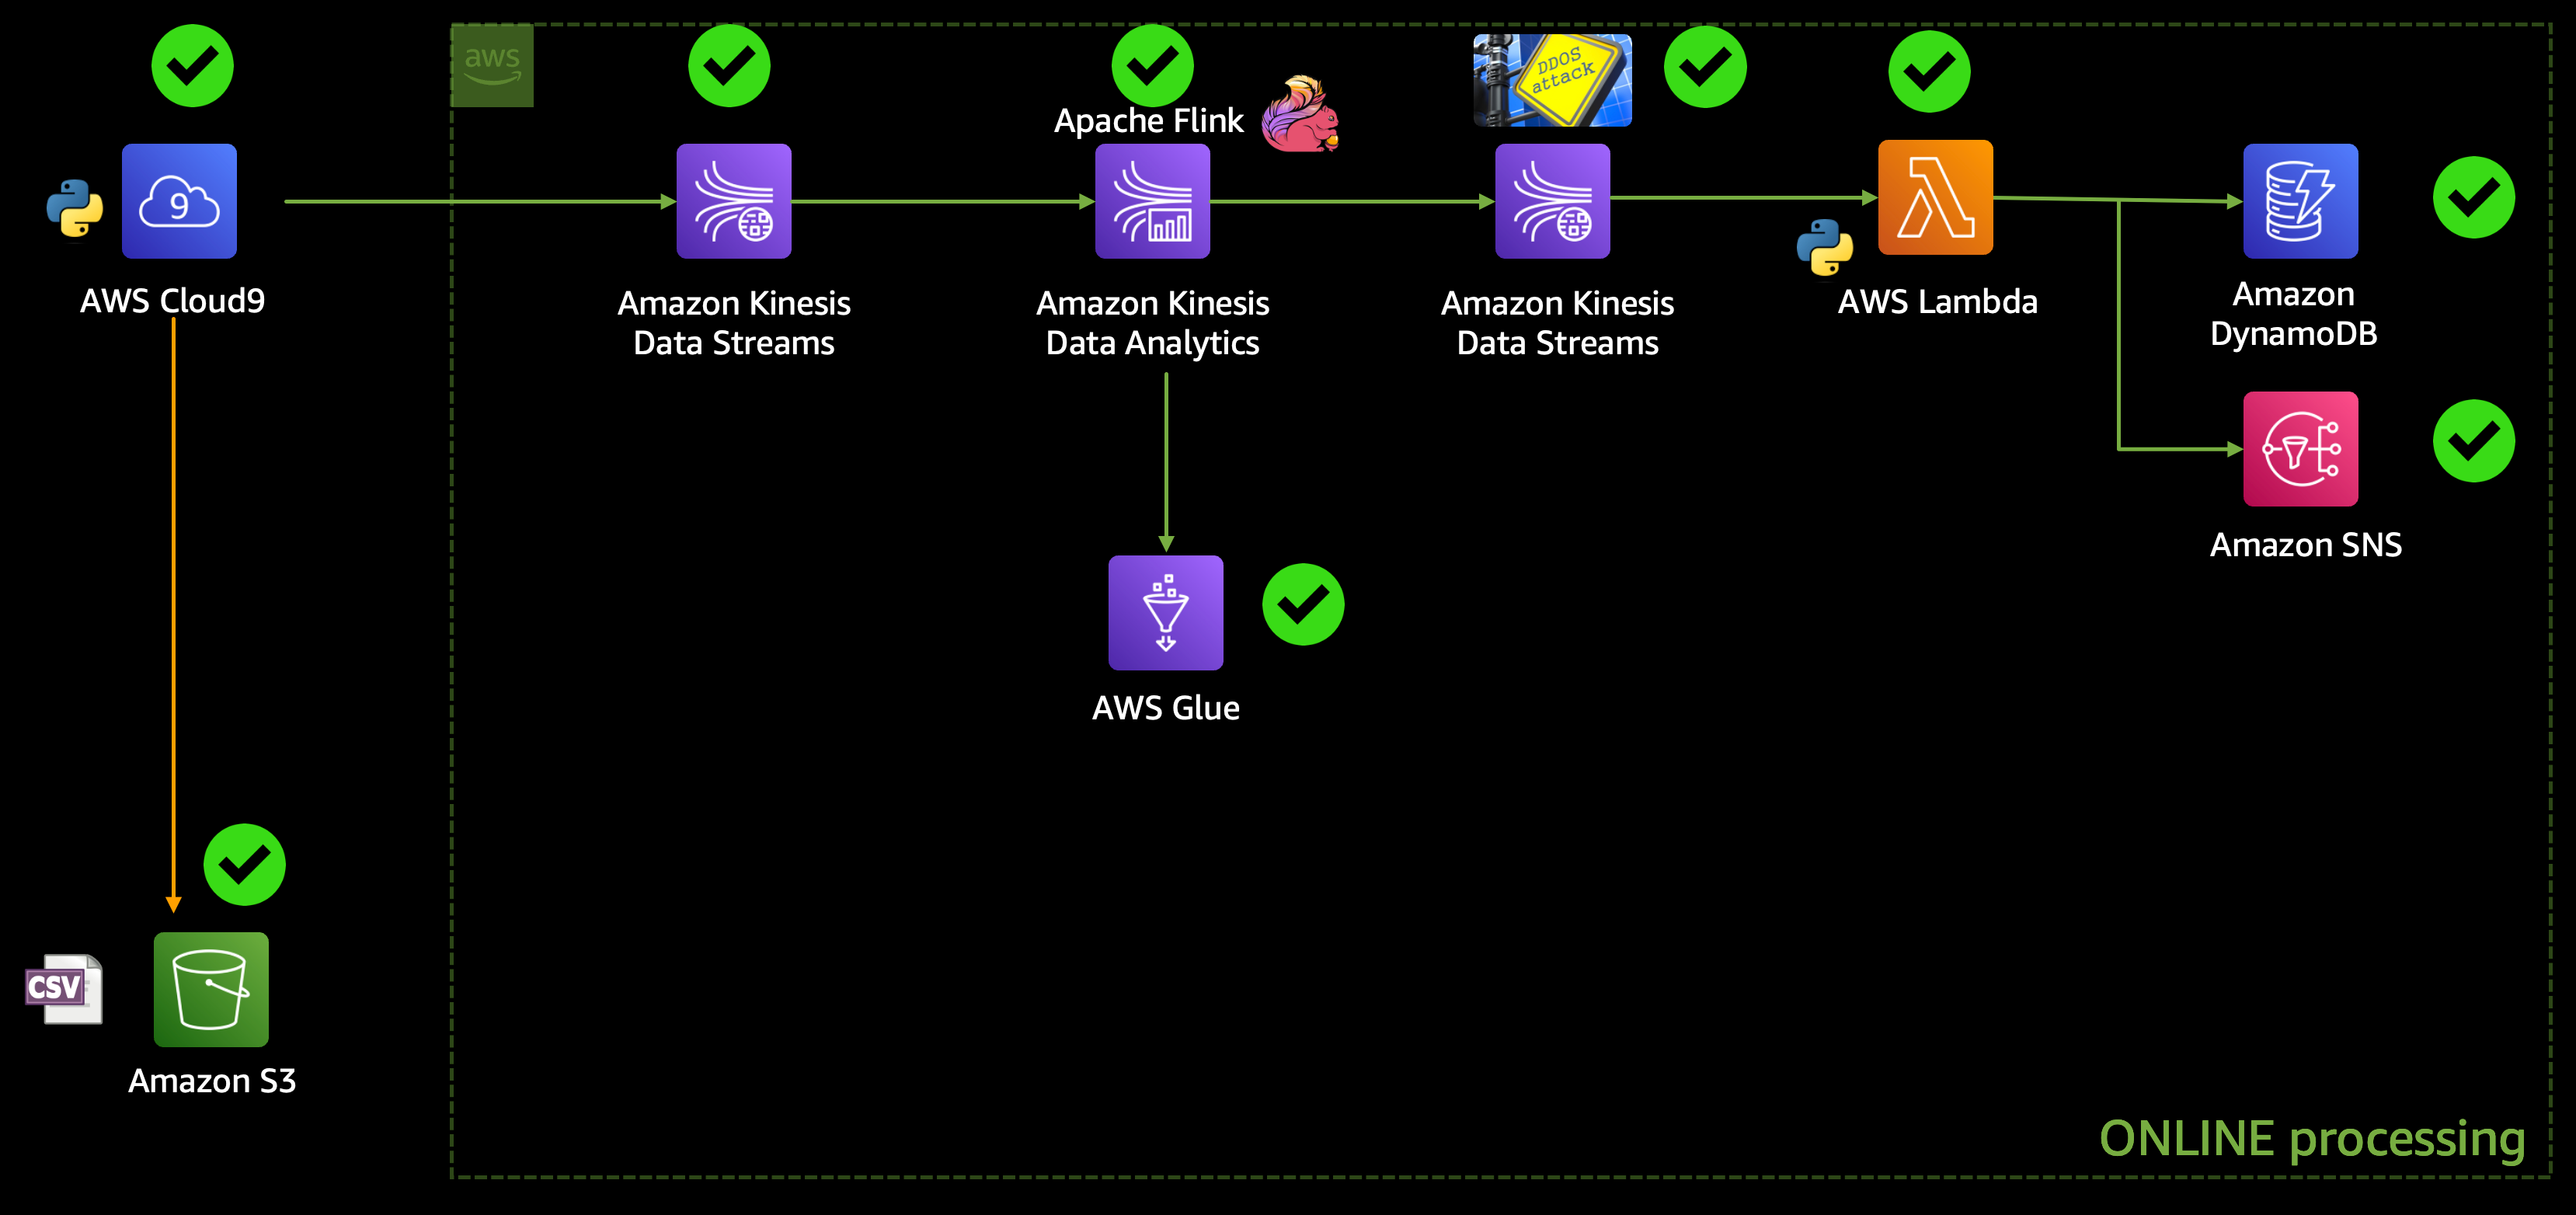
This input raw stream of data will go into an Amazon Kinesis Data Stream (stream1), which will stream the data to Amazon Kinesis Data Analytics for analysis, where we will use an Apache Flink application to detect any DDoS attack, and the filtered data will be sent to another Amazon Kinesis Data Stream (stream2).
We are going to use SQL to build the Apache Flink application using Amazon Kinesis Data Analytics and, hence, we would need a metadata store, for which we are going to use AWS Glue Data Catalog.
And then this stream2 will trigger an AWS Lambda function which will send an Amazon SNS notification to the stakeholders and shall store the fraudulent transaction details in a DynamoDB table. The architecture would look like this:
Batch Processing
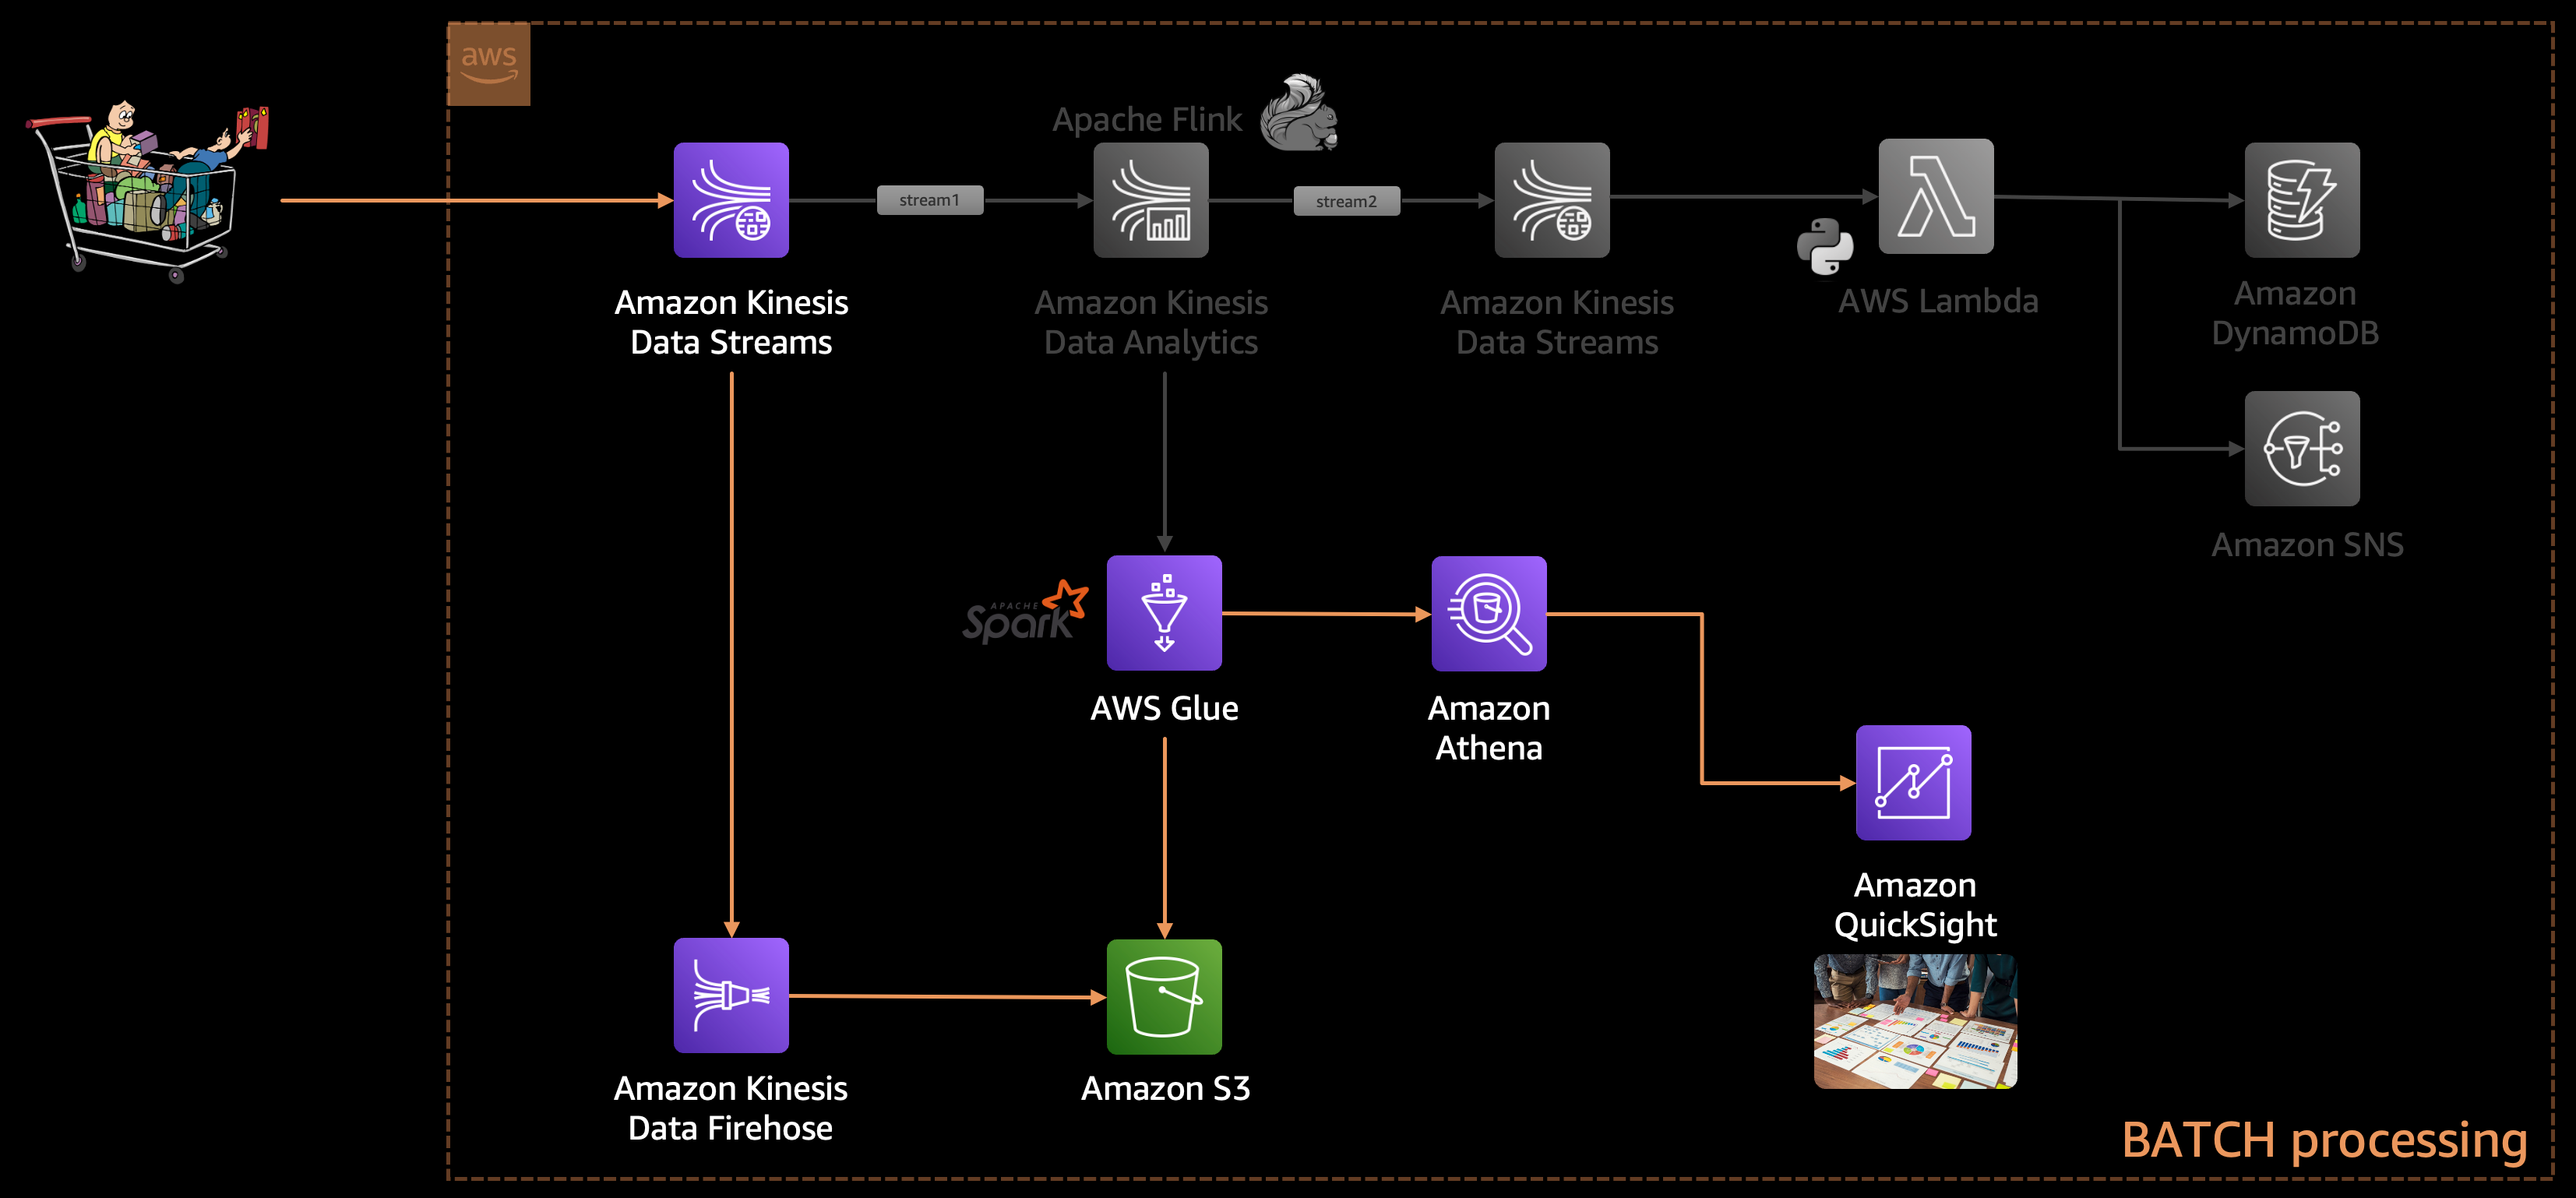
If we look into the architecture diagram above, we will see that we are not storing the raw incoming data anywhere. As the data enters through Kinesis Data Stream (stream1) we are passing it to Kinesis Data Analytics to analyze. And later on, we might discover some bug in our Apache Flink application, and at that point, we will fix the bug and resume processing the data, but we cannot process the old data (which was processed by our buggy Apache Flink application). This is because we have not stored the raw data anywhere, which can allow us to re-process it later.
That's why it's recommended to always have a copy of the raw data stored in some storage (e.g., on Amazon S3) so that we can revisit the data if needed for reprocessing and/or batch processing.
This is exactly what we are going to do. We will use the same incoming data stream from Amazon Kinesis Data Stream (stream1) and pass it on to Kinesis Firehose which can write the data on S3. Then we will use Glue to catalog that data and perform an ETL job using Glue ETL to process/clean that data so that we can further use the data for running some analytical queries using Athena.
At last, we would leverage QuickSight to build a dashboard for visualization.
Step-By-Step Walkthrough
Let's build this application step-by-step. I'm going to use an AWS Cloud9 instance for this project, but it is not mandatory. If you wish to spin up an AWS Cloud9 instance, you may like to follow the steps mentioned here and proceed further.
Download the Dataset and Clone the GitHub Repo
Clone the project and change it to the right directory:
# Clone the project repository
git clone https://github.com/debnsuma/build-a-managed-analytics-platform-for-e-commerce-business.git
cd build-a-managed-analytics-platform-for-e-commerce-business/

# Create a folder to store the dataset
mkdir dataset
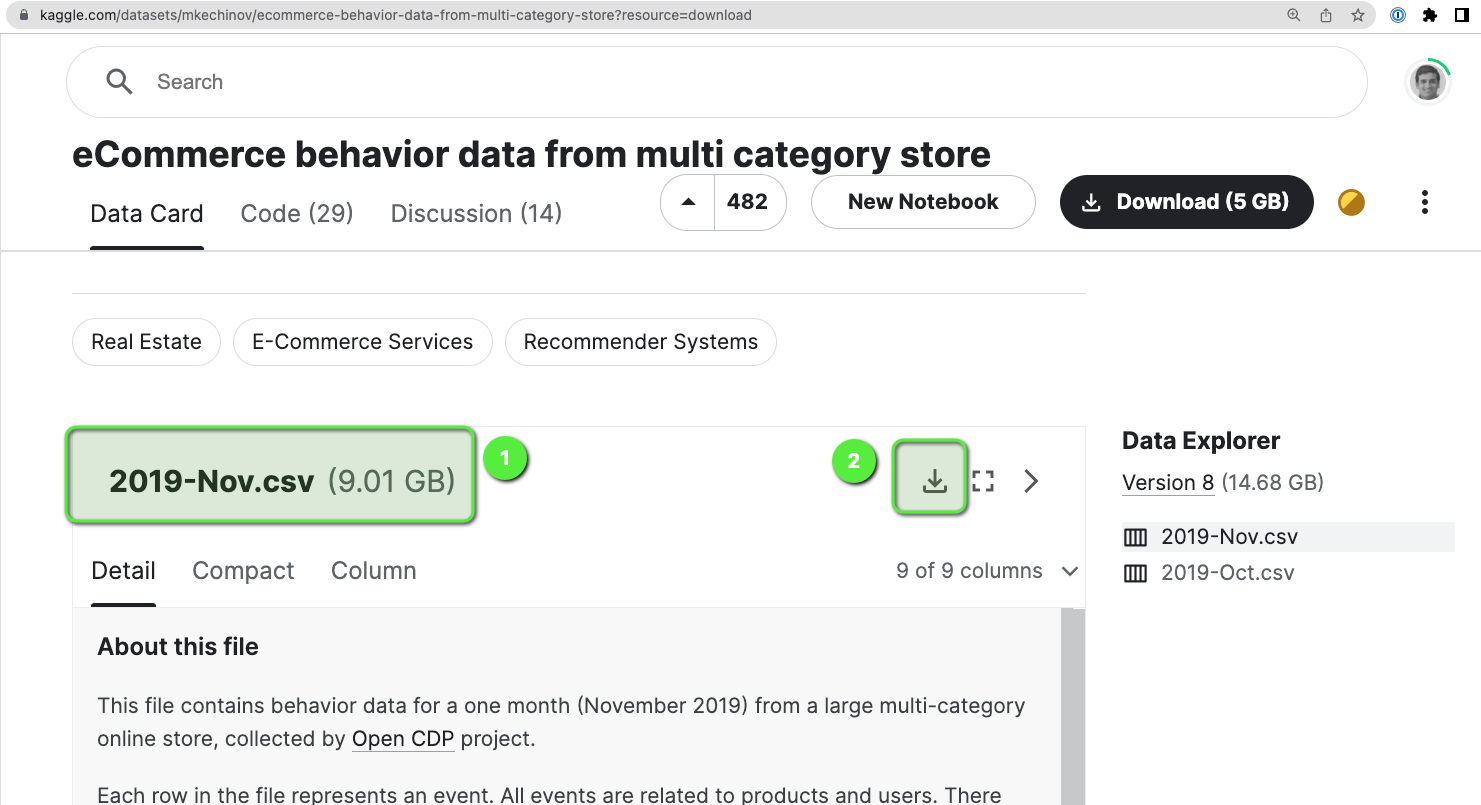
Download the dataset from here and move the downloaded file (2019-Nov.csv.zip) under the dataset folder:
Now, let's unzip the file and create a sample version of the dataset by just taking the first 1000 records from the file.
cd dataset

unzip 2019-Nov.csv.zip

cat 2019-Nov.csv | head -n 1000 > 202019-Nov-sample.csv
Create an Amazon S3 Bucket
Now we can create an S3 bucket and upload this dataset:
- Name of the Bucket:
e-commerce-raw-us-east-1-dev(replace<BUCKET_NAME>with your own bucket name)
# Copy all the files in the S3 bucket
aws s3 cp 2019-Nov.csv.zip s3://<BUCKET_NAME>/ecomm_user_activity/p_year=2019/p_month=11/
aws s3 cp 202019-Nov-sample.csv s3://<BUCKET_NAME>/ecomm_user_activity_sample/202019-Nov-sample.csv
aws s3 cp 2019-Nov.csv s3://<BUCKET_NAME>/ecomm_user_activity_unconcompressed/p_year=2019/p_month=11/
Create the Kinesis Data Stream
Now, let's create the first Kinesis data stream (stream1 in our architecture diagram) which we will be using as the incoming stream. Open the AWS Console and then:
- Go to Amazon Kinesis.
- Click on Create data stream.
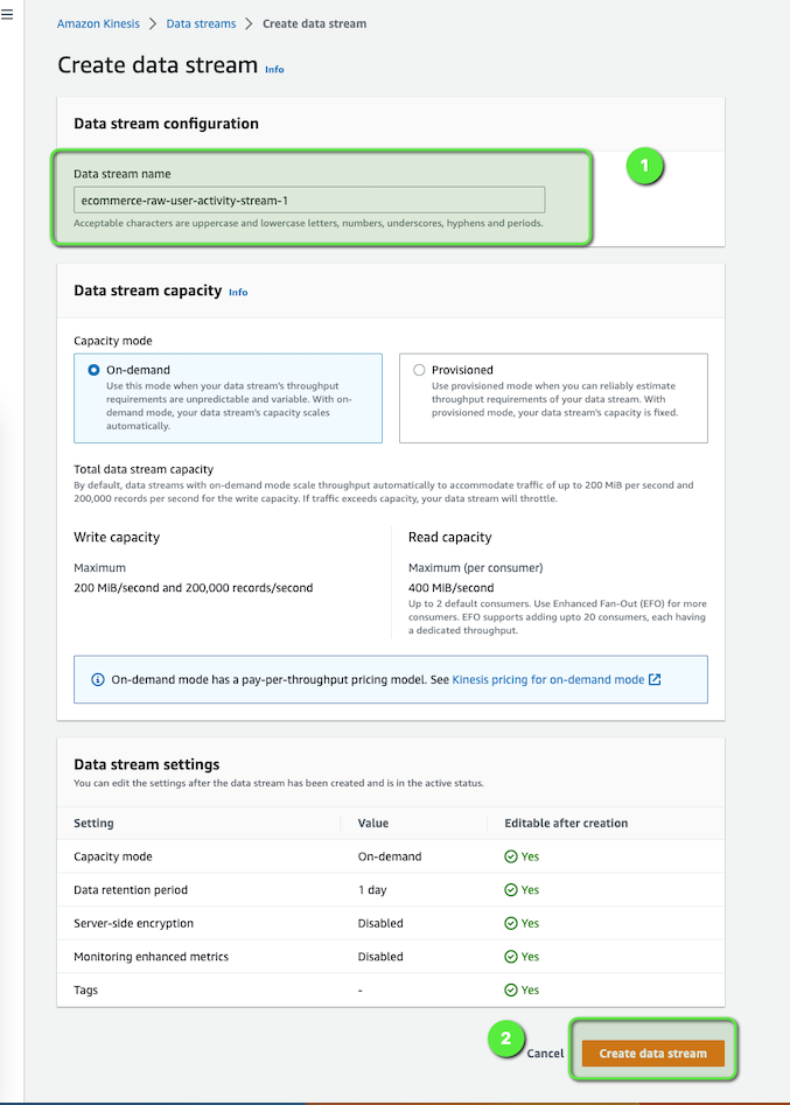
Let's create another Kinesis data stream which we are going to use later on (stream2 in the architecture diagram). This time use the data stream name as e-commerce-raw-user-activity-stream-2.

Start the E-Commerce Traffic
We can now start the e-commerce traffic, as our Kinesis data stream is ready. This simulator which we are going to use is a simple python script which will read the data from a CSV file (202019-Nov-sample.csv, the dataset which we downloaded earlier) line by line and send it to the Kinesis data stream (stream1).
But before you run the simulator, just edit the stream-data-app-simulation.py script with your <BUCKET_NAME> where you have the dataset.
# S3 buckect details (UPDATE THIS)
BUCKET_NAME = "e-commerce-raw-us-east-1-dev"
Once it's updated, we can run the simulator.
# Go back to the project root directory
cd ..
# Run simulator
pip install boto3
python code/ecomm-simulation-app/stream-data-app-simulation.py

HttpStatusCode: 200 ,  electronics.smartphone
HttpStatusCode: 200 ,  appliances.sewing_machine
HttpStatusCode: 200 ,
HttpStatusCode: 200 ,  appliances.kitchen.washer
HttpStatusCode: 200 ,  electronics.smartphone
HttpStatusCode: 200 ,  computers.notebook
HttpStatusCode: 200 ,  computers.notebook
HttpStatusCode: 200 ,
HttpStatusCode: 200 ,
HttpStatusCode: 200 ,  electronics.smartphone
Integration with Kinesis Data Analytics and Apache Flink
Now, we will create an Amazon Kinesis Data Analytics Streaming Application which will analyze this incoming stream for any DDoS or bot attack. Open the AWS Console and then:
- Go to Amazon Kinesis.
- Select Analytics applications.
- Click on Studio notebooks.
- Click on Create Studio notebook.

- Use
ecomm-streaming-app-v1as the Studio notebook name. - Under the Permissions section, click on Create to create an AWS Glue database, name the database as
my-db-ecomm. - Use the same database,
my-db-ecommfrom the dropdown. - Click on Create Studio notebook.
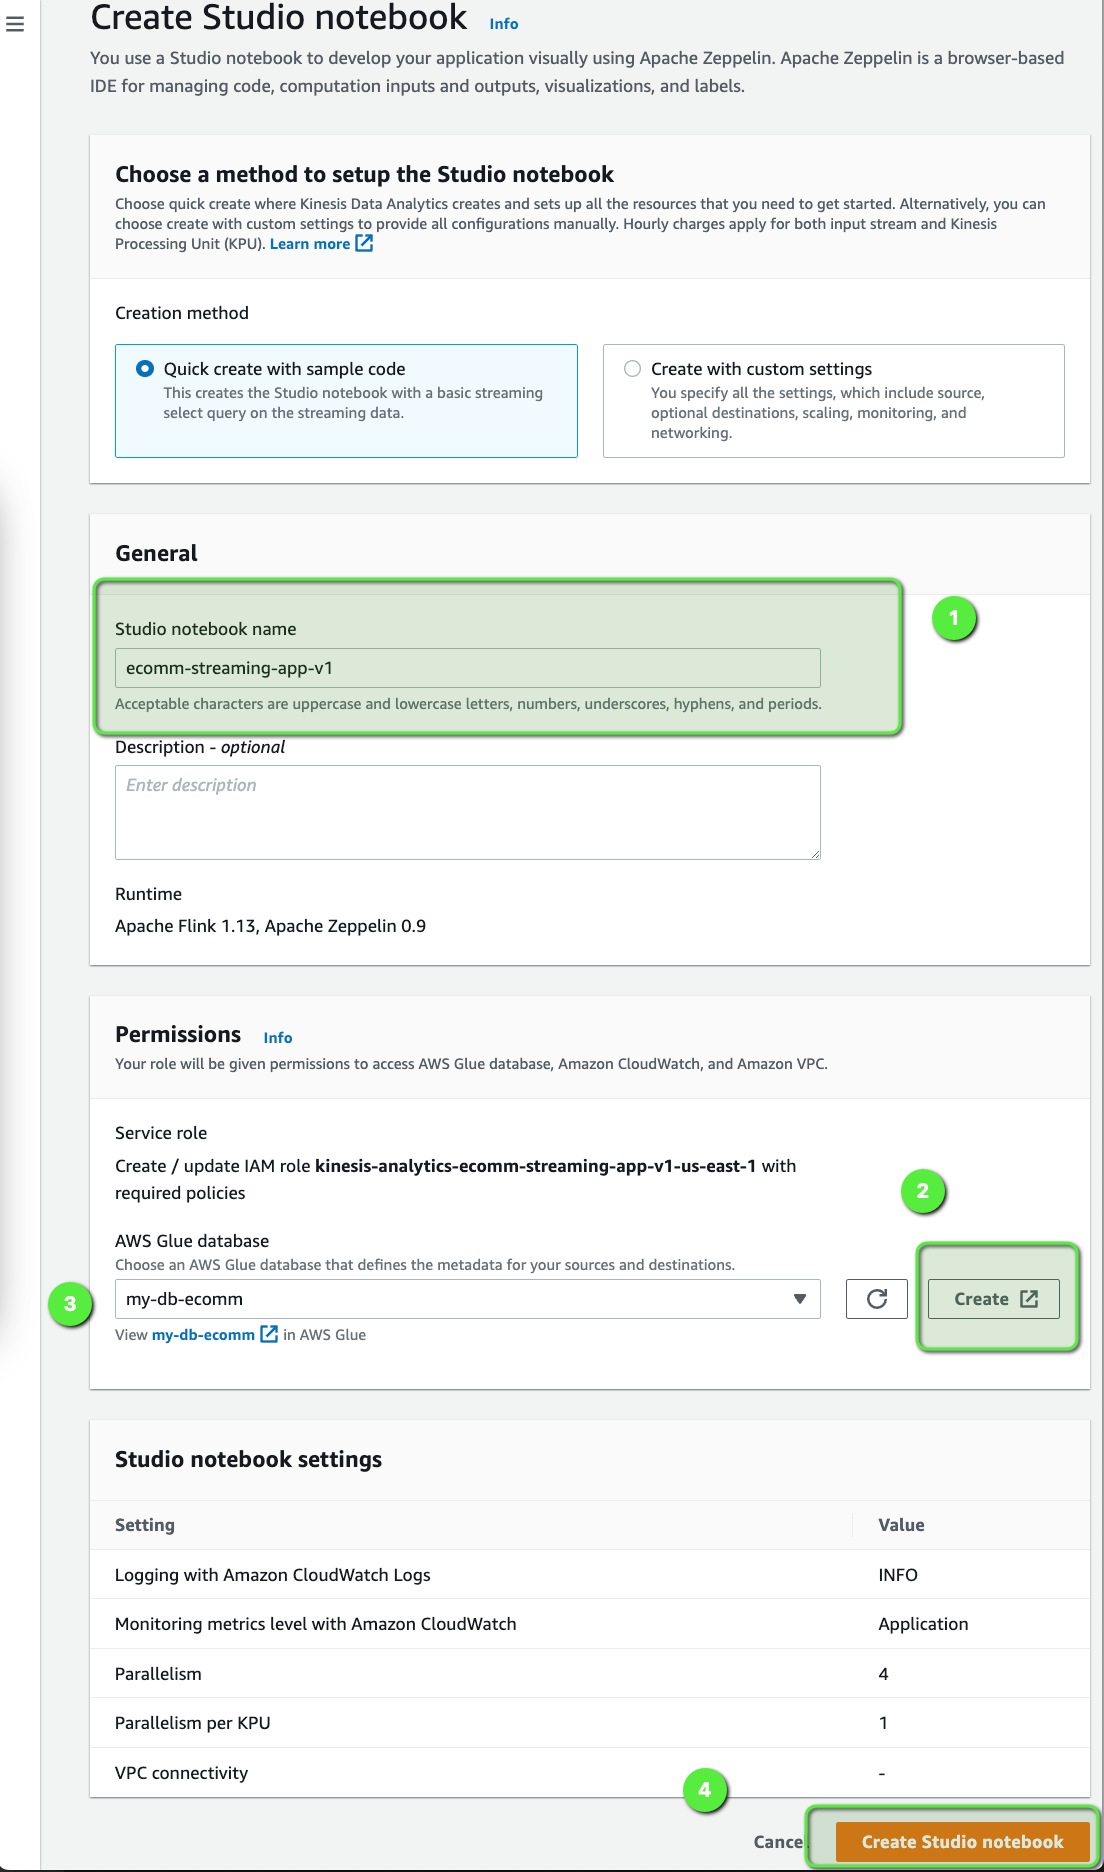
Now, select the ecomm-streaming-app-v1 Studio notebook and click on Open in Apache Zeppelin:

Once the Zeppelin Dashboard comes up, click on Import note and import this notebook: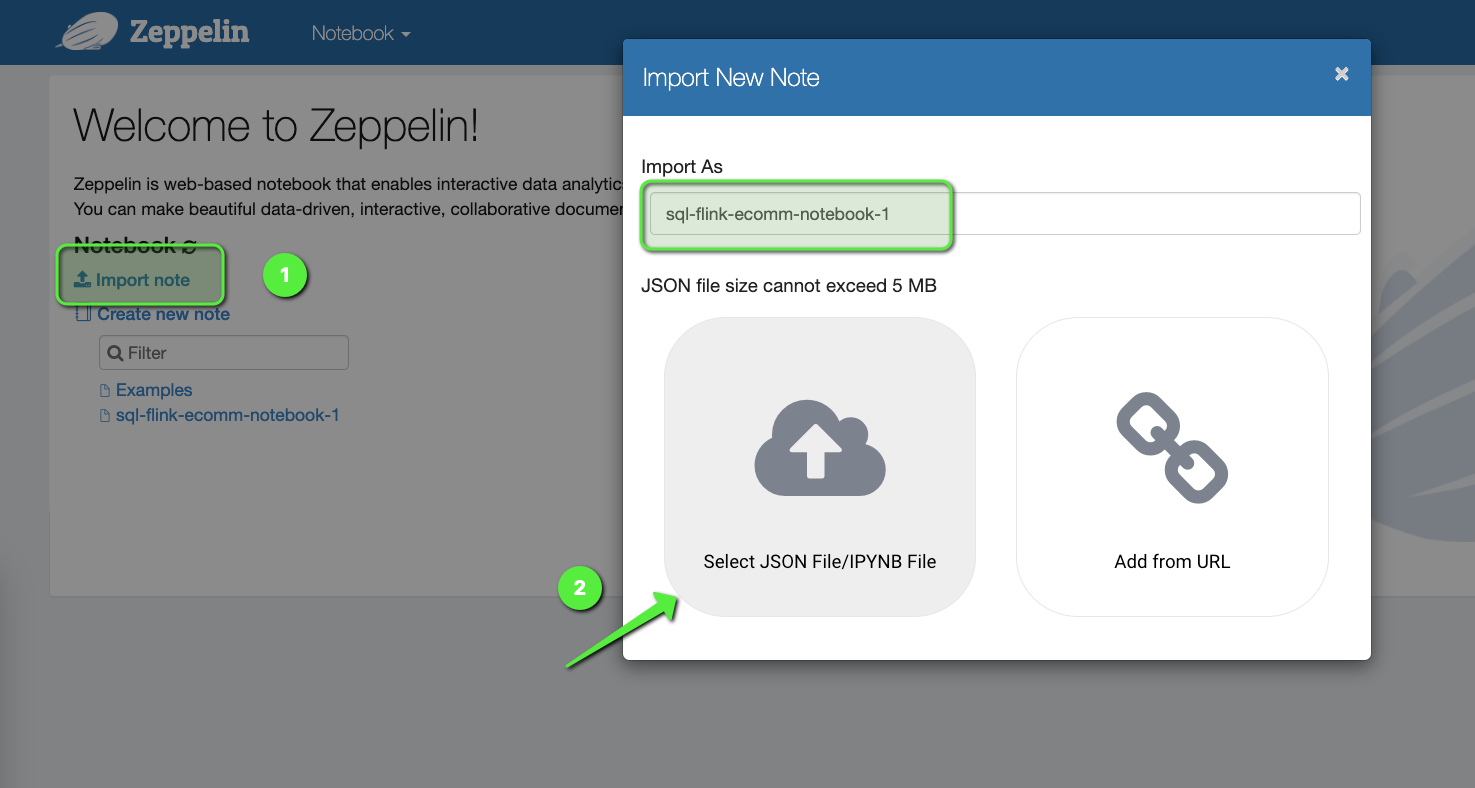
Open the sql-flink-ecomm-notebook-1 notebook. Flink interpreters supported by Apache Zeppelin notebook are Python, IPython, stream SQL, or batch SQL, and we are going to use SQL to write our code. There are many different ways to create a Flink Application but one of the easiest ways is to use Zeppelin notebook. Let's look at this notebook and briefly discuss what are we doing here:
- First, we are creating a
tablefor the incoming source of data (which is thee-commerce-raw-user-activity-stream-1incoming stream). - Next, we are creating another
tablefor the filtered data (which is for thee-commerce-raw-user-activity-stream-2outgoing stream). - And finally, we are putting the logic to simulate the DDoS attack. We are essentially looking into the last 10 seconds of the data and grouping them by
user_id. If we notice more than 5 records within that 10 seconds, Flink will take thatuser_idand the no. of records within those 10 seconds and will push that data to thee-commerce-raw-user-activity-stream-2outgoing stream.
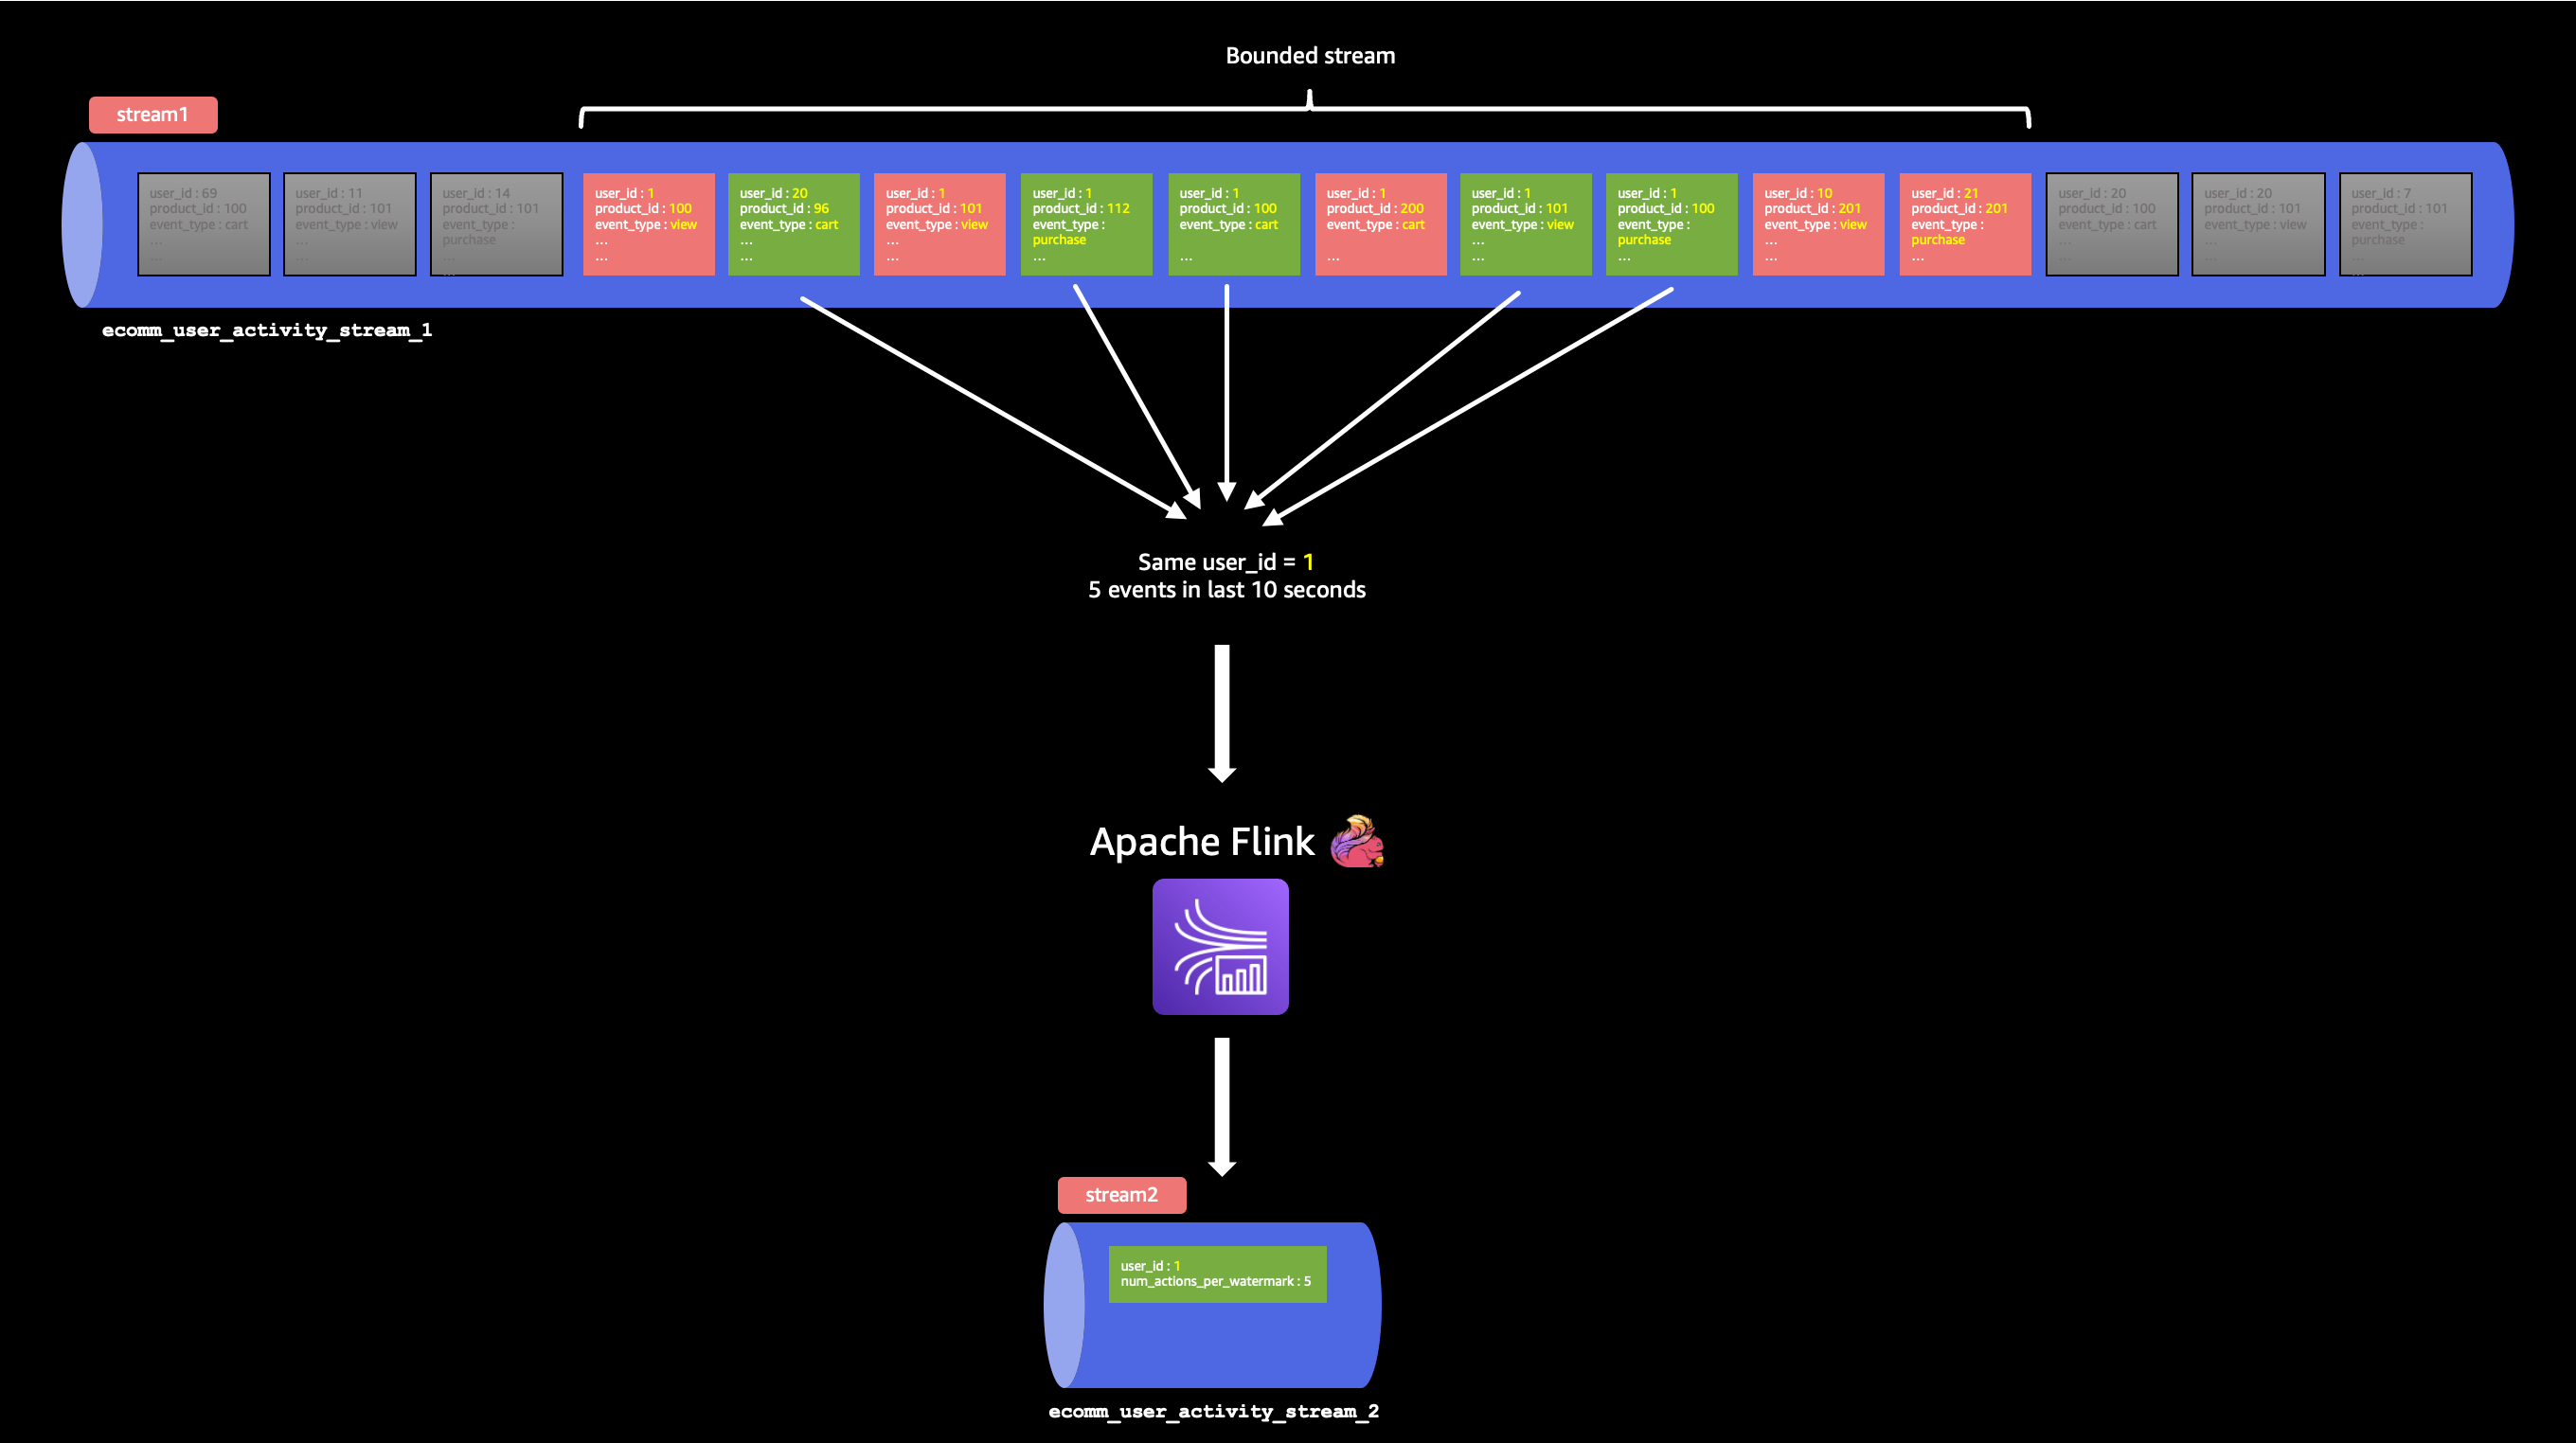
5 products in the last 10 seconds, by user_id 1
%flink.ssql
/*Option 'IF NOT EXISTS' can be used, to protect the existing Schema */
DROP TABLE IF EXISTS ecomm_user_activity_stream_1;
CREATE TABLE ecomm_user_activity_stream_1 (
`event_time` VARCHAR(30),
`event_type` VARCHAR(30),
`product_id` BIGINT,
`category_id` BIGINT,
`category_code` VARCHAR(30),
`brand` VARCHAR(30),
`price` DOUBLE,
`user_id` BIGINT,
`user_session` VARCHAR(30),
`txn_timestamp` TIMESTAMP(3),
  WATERMARK FOR txn_timestamp as txn_timestamp - INTERVAL '10' SECOND
)
PARTITIONED BY (category_id)
WITH (
'connector' = 'kinesis',
'stream' = 'e-commerce-raw-user-activity-stream-1',
'aws.region' = 'us-east-1',
'scan.stream.initpos' = 'LATEST',
'format' = 'json',
'json.timestamp-format.standard' = 'ISO-8601'
);
/*Option 'IF NOT EXISTS' can be used, to protect the existing Schema */
DROP TABLE IF EXISTS ecomm_user_activity_stream_2;
CREATE TABLE ecomm_user_activity_stream_2 (
`user_id` BIGINT,
`num_actions_per_watermark` BIGINT
)
WITH (
'connector' = 'kinesis',
'stream' = 'e-commerce-raw-user-activity-stream-2',
'aws.region' = 'us-east-1',
'format' = 'json',
'json.timestamp-format.standard' = 'ISO-8601'
);
/* Inserting aggregation into Stream 2*/
insert into ecomm_user_activity_stream_2select  user_id, count(1) as num_actions_per_watermarkfrom ecomm_user_activity_stream_1group by tumble(txn_timestamp, INTERVAL '10' SECOND), user_idhaving count(1) > 5;
Create the Apache Flink Application
Now that we have our notebook imported, we can create the Flink Application from the notebook directly. To do that:
- Click on Actions for ecomm-streaming-app-v1 in the top right corner.

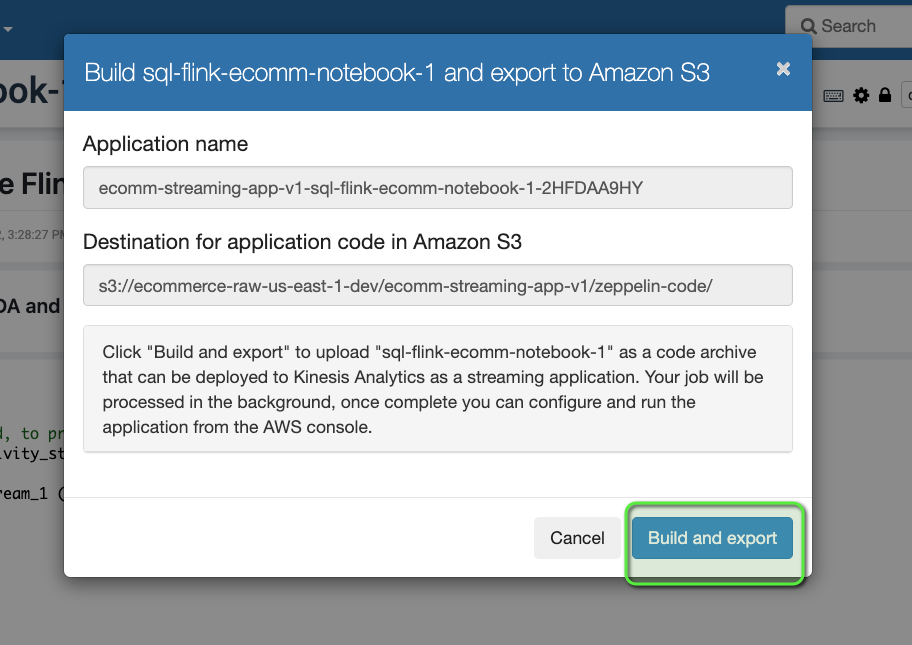
- Click on Build sql-flink-ecomm-notebook-1 > Build and export. It will compile all the codes, will create a ZIP file, and would store the file on S3.
- Now we can deploy that application by simply clicking on Actions for ecomm-streaming-app-v1 on the top right corner.
- Click on Deploy sql-flink-ecomm-notebook-1 as Kinesis Analytics application > Deploy using AWS Console.
- Scroll down and click on Save changes.
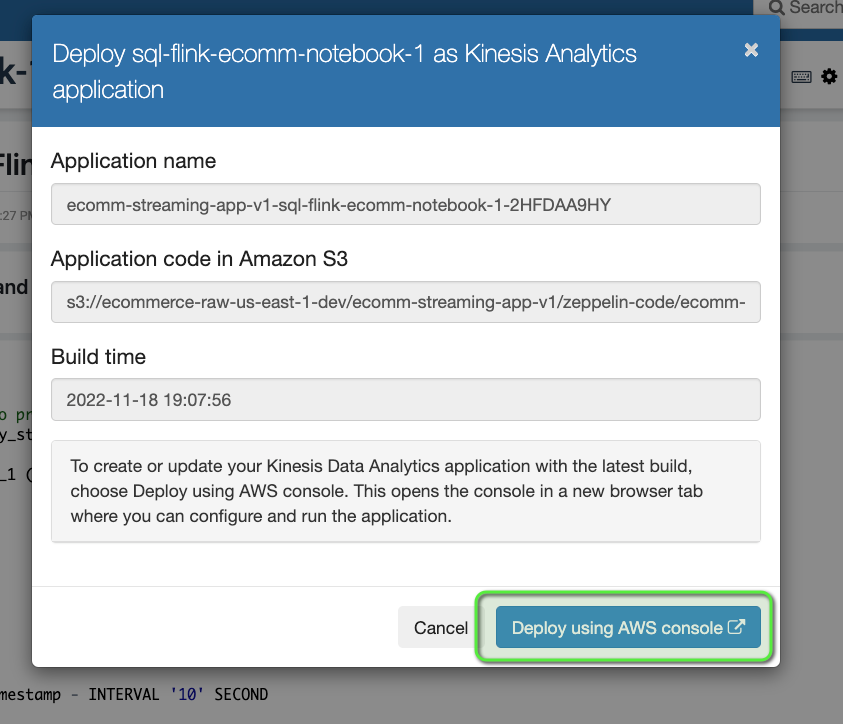
This is the power of Kinesis Data Analytics: just from a simple Zeppelin Notebook, we can create a real-world application without any hindrance.
- Finally, we can start the application by clicking on Run. It might take a couple of minutes to start the application, so let's wait until we see the Status as
Running.

Alarming DDoS Attack
If we revisit our architecture, we will see that we are almost done with the real-time/online processing. The only thing which is pending is to create a Lambda function which will be triggered whenever there is an entry of a record inside the e-commerce-raw-user-activity-stream-2 stream. The Lambda function would perform the following:
- Write that record into a DynamoDB table.
- Send an SNS notification.
- Update the CloudWatch metrics.

Let's first build the code for the Lambda function. The code is available under code/serverless-app folder.
# Install the aws_kinesis_agg package
cd code/serverless-app/
pip install aws_kinesis_agg -t .

# Build the lambda package and download the zip file.
zip -r ../lambda-package.zip .

# Upload the zip to S3
cd ..
aws s3 cp lambda-package.zip s3://e-commerce-raw-us-east-1-dev/src/lambda/
Now, let's create the Lambda function.
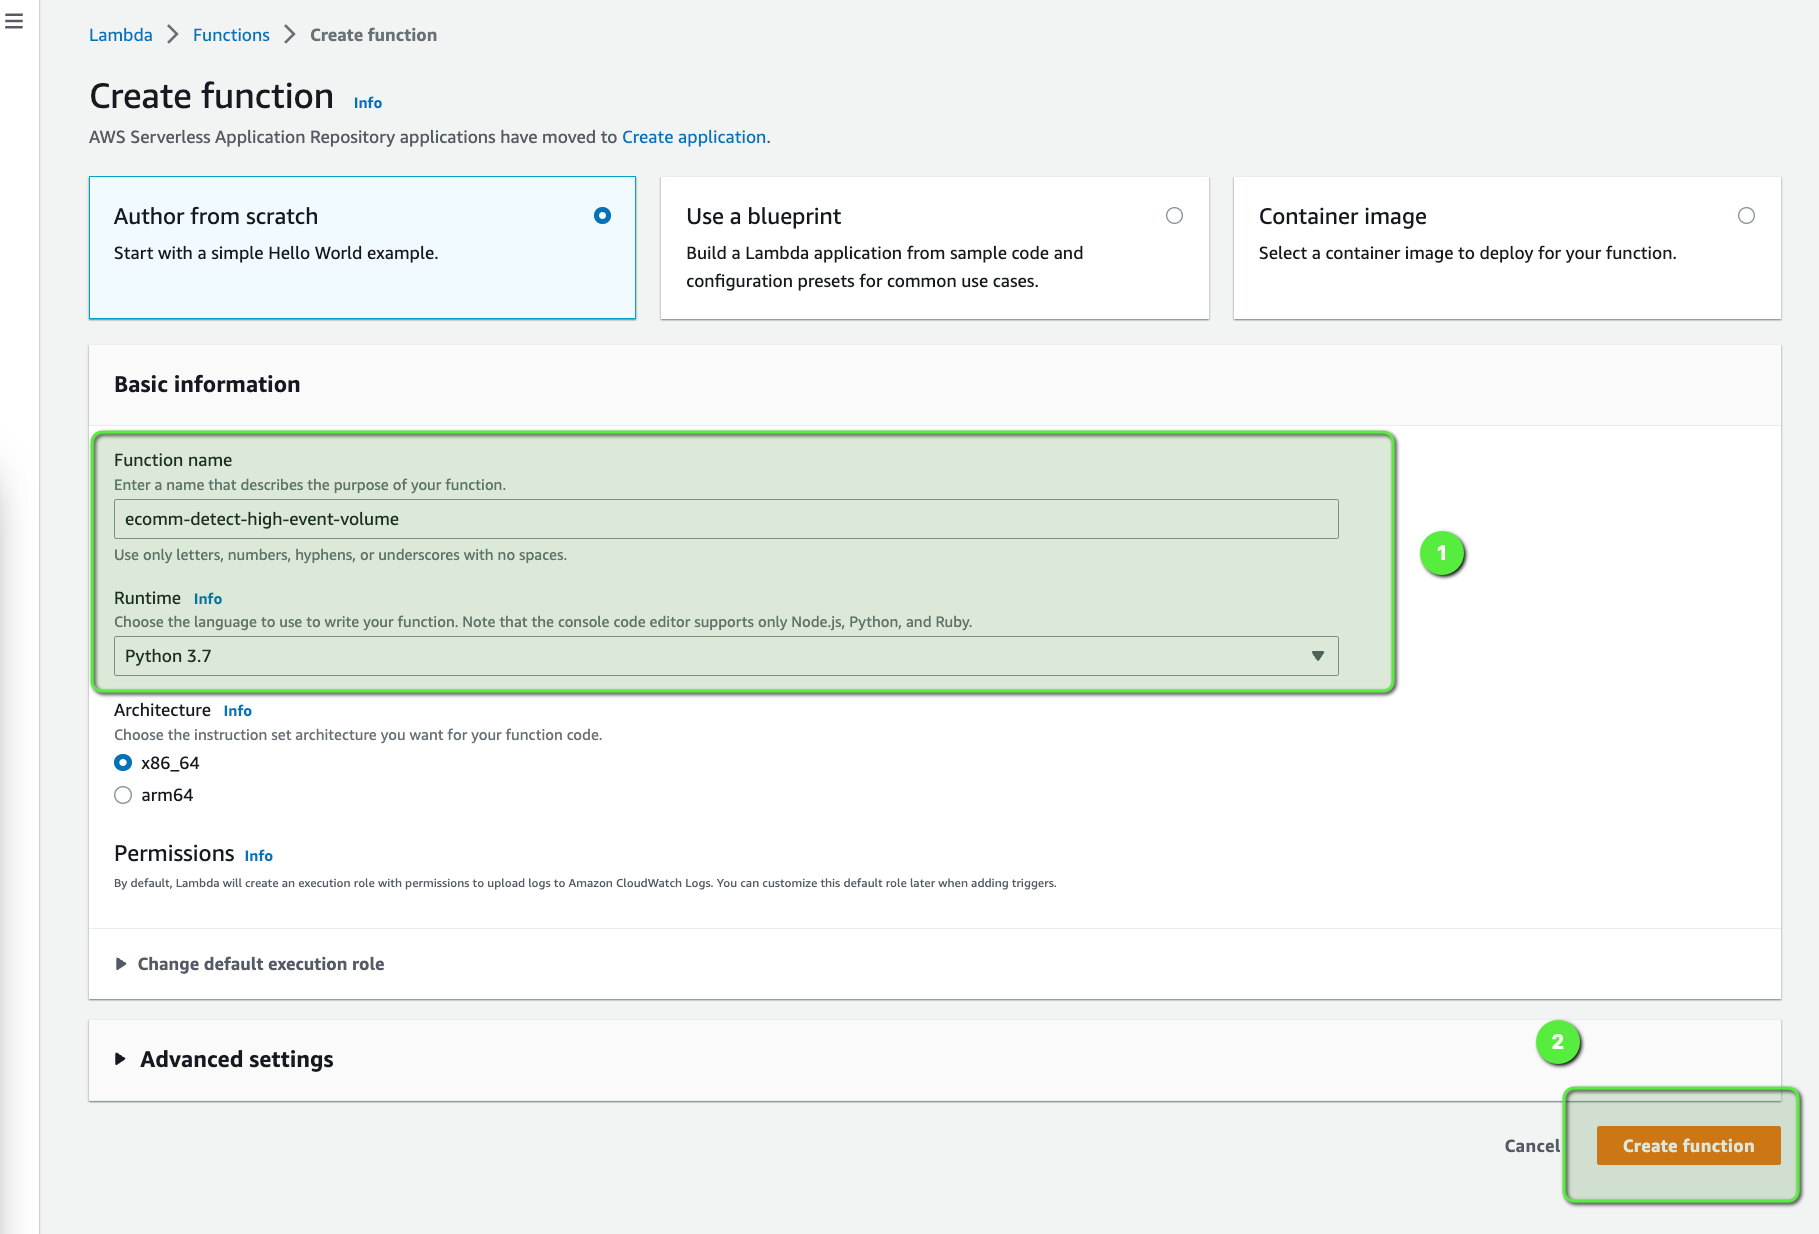
- Open the AWS Lambda console.
- Click on Create function button.

- Enter the Function name as
ecomm-detect-high-event-volume. - Enter the Runtime as
Python 3.7. - Click on Create function.
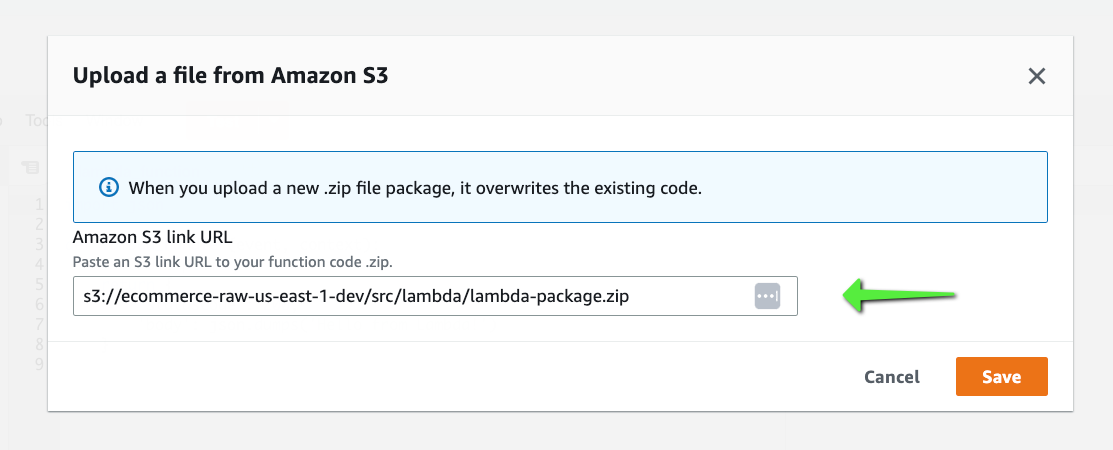
Once the Lambda function is created we need to upload the code which we stored in S3.

Provide the location of the Lambda code and click on Save:
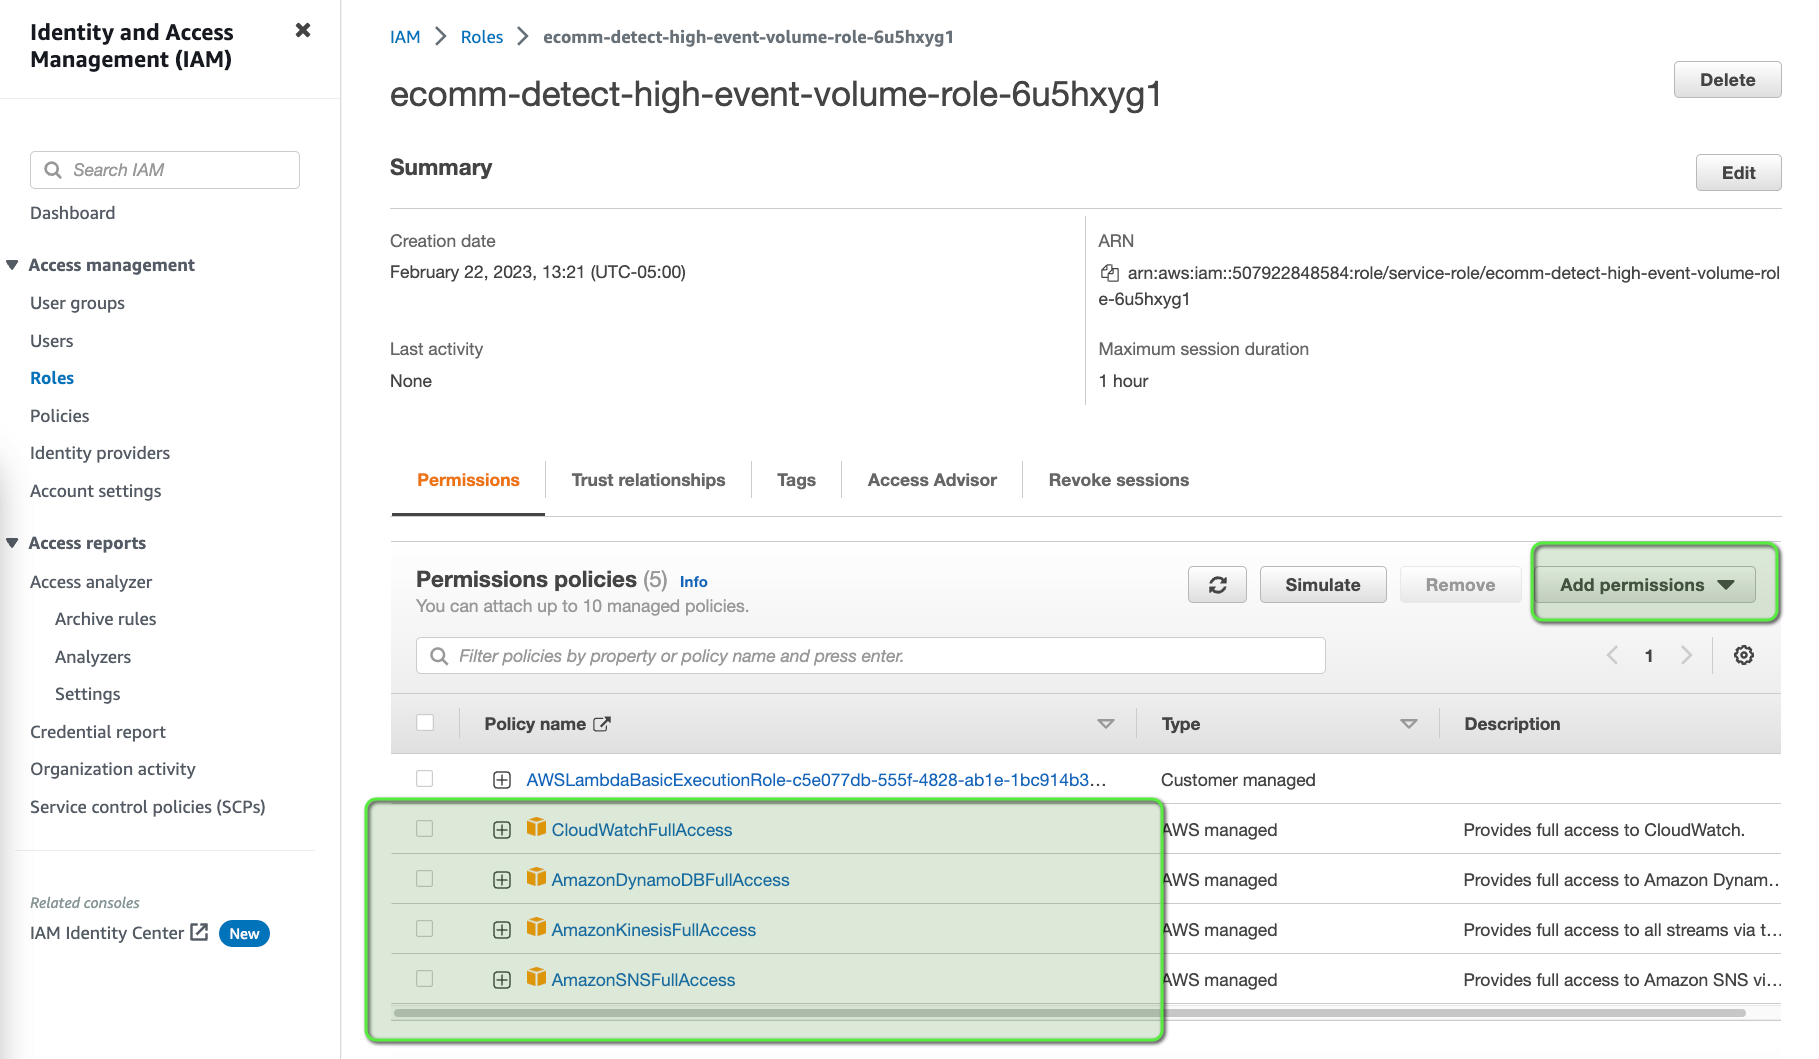
We need to provide adequate privileges to our Lambda function so that it can talk to Kinesis Data Streams, DynamoDB, CloudWatch, and SNS. To modify the IAM Role:
- Go to the Configuration tab > Permission tab on the left.
- Click on the Role Name.

Since this is just for the demo, we are adding Full Access, but it's NOT recommended for the production environment. We should always follow the least privilege principle to grant access to any user/resource.
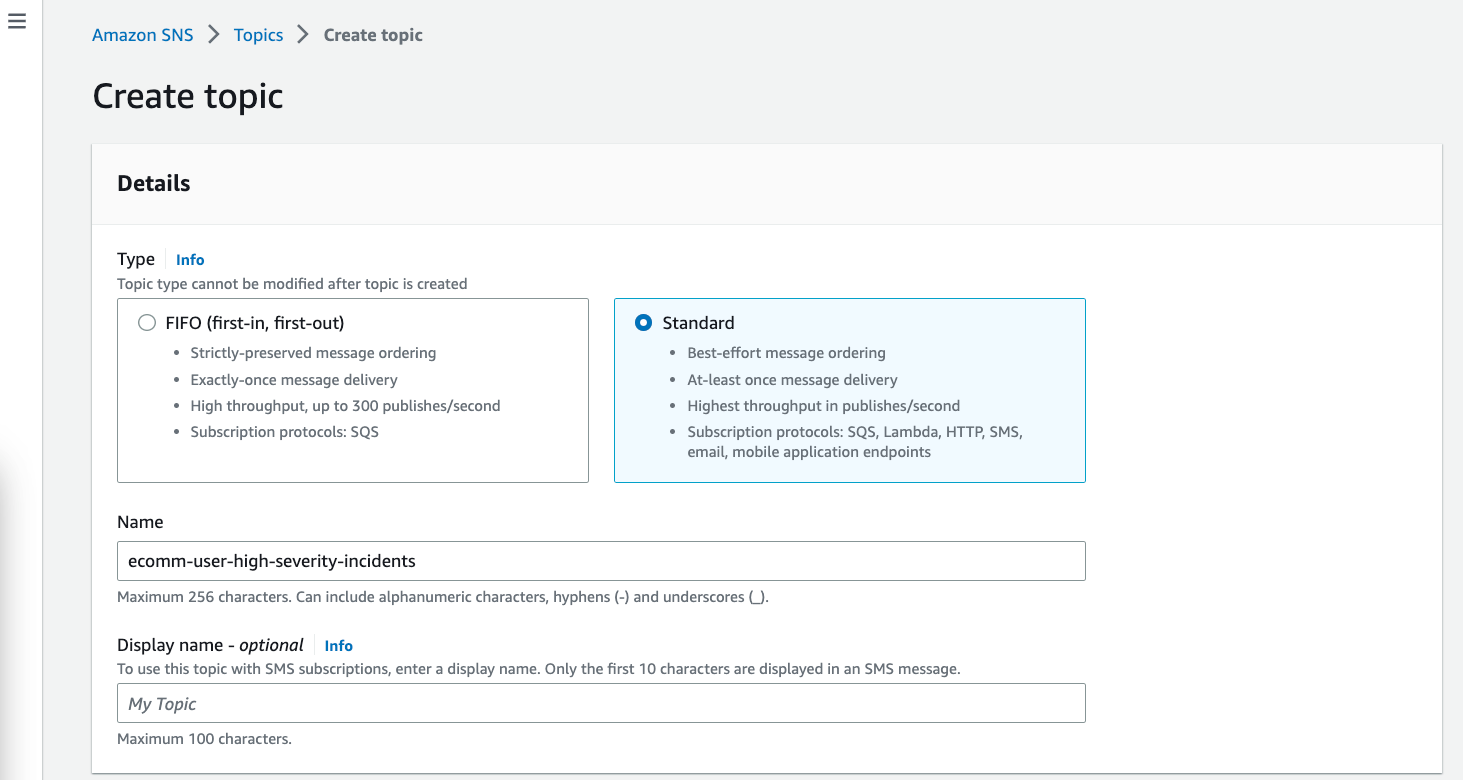
Let's create the SNS Topic:
- Open the Amazon SNS console.
- Click on Create Topic.
- Select the Type as Standard.
- Provide the Name as
ecomm-user-high-severity-incidents. - Click on Create Topic.
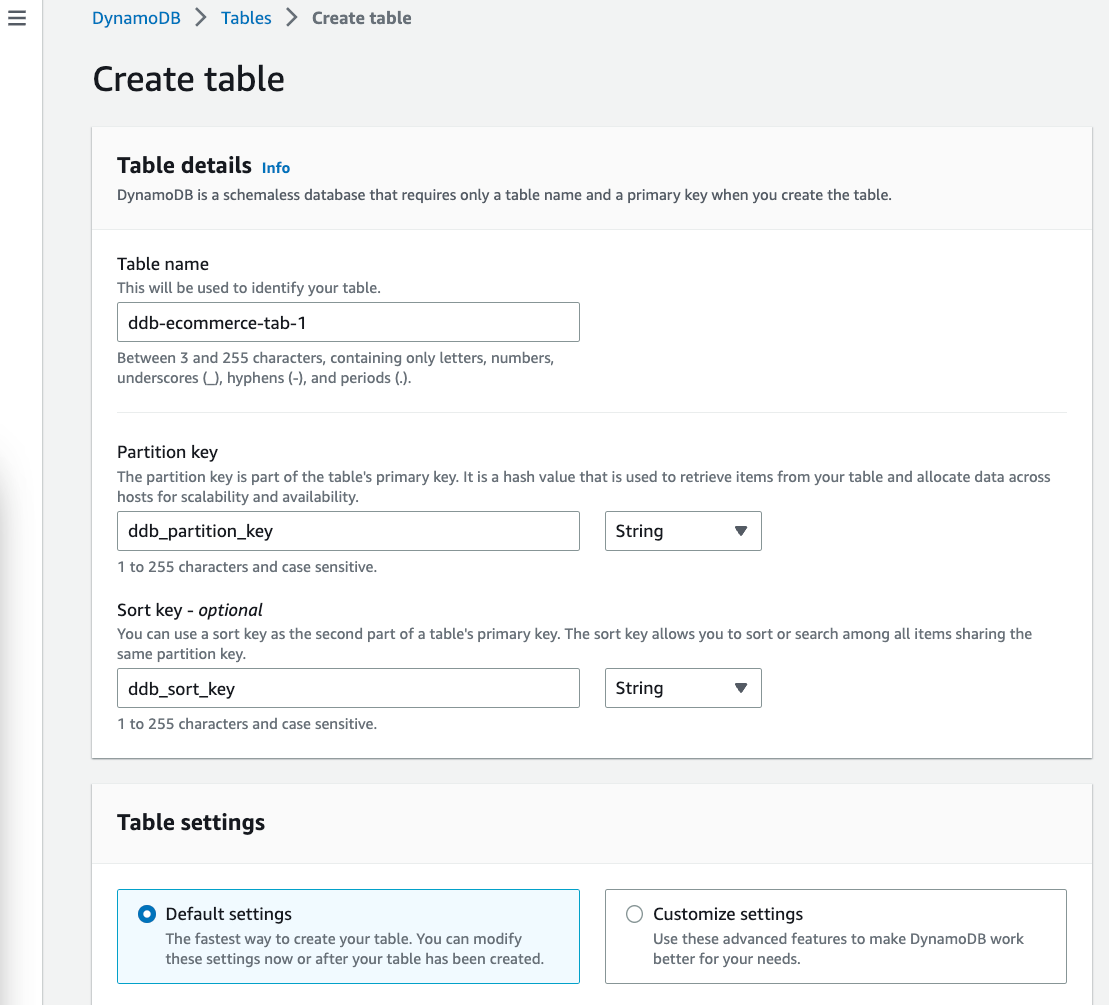
Let's create a DynamoDB table:
- Open the Amazon DynamoDB console.
- Click on Create table.
- Create the table with the following details.

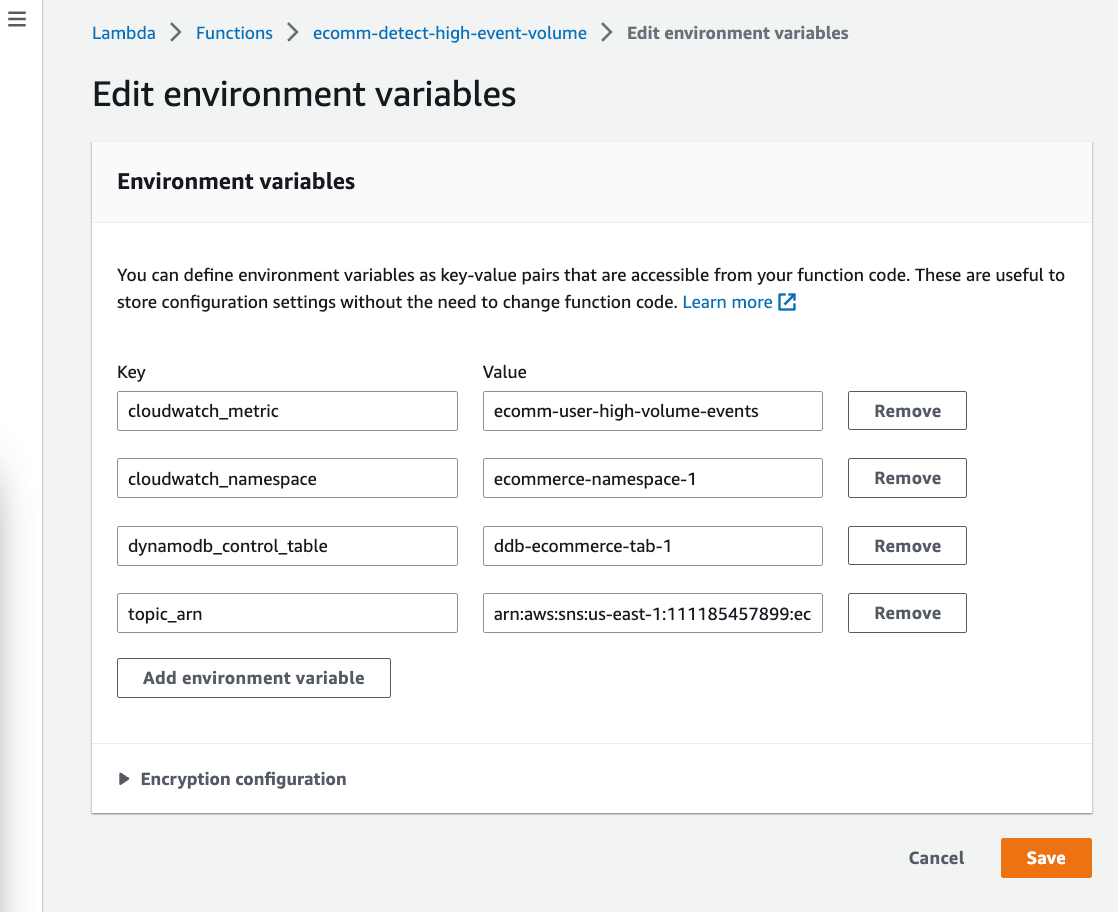
Now, we can add the environment variables that are needed for the Lambda Function. These environment variables are used in the lambda function code.
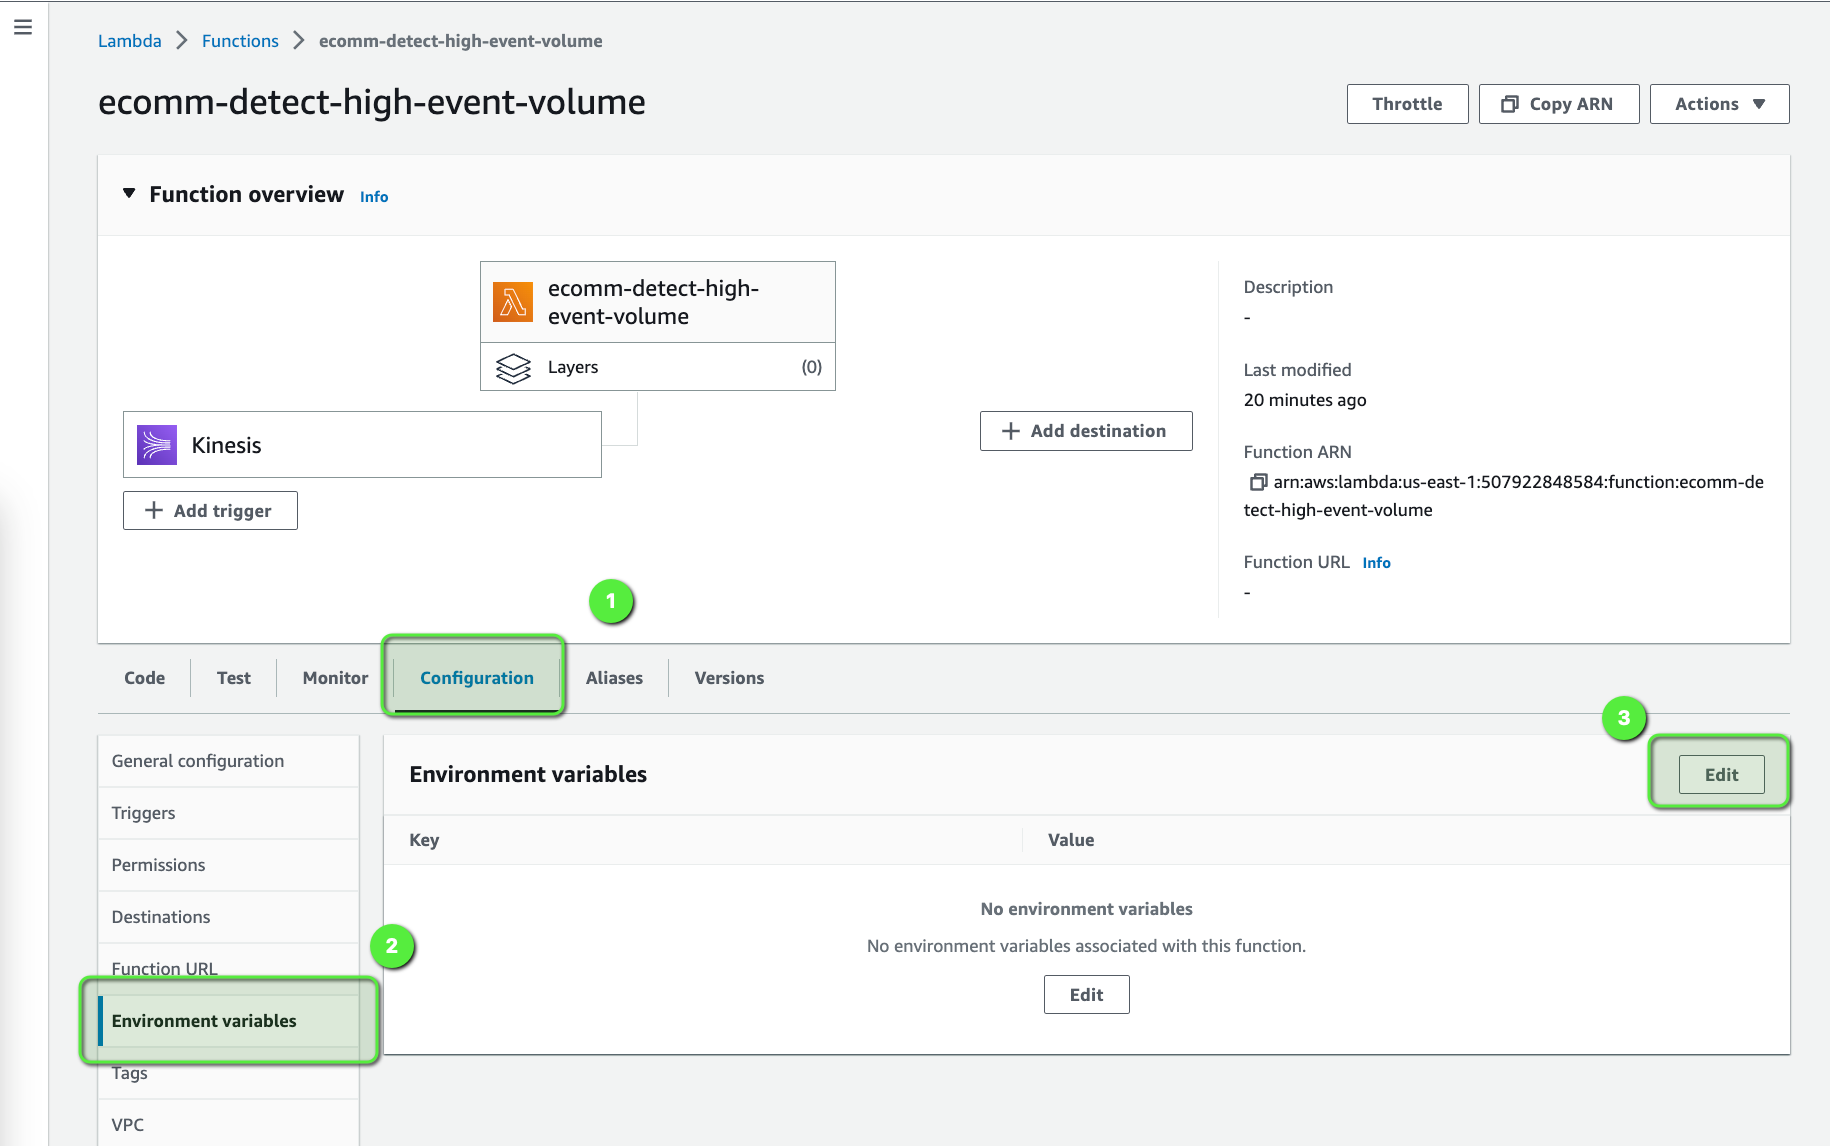
The following are the environment variables: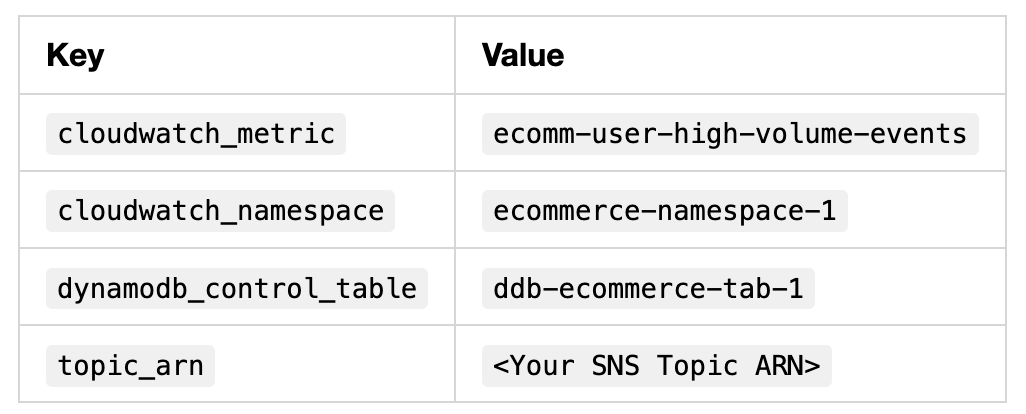
Show Time
So, now we are all done with the implementation and it's time to start generating the traffic using the python script which we created earlier, and see everything in action!!
cd build-a-managed-analytics-platform-for-e-commerce-business

python code/ecomm-simulation-app/stream-data-app-simulation.py
HttpStatusCode: 200 ,  electronics.smartphone
HttpStatusCode: 200 ,  appliances.sewing_machine
HttpStatusCode: 200 ,
HttpStatusCode: 200 ,  appliances.kitchen.washer
HttpStatusCode: 200 ,  electronics.smartphone
HttpStatusCode: 200 ,  computers.notebook
HttpStatusCode: 200 ,  computers.notebook
HttpStatusCode: 200 ,
HttpStatusCode: 200 ,
HttpStatusCode: 200 ,  electronics.smartphone
HttpStatusCode: 200 ,  furniture.living_room.sofa
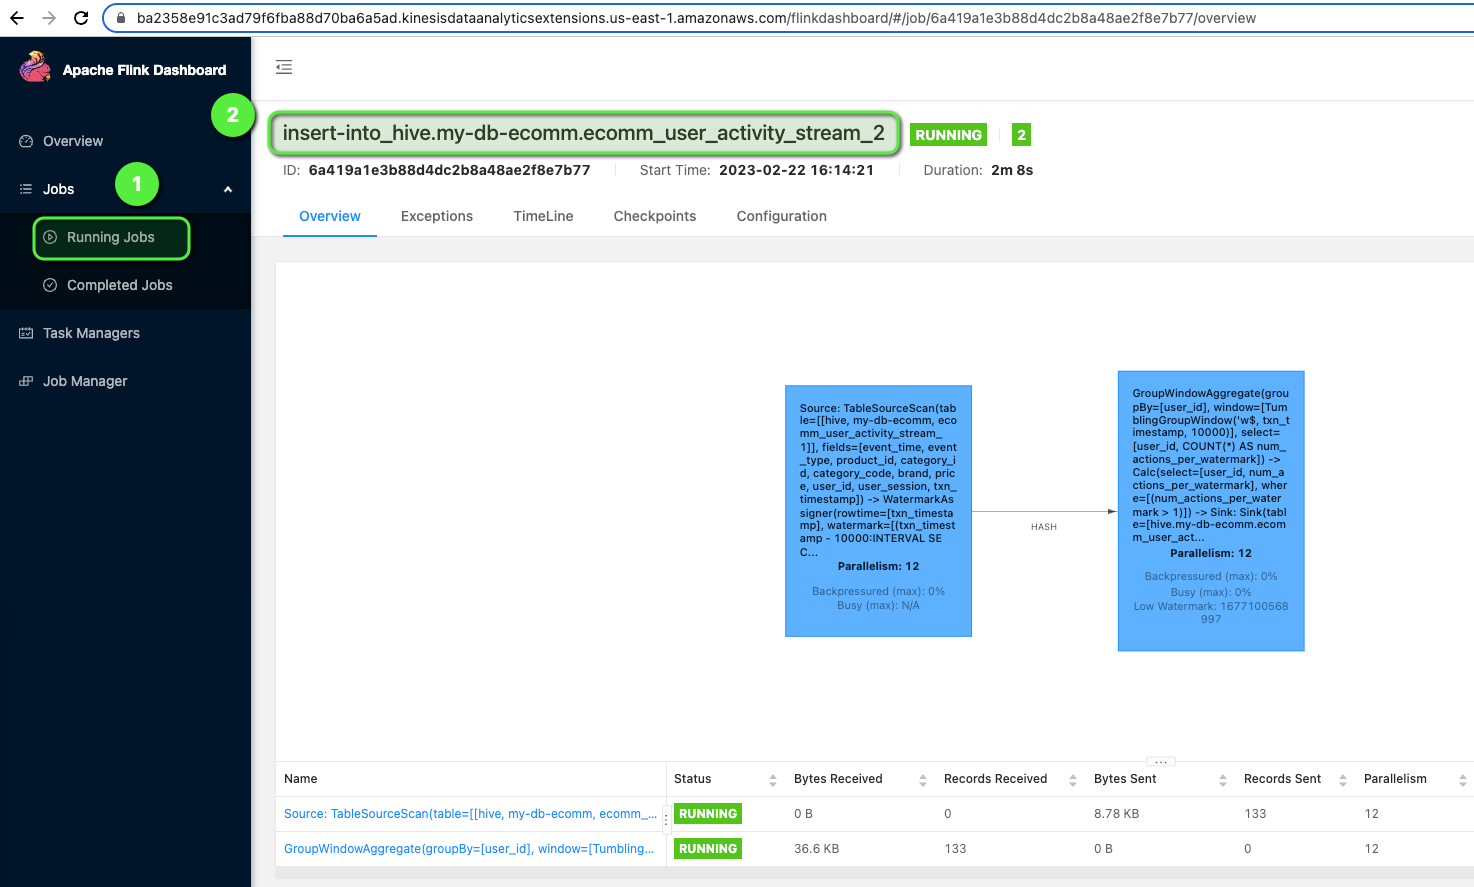
We can also monitor this traffic using the Apache Flink Dashboard:
- Open the Amazon Kinesis Application dashboard.
- Select the Application,
ecomm-streaming-app-v1-sql-flink-ecomm-notebook-1-2HFDAA9HY. - Click on Open Apache Flink dashboard.

Once you are on the Open Apache Flink dashboard.
- Click on Running Jobs > Job Name which is running.
Finally, we can also see all the details of the users, which are classified as a DDoS attack by the Flink Application in the DynamoDB table.
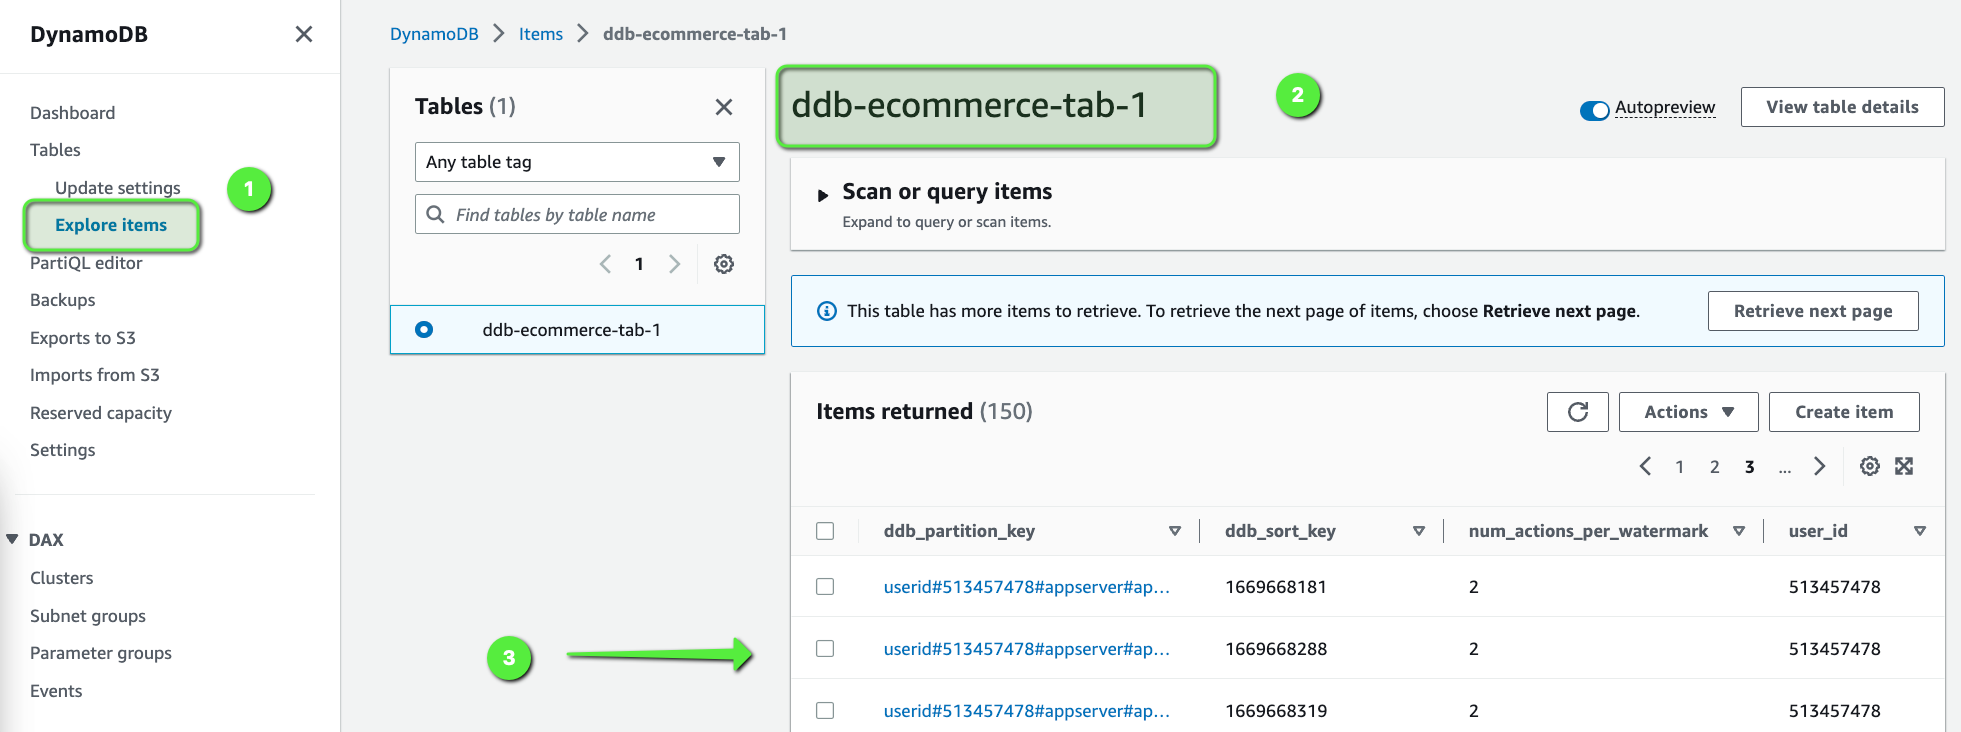
You can let the simulator run for the next 5-10 mins and can explore and monitor all the components we have built in this whole data pipeline.
Summary
In this blog post, we built an e-commerce analytical platform that can help analyze the data in real-time.
We used a python script to simulate the real traffic using the dataset and used Amazon Kinesis as the incoming stream of data. That data is being analyzed by Amazon Kinesis Data Analytics using Apache Flink using SQL, which involves detecting distributed denial-of-service (DDoS) and bot attacks using AWS Lambda, DynamoDB, CloudWatch, and AWS SNS.
In the second part of this blog series, we will dive deep and build the batch processing pipeline and build a dashboard using Amazon QuickSight, which will help us to get more insights about users. It will help us to know details like, who visits the e-commerce website more frequently, which are the top and bottom selling products, which are the top brands, and so on.
Opinions expressed by DZone contributors are their own.

Comments