A Practical Guide to OpenTelemetry With Spring Boot Workloads
This tutorial demonstrates setting up OpenTelemetry with Spring Boot for observability, including metrics, traces, and logs, using tools like Grafana, Loki, and Tempo.
Join the DZone community and get the full member experience.
Join For FreeIn this tutorial, we consolidated some practical approaches regarding OpenTelemetry and how to use it with Spring Boot. This tutorial is composed of four primary sections:
- OpenTelemetry practical concepts
- Setting up an observability stack with OpenTelemetry Collector, Grafana, Loki, Tempo, and Podman
- Instrumenting Spring Boot applications for OpenTelemetry
- Testing and E2E sample
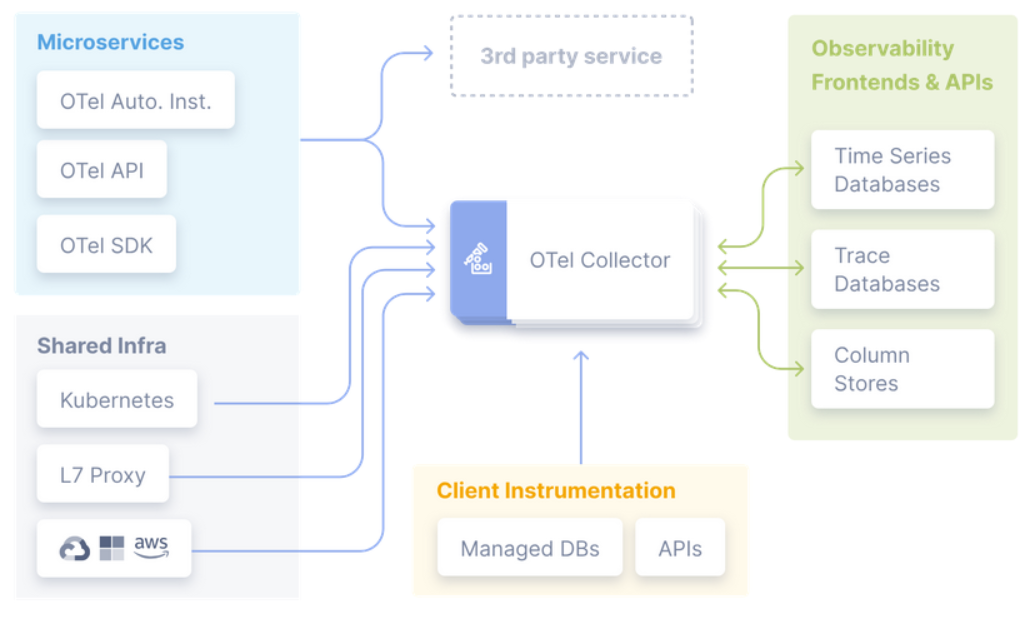
By the end of the tutorial, you should be able to implement the following architecture:

OpenTelemetry Practical Concepts
As the official documentation states, OpenTelemetry is:
- An observability framework and toolkit designed to create and manage telemetry data such as traces, metrics, and logs
- Vendor and tool-agnostic, meaning that it can be used with a broad variety of Observability backends.
- Focused on the generation, collection, management, and export of telemetry. A major goal of OpenTelemetry is that you can easily instrument your applications or systems, no matter their language, infrastructure, or runtime environment.
Monitoring, Observability, and METL
To keep things short, monitoring is the process of collecting, processing, and analyzing data to track the state of a (information) system. Then, monitoring is going to the next level, to actually understand the information that is being collected and do something with it, like defining alerts for a given system.
To achieve both goals, it is necessary to collect three dimensions of data, specifically:
- Logs: Registries about processes and applications, with useful data like timestamps and context
- Metrics: Numerical data about the performance of applications and application modules
- Traces: Data that allow to estabilish the complete route that a given operation traverses through a series of dependent applications
Hence, when the state of a given system is altered in some way, we have an Event, which correlates and ideally generates data on the three dimensions.
Why Is OpenTelemetry Important, and What Problem Does It Solve?
Developers recognize by experience that monitoring and observability are important, either to evaluate the actual state of a system or to do post-mortem analysis after disasters. Hence, it is natural to think that observability has been implemented in various ways. For example, if we think of a system constructed with Java, we have at least the following collection points:
- Logs: Systemd, /var/log, /opt/tomcat, FluentD
- Metrics: Java metrics via JMX, OS Metrics, vendor specific metrics via Spring Actuator
- Tracing: Data via Jaeger or Zipkin tooling in our Java workloads
This variety in turn imposes a great amount of complexity in instrumenting our systems to provide information, that a- comes in different formats, from b- technology that is difficult to implement, often with c- solutions that are too tied to a given provider or in the worst cases, d- technologies that only work with certain languages/frameworks.
And that's the magic about the OpenTelemetry proposal: by creating a working group under the CNCF umbrella the project can provide useful things like:
- Common protocols that vendors and communities can implement to talk to each other
- Standards for software communities to implement instrumentation in libraries and frameworks to provide data in OpenTelemetry format
- A collector able to retrieve/receive data from diverse origins compatible with OpenTelemetry, process it and send it to...
- Analysis platforms, databases, and cloud vendors able to receive the data and provide added value over it
In short, OpenTelemetry is the reunion of various great monitoring ideas that overlapping software communities can implement to facilitate the burden of monitoring implementations.
OpenTelemetry Data Pipeline
For me, the easiest way to think about OpenTelemetry concepts is a data pipeline, in this data pipeline you need to
- Instrument your workloads to push (or offer) the telemetry data to a processing/collecting element — i.e., OpenTelemetry Collector-
- Configure OpenTelemetry Collector to receive or pull the data from diverse workloads
- Configure OpenTelemetry Collector to process the data — i.e., adding special tags, filtering data
- Configure OpenTelemetry Collector to push (or offer) the data to compatible backends
- Configure and use the backends to receive (or pull) the data from the collector to allow analysis, alarms, AI... pretty much any case that you can think about with data
Setting up an observability stack with OpenTelemetry Collector, Grafana, Prometheus, Loki, Tempo and Podman

As OpenTelemetry got popular various vendors have implemented support for it, to mention a few:
Self-hosted platforms
Cloud platforms
Hence, for development purposes, it is always useful to know how to bootstrap a quick observability stack able to receive and show OpenTelemetry capabilities.
For this purpose, we will use the following elements:
- Prometheus as a time-series database for metrics
- Loki as a logs platform
- Tempo as a tracing platform
- Grafana as a web UI
And of course OpenTelemetry collector. This example is based on various Grafana examples, with a little bit of tweaking to demonstrate the different ways of collecting, processing and sending data to backends.
OpenTelemetry Collector
As stated previously, OpenTelemetry collector acts as an intermediary that receives/pull information from data sources, processes this information and, forwards the information to destinations like analysis platforms or even other collectors. The collector is able to do this either with compliant workloads or via plugins that talk with the workloads using proprietary formats.
As the plugins collection can be increased or decreased, vendors have created their own distributions of OpenTelemetry collectors, for reference I've used successfully in the real world:
- Amazon ADOT
- Splunk Distribution of OpenTelemetry Collector
- Grafana Alloy
- OpenTelemetry Collector (the reference implementation)
You can find a complete list directly on the OpenTelemetry website.
For this demonstration, we will create a data pipeline using the contrib version of the reference implementation, which provides a good amount of receivers, exporters, and processors. In our case, Otel configuration is designed to:
- Receive data from Spring Boot workloads (ports 4317 and 4318)
- Process the data, adding a new tag to metrics
- Expose an endpoint for Prometheus scraping (port 8889)
- Send logs to Loki (port 3100) using otlphttp format
- Send traces to Tempo (port 9411) using otlp format
- Exposes a rudimentary dashboard from the collector, called zpages. Very useful for debugging.
otel-config.yaml
receivers:
  otlp:
    protocols:
      grpc:
        endpoint: 0.0.0.0:4317
      http:
        endpoint: 0.0.0.0:4318
processors:
  attributes:
    actions:
      - key: team
        action: insert
        value: vorozco
exporters:
  debug:
  prometheus:
    endpoint: "0.0.0.0:8889"
  otlphttp:
    endpoint: http://loki:3100/otlp
  otlp:
    endpoint: tempo:4317
    tls:
      insecure: true
service:
  extensions: [zpages]
  pipelines:
    metrics:
      receivers: [otlp]
      processors: [attributes]
      exporters: [debug,prometheus]
    traces:
      receivers: [otlp]
      exporters: [debug, otlp]
    logs:
      receivers: [otlp]
      exporters: [debug, otlphttp]
extensions:
  zpages:
    endpoint: "0.0.0.0:55679"
Prometheus
Prometheus is a well known analysis platform, that among other things offers dimensional data and a performant time-series storage.
By default, it works as a metrics scrapper, then, workloads provide a http endpoint offering data using the Prometheus format. For our example, we configured Otel to offer metrics to the prometheus host via port 8889.
prometheus:
    endpoint: "prometheus:8889"
Then, whe need to configure Prometheus to scrape the metrics from the Otel host. You would notice two ports, the one that we defined for the active workload data (8889) and another for metrics data for the collector itself (8888).
prometheus.yml
scrape_configs:
- job_name: "otel"
  scrape_interval: 10s
  static_configs:
    - targets: ["otel:8889"]
    - targets: ["otel:8888"]
It is worth highlighting that Prometheus also offers a way to ingest information instead of scrapping it, and, the official support for OpenTelemetry ingestion is coming on the new versions.
Loki
As described in the website, Loki is a specific solution for log aggregation heavily inspired by Prometheus, with the particular design decision to NOT format in any way the log contents, leaving that responsibility to the query system.
To configure the project for local environments, the project offers a configuration that is usable for most of the development purposes. The following configuration is an adaptation to preserve the bare minimum to work with temporal files and memory.
loki.yaml
auth_enabled: false

server:
  http_listen_port: 3100
  grpc_listen_port: 9096

common:
  instance_addr: 127.0.0.1
  path_prefix: /tmp/loki
  storage:
    filesystem:
      chunks_directory: /tmp/loki/chunks
      rules_directory: /tmp/loki/rules
  replication_factor: 1
  ring:
    kvstore:
      store: inmemory

query_range:
  results_cache:
    cache:
      embedded_cache:
        enabled: true
        max_size_mb: 100

schema_config:
  configs:
    - from: 2020-10-24
      store: tsdb
      object_store: filesystem
      schema: v13
      index:
        prefix: index_
        period: 24h

ruler:
  alertmanager_url: http://localhost:9093

limits_config:
  allow_structured_metadata: true
Then, we configure an exporter to deliver the data to the loki host using oltphttp format.
otlphttp:
  endpoint: http://loki:3100/otlp
Tempo
In similar fashion than Loki, Tempo is an Open Source project created by grafana that aims to provide a distributed tracing backend. On a personal note, for me besides performance it shines for being compatible not only with OpenTelemetry, it can also ingest data in Zipkin and Jaeger formats.
To configure the project for local environments, the project offers a configuration that is usable for most of the development purposes. The following configuration is an adaptation to remove the metrics generation and simplify the configuration, however with this we loose the service graph feature.
tempo.yaml
stream_over_http_enabled: true
server:
  http_listen_port: 3200
  log_level: info

query_frontend:
  search:
    duration_slo: 5s
    throughput_bytes_slo: 1.073741824e+09
    metadata_slo:
      duration_slo: 5s
      throughput_bytes_slo: 1.073741824e+09
  trace_by_id:
    duration_slo: 5s

distributor:
  receivers:
    otlp:
      protocols:
        http:
        grpc:

ingester:
  max_block_duration: 5m               # cut the headblock when this much time passes. this is being set for demo purposes and should probably be left alone normally

compactor:
  compaction:
    block_retention: 1h                # overall Tempo trace retention. set for demo purposes

storage:
  trace:
    backend: local                     # backend configuration to use
    wal:
      path: /var/tempo/wal             # where to store the wal locally
    local:
      path: /var/tempo/blocks
Then, we configure an exporter to deliver the data to Tempo host using oltp/grpc format.
otlp:
    endpoint: tempo:4317
    tls:
      insecure: true
Grafana
Loki, Tempo and (to some extent) Prometheus are data storages, but we still need to show this data to the user. Here, Grafana enters the scene.
Grafana offers a good selection of analysis tools, plugins, dashboards, alarms, connectors and a great community that empowers observability. Besides having a great compatibility with Prometheus, it offers of course a perfect compatibility with their other offerings.
To configure Grafana, you just need to plug compatible datasources, and the rest of the work will be on the web ui.
grafana.yaml
apiVersion: 1

datasources:
  - name: Otel-Grafana-Example
    type: prometheus
    url: http://prometheus:9090
    editable: true
  - name: Loki
    type: loki
    access: proxy
    orgId: 1
    url: http://loki:3100
    basicAuth: false
    isDefault: true
    version: 1
    editable: false
  - name: Tempo
    type: tempo
    access: proxy
    orgId: 1
    url: http://tempo:3200
    basicAuth: false
    version: 1
    editable: false
    apiVersion: 1
    uid: tempo
Podman (or Docker)
At this point, you may have noticed that I've referred to the backends using single names. This is because I intend to set these names using a Podman Compose deployment.
otel-compose.yml
version: '3'
services:
  otel:
    container_name: otel
    image: otel/opentelemetry-collector-contrib:latest
    command: [--config=/etc/otel-config.yml]
    volumes:
      - ./otel-config.yml:/etc/otel-config.yml
    ports:
      - "4318:4318"
      - "4317:4317"
      - "55679:55679"
  prometheus:
    container_name: prometheus
    image: prom/prometheus
    command: [--config.file=/etc/prometheus/prometheus.yml]
    volumes:
      - ./prometheus.yml:/etc/prometheus/prometheus.yml
    ports:
      - "9091:9090"
  grafana:
    container_name: grafana
    environment:
      - GF_AUTH_ANONYMOUS_ENABLED=true
      - GF_AUTH_ANONYMOUS_ORG_ROLE=Admin
    image: grafana/grafana
    volumes:
      - ./grafana.yml:/etc/grafana/provisioning/datasources/default.yml
    ports:
      - "3000:3000"
  loki:
    container_name: loki
    image: grafana/loki:3.2.0
    command: -config.file=/etc/loki/local-config.yaml
    volumes:
      - ./loki.yaml:/etc/loki/local-config.yaml
    ports:
      - "3100"
  tempo:
    container_name: tempo
    image: grafana/tempo:latest
    command: [ "-config.file=/etc/tempo.yaml" ]
    volumes:
      - ./tempo.yaml:/etc/tempo.yaml
    ports:
      - "4317"  # otlp grpc
      - "4318"
At this point, the compose description is pretty self-descriptive, but I would like to highlight some things:
- Some ports are open to the host -e.g. 4318:4318 - while others are closed to the default network that compose will be created among containers -e.g. 3100-
- This stack is designed to avoid any permanent data. Again, this is my personal way to boot quickly an observability stack to allow tests during deployment. To make it ready for production, you probably would want to preserve the data in some volumes
Once the configuration is ready, you can launch it using the compose file
cd podman
podman compose -f otel-compose.yml up
If the configuration is ok, you should have five containers running without errors.
Instrumenting Spring Boot Applications for OpenTelemetry
As part of my daily activities, I was in charge of a major implementation of all these concepts. Hence, it was natural for me to create a proof of concept that you can find at my GitHub.
For demonstration purposes, we have two services with different HTTP endpoints:
springboot-demo:8080- Useful to demonstrate local and database tracing, performance, logs and OpenTelemetry instrumentation/books— A books CRUD using Spring Data/fibo— A Naive Fibonacci implementation that generates CPU load and delays/log— Which generate log messages using the different SLF4J levels
springboot-client-demo:8081- Useful to demonstrate tracing capabilities, Micrometer instrumentation and Micrometer Tracing instrumentation/trace-demo- A quick OpenFeing client that invokes books GetAll Books demo
Instrumentation Options
Given the popularity of OpenTelemetry, developers can also expect multiple instrumentation options.
First of all, the OpenTelemetry project offers a framework-agnostic instrumentation that uses bytecode manipulation, for this instrumentation to work you need to include a Java Agent via Java Classpath. In my experience this instrumentation is preferred if you don't control the workload or if your platform does not offer OpenTelemetry support at all.
However, instrumentation of workloads can become really specific — e.g. instrumentation of a Database pool given a particular IoC mechanism. For this, the Java world provides a good ecosystem, for example:
And, of course, Spring Boot.
Spring Boot is a special case with TWO major instrumentation options
Both options use Spring concepts like decorators and interceptors to capture and send information to the destinations. The only rule is to create the clients/services/objects in the Spring way (hence via Spring IoC).
I've used both successfully, and my heavily opinionated conclusion is the following:
- Micrometer collects more information about spring metrics. Besides the OpenTelemetry backend, it supports a plethora of backends directly without any collector intervention. If you cannot afford a collector, this is the way. From a Micrometer perspective, OpenTelemetry is just another backend.
- Micrometer Tracing is the evolution of Spring Cloud Sleuth, hence, if you have workloads with Spring Boot 2 and 3, you have to support both tools (or maybe migrate everything to Spring boot 3?)
- The Micrometer family does not offer a way to collect logs and send these to a backend, hence devs have to solve this by using an appender specific to your logging library. On the other hand OpenTelemetry Spring Boot starter offers this out of the box if you use Spring Boot default (SLF4J over Logback)
As these libraries are mutually exclusive, if the decision were mine, I would pick OpenTelemetry's Spring Boot starter. It offers logs support OOB and also a bridge for micrometer Metrics.
Instrumenting springboot-demo With OpenTelemetry SpringBoot Starter
As always, it is also good to consider the official documentation.
Otel instrumentation with the Spring started is activated in three steps:
- You need to include both OpenTelemetry Bom and OpenTelemetry dependency. If you are planning to also use micrometer metrics, it is also a good idea to include Spring Actuator
<dependencyManagement>
    <dependencies>
        <dependency>
            <groupId>io.opentelemetry.instrumentation</groupId>
            <artifactId>opentelemetry-instrumentation-bom</artifactId>
            <version>2.10.0</version>
            <type>pom</type>
            <scope>import</scope>
        </dependency>
    </dependencies>
</dependencyManagement>
...
<dependency>
    <groupId>org.springframework.boot</groupId>
    <artifactId>spring-boot-starter-actuator</artifactId>
</dependency>
<dependency>
    <groupId>io.opentelemetry.instrumentation</groupId>
    <artifactId>opentelemetry-spring-boot-starter</artifactId>
</dependency>-
There is a set of optional libraries and adapters that you can configure if your workloads already diverged from the "Spring Way"
-
You need to activate (or not) the dimensions of observability (metrics, traces and logs). Also, you can fine-tune the exporting parameters like ports, URLs, or exporting periods. Either by using Spring Properties or env variables
#Configure exporters
otel.logs.exporter=otlp
otel.metrics.exporter=otlp
otel.traces.exporter=otlp

#Configure metrics generation
otel.metric.export.interval=5000 #Export metrics each five seconds
otel.instrumentation.micrometer.enabled=true #Enabe Micrometer metrics bridge
Instrumenting springboot-client-demo With Micrometer and Micrometer Tracing
Again, this instrumentation does not support logs exporting. Also, it is a good idea to check the latest documentation for Micrometer and Micrometer Tracing.
- As in the previous example, you need to enable the Spring Actuator (which includes Micrometer). As OpenTelemetry is just a backend from Micrometer's perspective, so you just need to enable the corresponding OTLP registry, which will export metrics to localhost by default.
<dependency>
    <groupId>org.springframework.boot</groupId>
    <artifactId>spring-boot-starter-actuator</artifactId>
</dependency>
<dependency>
    <groupId>io.micrometer</groupId>
    <artifactId>micrometer-registry-otlp</artifactId>
</dependency>- In a similar way, once Actuator is enabled, you just need to add support for the tracing backend.
<dependency>
  <groupId>io.micrometer</groupId>
  <artifactId>micrometer-tracing-bridge-otel</artifactId>
</dependency>- Finally, you can fine-tune the configuration using Spring properties. For example, you can decide if 100% of traces are reported or how often the metrics are reported to the backend.
management.otlp.tracing.endpoint=http://localhost:4318/v1/traces
management.otlp.tracing.timeout=10s
management.tracing.sampling.probability=1

management.otlp.metrics.export.url=http://localhost:4318/v1/metrics
management.otlp.metrics.export.step=5s
management.opentelemetry.resource-attributes."service-name"=${spring.application.name}
Testing and E2E Sample
Generating Workload Data
The POC provides the following structure
├── podman # Podman compose config files
├── springboot-client-demo #Spring Boot Client instrumented with Actuator, Micrometer and MicroMeter tracing
└── springboot-demo #Spring Boot service instrumented with OpenTelemetry Spring Boot Starter
- The first step is to boot the observability stack we created previously.
cd podman
podman compose -f otel-compose.yml up
This will provide you with an instance of Grafana on port 3000
Then, it is time to boot the first service!. You only need Java 21 on the active shell:
cd springboot-demo
mvn spring-boot:run
If the workload is properly configured, you will see the following information on the OpenTelemetry container standard output. Which basically says you are successfully reporting data.
[otel]       | 2024-12-01T22:10:07.730Z info    Logs    {"kind": "exporter", "data_type": "logs", "name": "debug", "resource logs": 1, "log records": 24}
[otel]       | 2024-12-01T22:10:10.671Z info    Metrics {"kind": "exporter", "data_type": "metrics", "name": "debug", "resource metrics": 1, "metrics": 64, "data points": 90}
[otel]       | 2024-12-01T22:10:10.672Z info    Traces  {"kind": "exporter", "data_type": "traces", "name": "debug", "resource spans": 1, "spans": 5}
[otel]       | 2024-12-01T22:10:15.691Z info    Metrics {"kind": "exporter", "data_type": "metrics", "name": "debug", "resource metrics": 1, "metrics": 65, "data points": 93}
[otel]       | 2024-12-01T22:10:15.833Z info    Metrics {"kind": "exporter", "data_type": "metrics", "name": "debug", "resource metrics": 1, "metrics": 65, "data points": 93}
[otel]       | 2024-12-01T22:10:15.835Z info    Logs    {"kind": "exporter", "data_type": "logs", "name": "debug", "resource logs": 1, "log records": 5}
The data is being reported over the OpenTelemetry ports (4317 and 4318), which are open from Podman to the host. By default, all telemetry libraries report to localhost, but this can be configured for other cases like FaaS or Kubernetes.
Also, you can verify the reporting status in ZPages.
Finally, let's do the same withthe Spring Boot client:
cd springboot-client-demo
mvn spring-boot:run
As described in the previous section, I created a set of interactions to:
Generate CPU workload using Naive fibonacci:
curl http://localhost:8080/fibo\?n\=45Generate logs in different levels:
curl http://localhost:8080/fibo\?n\=45Persist data using a CRUD:
curl -X POST --location "http://localhost:8080/books" \
-H "Content-Type: application/json" \
-d '{
"author": "Miguel Angel Asturias",
"title": "El señor presidente",
"isbn": "978-84-376-0494-7",
"publisher": "Editorial planeta"
}'
And then retrieve the data using a secondary service:
curl http://localhost:8081/trace-demo This asciicast shows the interaction:
https://asciinema.org/a/692968
Grafana Results
Once the data is accessible by Grafana, the what to do with data is up to you. Again, you could:
- Create dashboards
- Configure alarms
- Configure notifications from alarms
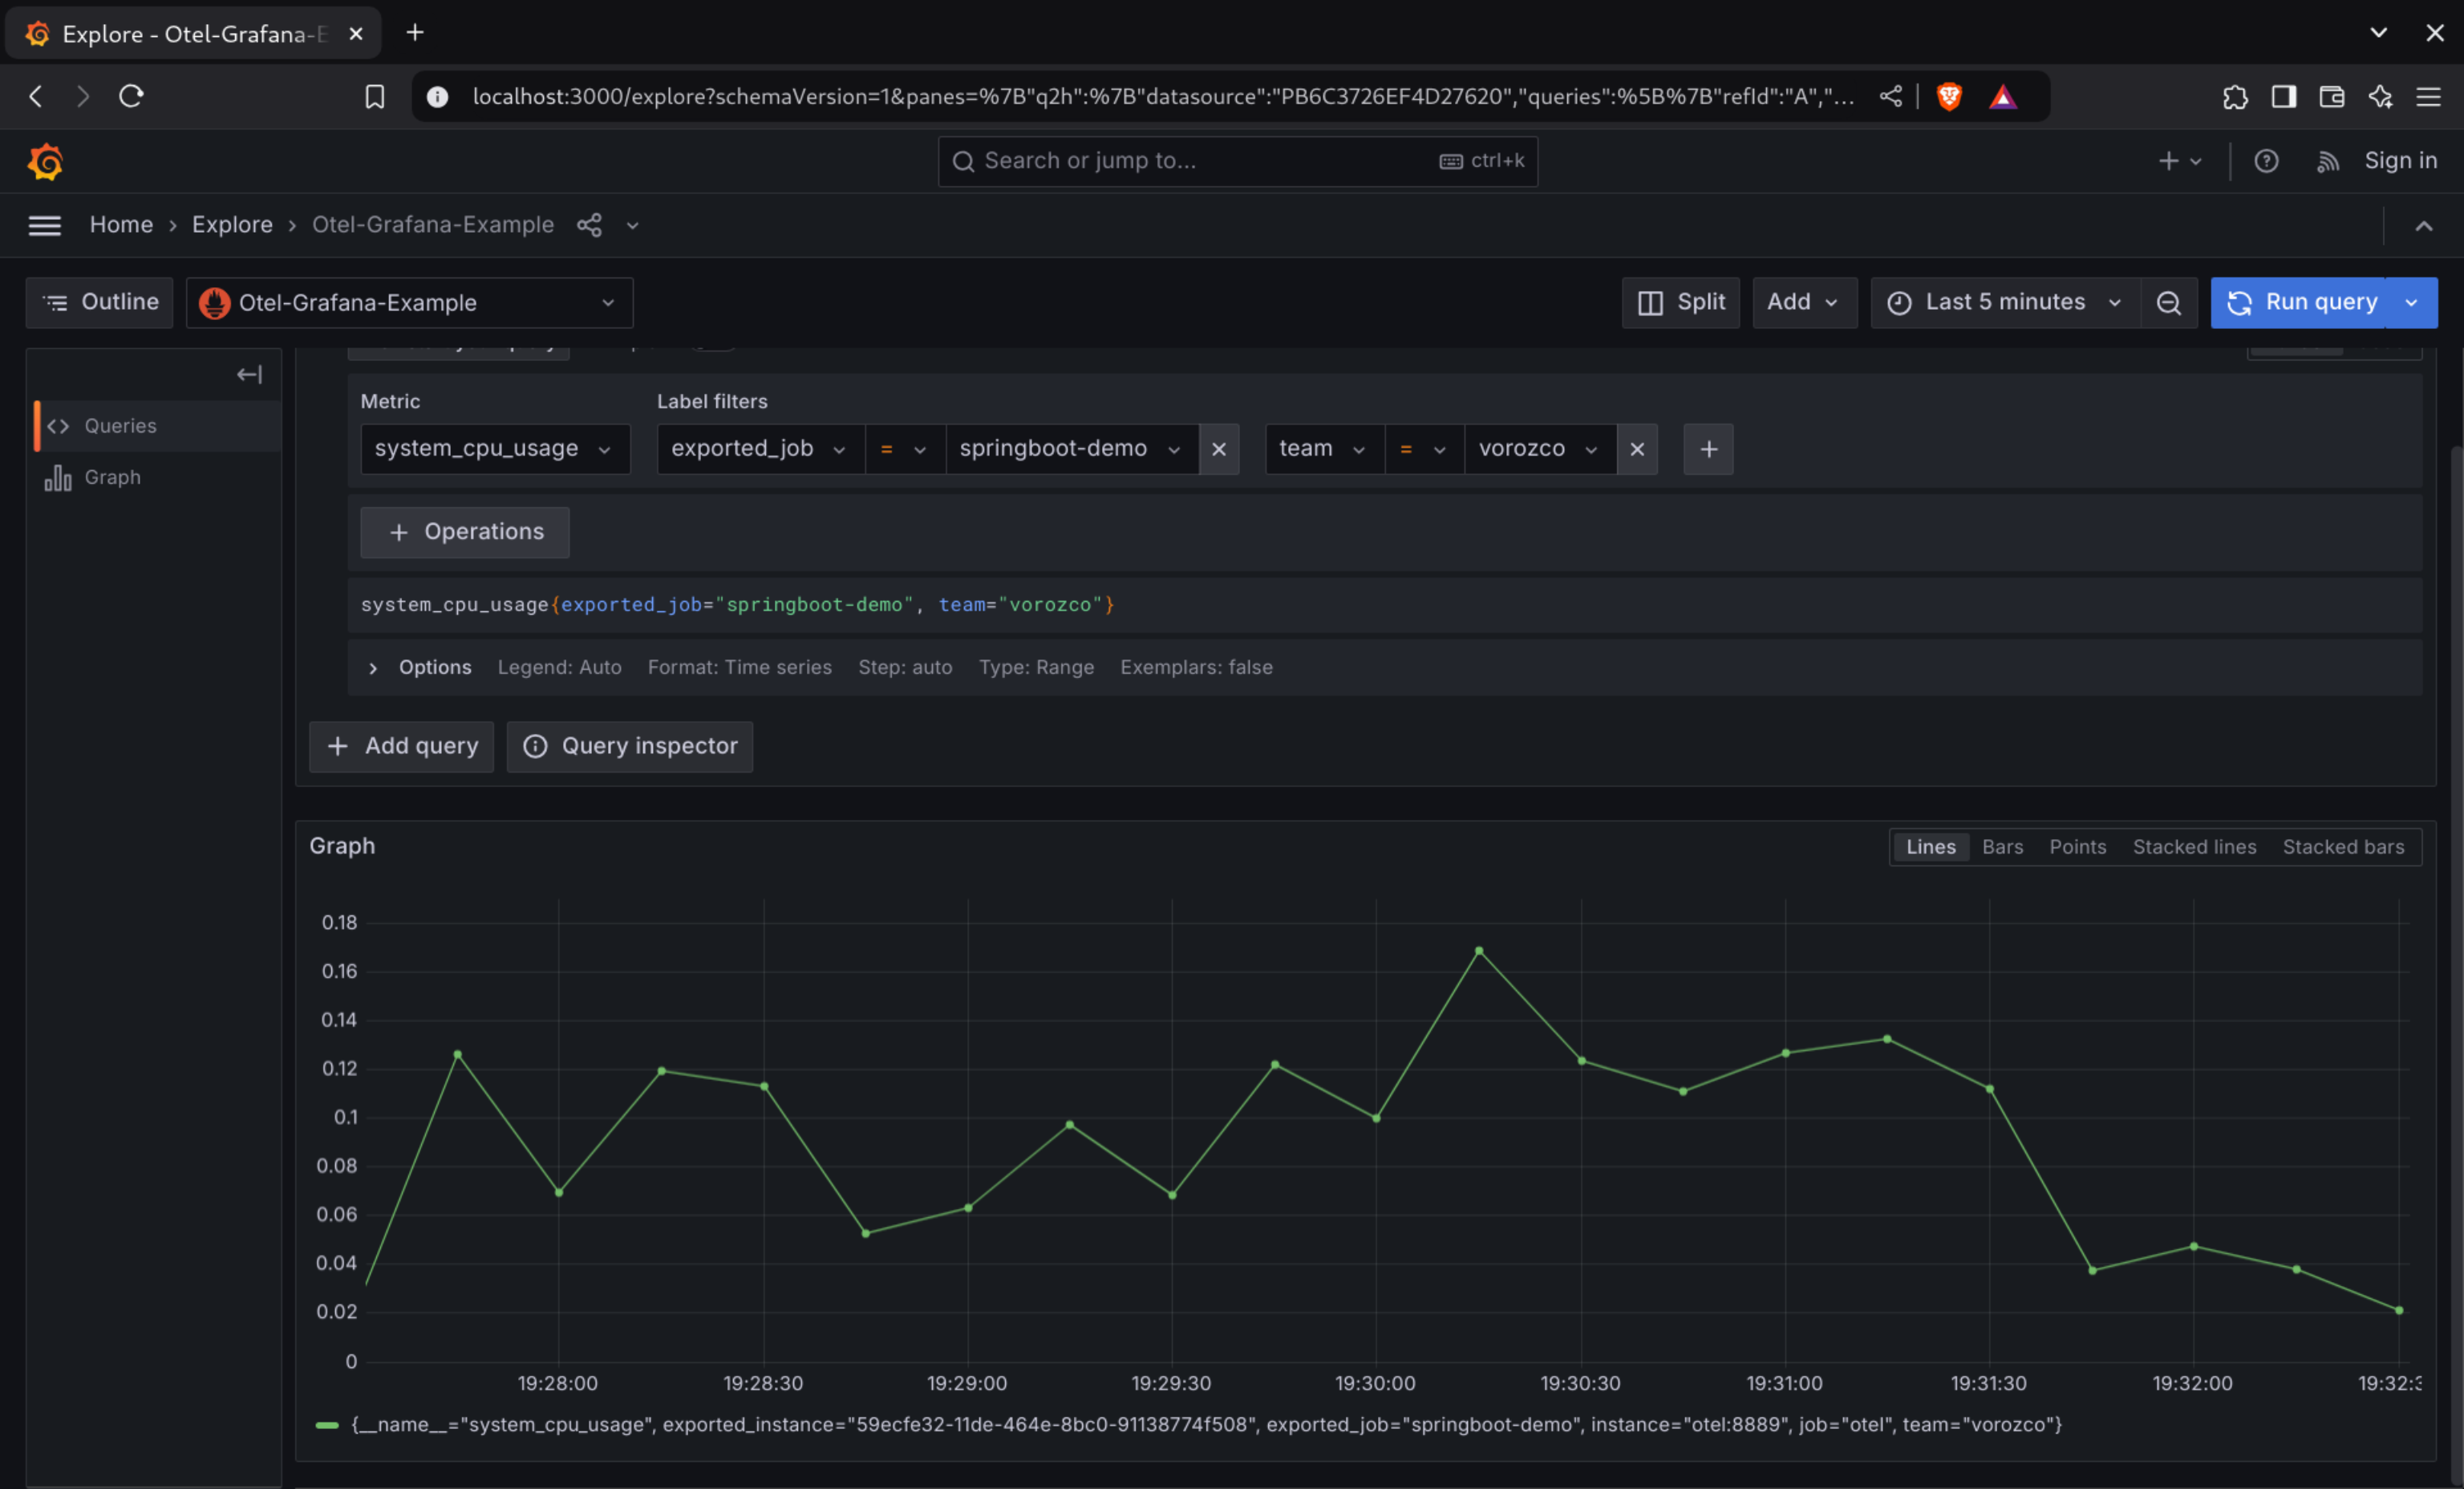
The quickest way to verify if the data is reported correctly is to verify directly in Grafana explore.
First, we can check some metrics like system_cpu_usage and filter by service name. In this case I used springboot-demo which has the CPU demo using naive fibonacci, I can even filter by my own tag (which was added by Otel processor):
In the same way, logs are already stored in Loki:

Finally, we could check the whole trace, including both services and interaction with H2 RDBMS:

Conclusion
In conclusion, implementing OpenTelemetry with Spring Boot provides a robust solution for observability, offering comprehensive insights through metrics, traces, and logs. By integrating tools like Prometheus, Grafana, Tempo, and Loki, you can easily monitor and troubleshoot your applications. Whether you choose OpenTelemetry's Spring Boot starter or Micrometer, both provide powerful instrumentation options, allowing you to gain deeper visibility and improve application performance.
Published at DZone with permission of Víctor Orozco. See the original article here.
Opinions expressed by DZone contributors are their own.
Comments