Monitor Docker Swarm and Other Logs Using Filebeat, Logstash, and AWS ES — Part 1
Learn how to set up Filebeat, Logstash, and Elasticsearch to monitor Docker Swarm logs to ensure reliable microservices architecture.
Join the DZone community and get the full member experience.
Join For FreeLogging microservices and monitoring their logs is quite a hectic job in microservice architecture, and if logs are not managed and monitored well, it can cause serious damage in production. Logging and monitoring are a critical requirement of microservice-based applications.
I couldn't find a simple and to-the-point document online explaining how can we easily configure Docker Swarm logs with Elasticsearch on AWS Cloud.
I tried various approaches e.g. send logs to Cloudwatch and integrate it with AWS ES but could not get success with Cloudwatch. Finally decided to go with Logstash.
Logstash is really a nice tool to capture logs from various inputs and send it to one or more Output stream. So I decided to use Logstash, Filebeat to send Docker swarm and other file logs to AWS Elastic Search to monitor. There are two scenarios to send logs which are explained in the next section.
Scenarios
Scenario 1
Send Docker Swarm logs to Logstash using Filebeat.
Send Jenkins logs to Logstash using Filebeat.
Logstash forwards the logs to the Elasticsearch domain.
Send Docker Swarm logs directly to AWS Elasticsearch using Filebeat.
Send Jenkins logs to AWS Elasticsearch using Logstash.
Scenario 2 is explained in the next article.
Let's Start!
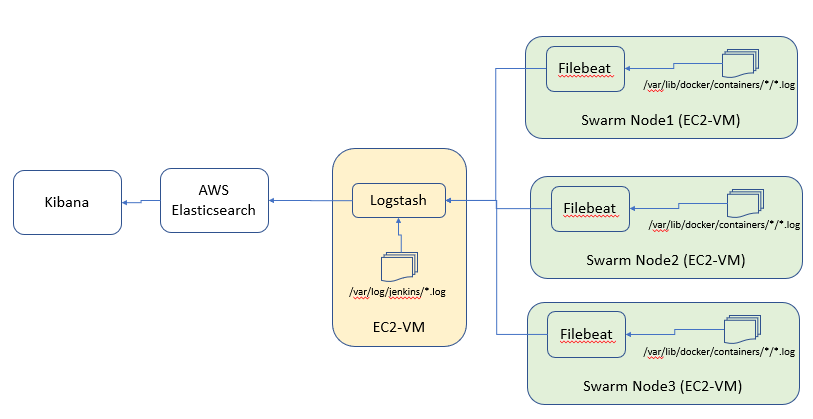
Scenario 1 ->
Send Docker Swarm logs to Logstash using Filebeat.
Send Jenkins logs to Logstash using Filebeat.
Logstash forwards the logs to the Elasticsearch domain.
The design below shows the flow of Scenario 1.
Assumptions
Java 8 is installed on the node where you will install Logstash. Preferably, install oracle-jdk instead of open-jdk.
Jenkins is running on the same node where Logstash is going to be installed. It doesn't matter which method you follow to install Jenkins.
You have Docker Swarm cluster setup to read container logs.
You already have created AWS Elasticsearch Domain and have the URL to access AWS ES and Kibana.
Installing Logstash
First, install Logstash on Ubuntu 16.04, but before installing Logstash, you must ensure that Java is installed on the machine. To verify it, you can try this command:
java -versionThe output will look something like this:
java version "1.8.0_171"
Java(TM) SE Runtime Environment (build 1.8.0_171-b11)
Java HotSpot(TM) 64-Bit Server VM (build 25.171-b11, mixed mode)
Now, install Logstash. There are multiple ways of installing Logstash, but here, I assume that you have installed it with the apt-get command. Here are the steps to install Logstash:
Download and install the Public Signing Key:
wget -qO - https://artifacts.elastic.co/GPG-KEY-elasticsearch | sudo apt-key add -You may need to install the apt-transport-https package on Debian before proceeding:
sudo apt-get install apt-transport-httpsSave the repository definition to /etc/apt/sources.list.d/elastic-6.x.list:
echo "deb https://artifacts.elastic.co/packages/6.x/apt stable main" | sudo tee -a /etc/apt/sources.list.d/elastic-6.x.listNow, install Logstash:
sudo apt-get update && sudo apt-get install logstashYou can use systemctl logstash start | stop | restart to manage Logstash as a service.
Create your configuration files (.conf) and put them into "/etc/logstash/conf.d."
Installing Filebeat on All Docker Swarm Nodes
To send Docker Swarm logs from the nodes, install Filebeat on every node.
curl -L -O https://artifacts.elastic.co/downloads/beats/filebeat/filebeat-6.4.0-amd64.deb
sudo dpkg -i filebeat-6.4.0-amd64.deb
Logstash Configuration With AWS ES
Note: I assume that you have created AWS ES Domain.
Logstash will need an AWS ES hostname to send the logs to. The AWS ES domain dashboard looks like the image below.
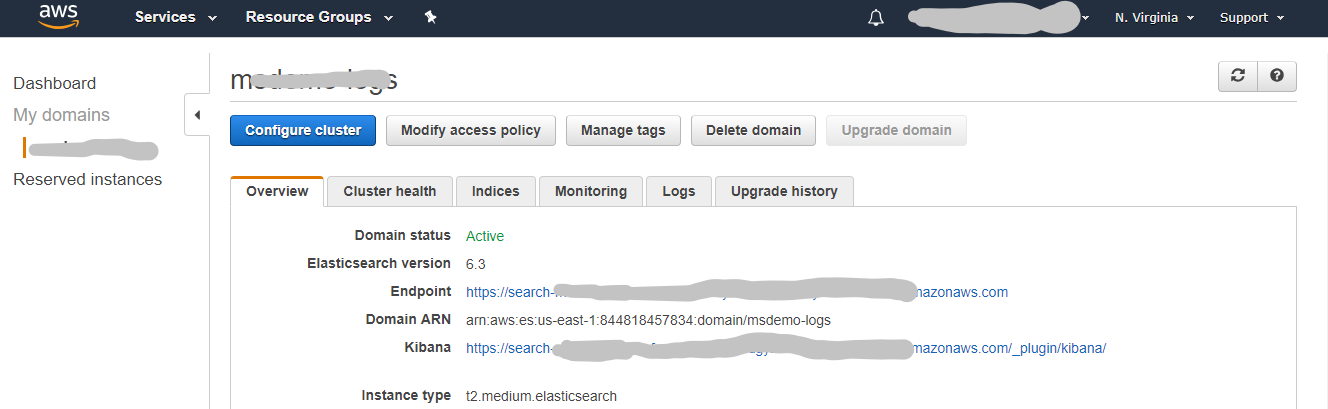
Hostnames are hidden in the above image for AWS ES Endpoint and Kibana.
Let's assume that you have configured AWS ES Domain and the endpoint URL is given below:
AWS-Elastic Search Endpoint URL:
https://search-domainname-xksdfsdkjhfifwsffssuire.us-east-1.es.amazonaws.com
Logstash Configuration
A simple Logstash config file format:
input{
...
}

fileter{
...
}
output{
...
}
As per the scenario, we need to configure two input streams; one will receive logs from filebeat and the other from file.
Note: You will see the "type" variable within the input context. It has no use here in the input section, but it will be used in the output.
logstash.conf
input {
  beats {
        port => 5044
        type => "beats"
    }
  file{
        path => "/var/log/jenkins/jenkins.log"
        type => "jenkins"
   }
}
In this example, logs are sent straight to the Elasticsearch. You can see the "type" variable in the "if" conditions. It's the same variable declared in the input section. These "if" conditions send log messages to the given "index."
In Elasticsearch, these indexes will be used to search log messages.
output {
  if [type] == "jenkins" {
    amazon_es{
          hosts => ["search-domainname-xksdfsdkjhfifwsffssuire.us-east-1.es.amazonaws.com"]
          region => "us-east-1"
          index => "jenkins-logs-%{+YYYY.MM.dd}"
      #aws_access_key_id => <aws_access_key_id>
      #aws_secret_access_key => <aws_secret_access_key>
     }
   }

   if [type] == "beats" {
      amazon_es{
          hosts => ["search-domainname-xksdfsdkjhfifwsffssuire.us-east-1.es.amazonaws.com"]
          region => "us-east-1"
          index => "filebeats-%{+YYYY.MM.dd}"
          #aws_access_key_id => <aws_access_key_id>
          #aws_secret_access_key => <aws_secret_access_key>
      }
   }
}
You can protect Elasticsearch access for authorized users only. If there is a user who has the IAM role with permission to access AWS ES, you can configure "aws_access_key_id" and "aws_secret_access_key" with the output stream.
I have not used any security. This is done only for documentation and demo purposes and NOT recommended for any environment (dev/UAT/prod).
Below is the complete configuration for Logstash. You can place this file inside the /etc/logstash/conf.d/ folder.
input {
  beats {
        port => 5044
        type => "beats"
    }
  file{
        path => "/var/log/jenkins/jenkins.log"
        type => "jenkins"
   }
}

#filter {
#    grok {
#        match => { "source" => "%{GREEDYDATA}/%{GREEDYDATA:app}.log" }
#    }
#}

output {

  if [type] == "jenkins" {
    amazon_es{
          hosts => ["search-domainname-xksdfsdkjhfifwsffssuire.us-east-1.es.amazonaws.com"]
          region => "us-east-1"
          index => "jenkins-logs-%{+YYYY.MM.dd}"
      #aws_access_key_id => <aws_access_key_id>
      #aws_secret_access_key => <aws_secret_access_key>
     }
  }

  if [type] == "beats" {
     amazon_es{
          hosts => ["search-domainname-xksdfsdkjhfifwsffssuire.us-east-1.es.amazonaws.com"]
          region => "us-east-1"
          index => "filebeats-%{+YYYY.MM.dd}"
      #aws_access_key_id => <aws_access_key_id>
      #aws_secret_access_key => <aws_secret_access_key>
     }
  }
}
Install the amazon_es Plugin
Logstash needs to install a plugin to be able to connect to AWS ES. By default, it doesn't allow you to connect. Run the below commands to install the amazon_es plugin.
cd /usr/share/logstash/
sudo bin/logstash-plugin install logstash-output-amazon_es
Restart Logstash.
sudo systemctl restart logstashFilebeat Configuration to Forward Logs to Logstash
The configuration at filebeat is very easy.
Open filebeat.yml, available on the /etc/filebeat/ path, and ensure that your filebeat.yml configuration matches the one given below. There is no need to configure Elasticsearch or Kibana at this point:
filebeat.prospectors:
- type: log
  enabled: true
  paths:
    - '/var/lib/docker/containers/*/*.log'
  json.message_key: log
  json.keys_under_root: true
  processors:
   - add_docker_metadata: ~

output.logstash:
  hosts: [logstash-host-or-ip:5044]
Restart the Filebeat service:
sudo systemctl restart filebeatEnsure that Logstash port 5044 or any other port which you have configured has its firewall open to accept logs from Filebeat.
That's it. You should see indexes (configured in the Logstash configuration file) created in the Kibana dashboard.
Learn about monitoring in Scenario 2 in Part 2 of this tutorial.
Opinions expressed by DZone contributors are their own.
Comments