Centralized and Externalized Logging Architecture for Modern Applications Using Rack Scale Flash Storage
This article takes a look at a wide variety of logging solutions that scatter various files across a server.
Join the DZone community and get the full member experience.
Join For Free
“We are a log Management Company that happens to Stream Videos”
-Netflix Chief Architect
Logging architecture is an important part of application health and performance monitoring in the modern distributed application architecture world. Hyper-scale deployment and automation solely depend on logging information to determine the status or behavior of applications, infrastructure, and networks.
In other use cases such as analytics, anomaly and threat detection are some of the use cases where logging is of the utmost importance to monitor safety and reliability of the service.
Whether applications are running in a public cloud or on-premise, logging is the way to understand the intricacies of modern complex systems. We have come a long way from the Client/Server application paradigm and into modern scalable distributed and containerized application development and deployment. The rapid advancement in technology stack, hardware, and networking has given rise to a new way of monitoring and alerting systems using the data.
Application developers tend to rely on application logging to troubleshoot and diagnose a variety of issues. The application logs do not tell the whole story as to why something went wrong or to determine the cause. There are a wide variety of logging solutions that scatter various files across a server. If you don’t examine all of them, you may lose important insight into your application and server health. Below is a list of each type of log file and their purpose.
System Logging
Operating systems produce a system log file that tracks log entries across a variety of devices, services, and operating system modules. They are often used to monitor the health of an individual server’s operations as well as for security auditing.
Web (Server) Access Logging
Every web request received by a web server will result in an access entry that includes the IP address of the client, agent software, URL requested, and resulting response code based on success or failure when processing the request.
Application Logging
Applications often log informational, warning, error, and critical log entries. Informational entries are often related to startup and shutdown, general execution requests and times, or configuration settings. Application logs provide insight into the operational status of an application and are a primary indicator of server failures due to bugs, heavy server load, or missing network resources.
Database Logging
Databases generate log files that are important for monitoring: a general query log, slow query log, and error log. Resource status, load on the database, QPS, and other important KPIs.
Event Logging
Events may originate from various sources: client-side browsers, server-side applications, APIs, and third-party systems. These events inform your application and your staff about the types of interactions your application is servicing. Event logging is often the most difficult to track, as it originates from so many different sources. Tools like Google Analytics are often used by web developers to capture discrete user interactions. Extracting events from these various streams are important to understanding the overall application health, security auditing, and compliance.
Let us look at the general architecture for centralized logging.

Diagram 1
In the above diagram 1, Server1 and Server2 are running a variety of applications and services, which produce logs in very different formats. The agent Shipper, which is installed on each server node, facilitates shipping of the logs to a central location for storage, analysis, monitoring, and alerting.
Tools such as ELK stack, fluentd, Apache Kafka, Splunk, and many other technologies are wired together to orchestrate the log movement, indexing, and storage.
In the distributed tech stack, we have potentially 100s of nodes and attached storage media, where applications instances in each node log data to attached disk and shipper agentship the log lines.
There are inherent challenges in this type of architecture. Let us look at some of the challenges.
Challenges in the Agent-Based Rack Scale Architecture
The challenges associated with agent-based logging in rack scale architecture are listed below:
- Installing, configuring, and maintaining the agent software in each node (Shipper)
- The agent software steals the CPU cycles to stream, write and ship the log lines
- Limited IOPS and Bandwidth within the nodes (node may be running more than one app)
- If the decision is made to change the agent, you need to orchestrate the install, configure the new agent software across ‘n’ number of nodes in a DC
- During the agent software upgrade/maintenance tasks, log lines are not available for monitoring
- Running out of disk space, which calls for Log management schemes such as Log rotation and retention, which limit data locality.
- All logs are scattered across nodes in the case of back pressure, there is no alternative to pump the logs lines out of the node without additional CPU cycles.
- Administration overhead is created due to the fact that the amount of storage is fixed inside each node.
The Traditional Rack Scale Architecture with Direct-Attached Storage (DAS) Compute Nodes
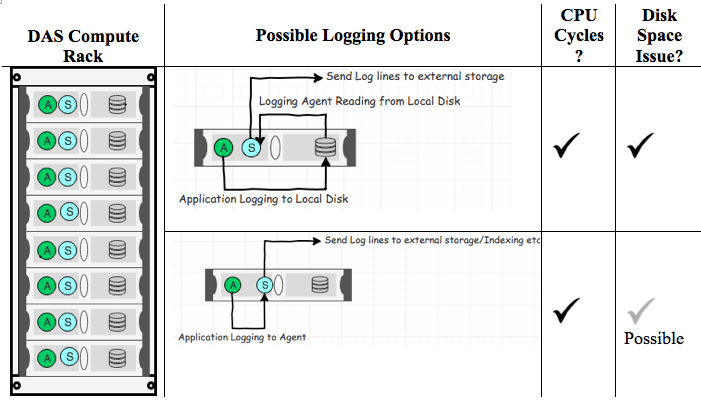
Diagram 2
In the above Diagram 2, CPU cycles are spent running the shipping agent and to perform log forwarding. The shipping agent consumes memory as well. The memory and CPU cycles are very crucial in both database and containerized environments. In database environments, data management and synchronization operations need to run. In Container environments (CaaS), microservices or application instances need to run and leverage CPU and memory resources. Let us look at externalized log forwarding and other related activities.
Externalize the Logging
In order to alleviate issues highlighted above related to logging architecture, it is recommended to use shared storage for Centralized and Externalized Logging Architecture for Modern Rack Scale Applications.
The following Diagram shows an application rack with Shared NVMe Flash Storage. The benefits of this architecture are highlighted in the list to the right.
Diagram 3.
Some of the advantages as shown in diagram 3:
- Leverage higher-density compute racks by separating storage hardware from compute nodes
- Improve Utilization of Disk Space due to thin provisioning
- Dynamically expand disk space as needed
- Write logs directly to high-performance, low-latency external shared storage
- Replace/Remove nodes without data loss
- Easily scale compute nodes on demand
- No more agent software to maintain, as logs are written directly to the shared volume.
- Save on CPU cycles
- Use REST API interfaces to manage the volume and automate operations
- Isolate the logs from other production application storage volumes and minimize exposure of sensitive data and access.
- Create instant copies of all databases and logs for backup and test/dev purposes
The above design in diagram 3 shows the same rack having dense compute nodes with disaggregated high performance shared storage. The Flash Array will present a volume to each compute node to write logs. The capacity of the array (up to 1 Petabyte) is available in the formats such as zone-based setup, zone-based log retention and purge can be managed.
Add a dedicated compute node with log forwarder agent software to ship the log lines for further indexing, processing, and storage, where the UI dashboard plugs into the indexed stored data to produce dashboard with system KPIs. Let us look at some application-specific examples of the reference architecture.
Reference Architecture
Cassandra Setup for Central and Externalized Logging
Let us consider the standard 3 node Cassandra ring. The standard setup has the cache, sstables and commit logs stored at /var/lib/cassandra/data/* and logs are stored in /var/log/cassandra/*.log.
It is recommended that for a production setup, you must use a separate disk (SSD) and possibly the network ports in order to avoid resource contention when writing to commit logs, SSTABLES, and saved_cache.
The shared storage system can be used to host all of the Cassandra data and logs on a single platform shared across the entire Cassandra cluster.
The following diagram 4 explains how it is done using Shared Flash storage.
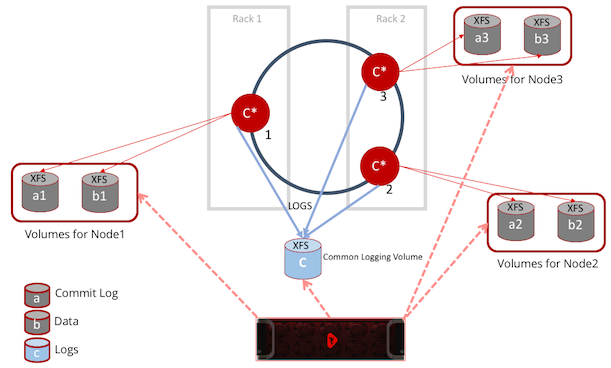
Diagram 4
As you see in the above diagram 4, there is a "C" common logging volume, where each node can write logs in a different folder under a common root folder, like /var/log/cassandra/nodeX/*.log
Shipping the logs to an enterprise monitoring systems such as Splunk or ELK Stack can be accomplished. The forwarder node can be the indexer and stores the indexed data back to a volume in the shared storage system.
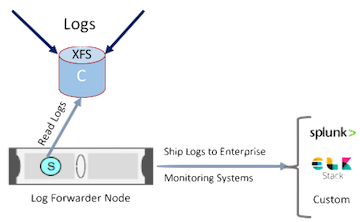
An alternative solution is to index the log data back into shared storage as shown below:
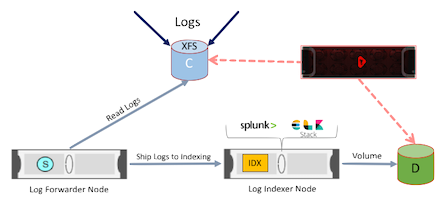
The same reference architecture applies to MongoDB and other applications as well.
Logging in Containerized World
In a containerized world, as we all know, applications (microservices) and databases run on multiple hosts to fulfill a single business requirement. We might need to talk to multiple services running on different machines. So, the log messages generated by microservices are distributed across multiple hosts. Servers may be created and destroyed in the matter of weeks, days, hours, or perhaps even minutes. This means that log files may be written and then destroyed before any significant analysis may be performed on them. It also makes analysis, auditing, and troubleshooting more difficult as Real scale applications are commonly distributed across a variety of servers and tiers. Centralizing and Externalizing the logging becomes too important in a containerized implementations in Enterprise.
The NVMe-over-Fabrics high-performance flash storage system with high IOPS (in the order of 20 Million) and bandwidth (in 100's GB) in a form factor that can easily fit in a rack and eliminate the need for DAS SSDs. Utilizing the power of the shared storage, modern applications, and databases minimize the infrastructure sprawl and leverage high-speed shared storage to address the growing needs of log-based analytics with speed.
Opinions expressed by DZone contributors are their own.

Comments