Chaos Engineering: Simulating OutOfMemoryError
This 'java.lang.OutOfMemoryError: Java Heap space' will be thrown by the application when the application generates more objects than the allocated heap size.
Join the DZone community and get the full member experience.
Join For FreeIn the series of chaos engineering articles, we have been learning to simulate various performance problems. In this post, let’s discuss how to simulate 'java.lang.OutOfMemoryError: Java Heap space' problem. This 'java.lang.OutOfMemoryError: Java Heap space' will be thrown by the application when the application generates more objects than the allocated heap size.
Sample Program
Here is a sample program from the open-source BuggyApp application, which would generate 'java.lang.OutOfMemoryError: Java Heap space' problem.
package com.buggyapp.memoryleak; import java.util.HashMap; public class OOMDemo {static HashMap<Object, Object> myMap = new HashMap<>();public static void start() throws Exception {while (true) {myMap.put("key" + counter, "Large stringgggggggggggggggggggggggggggg"+ "ggggggggggggggggggggggggggggggggggggggggggggggggggggg"+ "ggggggggggggggggggggggggggggggggggggggggggggggggggggg"+ "ggggggggggggggggggggggggggggggggggggggggggggggggggggg"+ "ggggggggggggggggggggggggggggggggggggggggggggggggggggg"+ "ggggggggggggggggggggggggggggggggggggggggggggggggggggg"+ "ggggggggggggggggggggggggggggggggggggggggggggggggggggg"+ "ggggggggggggggggggggggggggggggggggggggggggggggggggggg"+ "ggggggggggggggggggggggggggggggggggggggggggggggggggggg"+ "ggggggggggggggggggggggggggggggggggggggggggggggggggggg"+ "ggggggggggggggggggggggggggggggggggggggggggggggggggggg"+ "ggggggggggggggggggggggggggggggggggggggggggggggggggggg"+ counter);++counter;}}}
Sample Java program contains an 'OOMDemo' class. This class contains the 'start()' method. This method keeps inserting records into the HashMap infinitely. When HashMap goes beyond maximum heap size (i.e. -Xmx) then 'java.lang.OutOfMemoryError: Java Heap space' will be thrown. The below diagram illustrates the records present in the HashMap:
Fig: HashMap causing OutOfMemoryError
Execution
We executed the above sample program in the following environment:
a. AWS 't3a.medium' EC2 instance.
b. Used OpenJDK 1.8.0_265, 64-Bit Server VM.
c. Heap size (i.e., -Xmx) was set to 512MB.
When we executed the above program, as expected below mentioned 'java.lang.OutOfMemoryError: Java heap space' was thrown in few seconds:
java.lang.OutOfMemoryError: Java heap spaceat java.util.Arrays.copyOf(Arrays.java:3332)at java.lang.AbstractStringBuilder.ensureCapacityInternal(AbstractStringBuilder.java:124)at java.lang.AbstractStringBuilder.append(AbstractStringBuilder.java:700)at java.lang.StringBuilder.append(StringBuilder.java:214)at com.buggyapp.memoryleak.OOMDemo.start(OOMDemo.java:21)at com.buggyapp.LaunchPad.main(LaunchPad.java:49)at com.buggyapp.servlet.LaunchBuggyAppServlet$BuggyAppThread.run(LaunchBuggyAppServlet.java:155)
Even though this is a hypothetical example that simulates ‘java.lang.OutOfMemoryError’, this is how a typical memory leak happens in enterprise applications. When records get inserted into a data structure (like HashMap, ArrayList, Set, etc), and they don’t get removed, OutOfMemoryError will be thrown.
How to Diagnose OutOfMemoryError?
You can diagnose OutOfMemoryError either through a manual or automated approach.
Manual Approach
In the manual approach, you need to capture heap dump as the first step. A heap dump is a snapshot of memory, which shows all the objects in memory, values contained by those objects, and their references. You can capture heap dump using one of the 7 approaches given here. But an important criteria is: You need to capture the heap dump right before OutOfMemoryError is thrown. If you are going to capture a heap dump after OutOfMemoryError has occurred, then leaking objects can get garbage collected, and it will become hard (or even impossible) to diagnose the problem. Once heap dumps are captured, you need to import the heap dumps from your production servers to your local machine. From your local machine, you can use heap dump analysis tools like jHat, HeapHero to analyze the heap dumps.
Automated Approach
You can use root cause analysis tools like yCrash — which automatically captures application-level data (thread dump, heap dump, Garbage Collection log) and system-level data (netstat, vmstat, iostat, top, top -H, dmesg,…). Besides capturing the data automatically, it marries these two datasets and generates an instant root cause analysis report. Below is the report generated by the yCrash tool when the above sample program is executed:
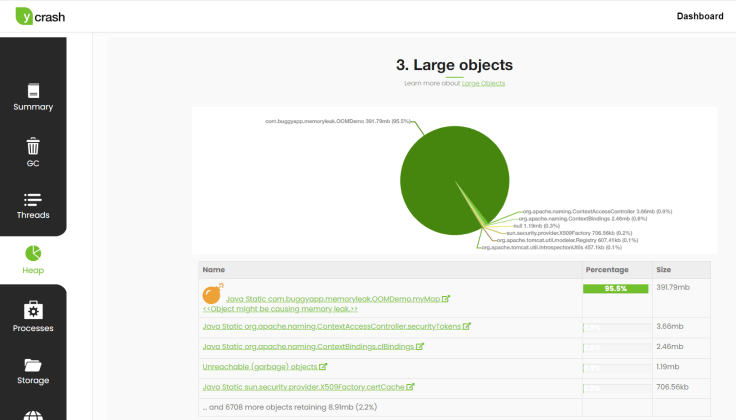
Fig: yCrash tool pointing out the root cause of OutOfMemoryError.
You can notice the yCrash tool precisely pointing out the HashMap (i.e., myMap) data structure present in the ‘com.buggyapp.memoryleak.OOMDemo’ to be the root cause of memory leak. The tool is reporting that this HashMap is holding 95.5% of memory.
Opinions expressed by DZone contributors are their own.
Comments