Client-side server monitoring with Jolokia and JMX
Join the DZone community and get the full member experience.
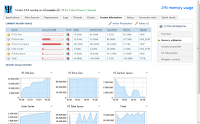
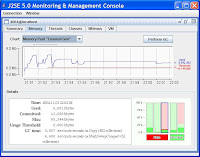
Join For FreeThe choice of Java monitoring tools is tremendous (random selection and order powered by Google):
| javamelody |  |
| psi-probe | 
|
| JVisualVM | 
|
| jconsole | 
|
| JAMon |  |
| Java JMX Nagios Plugin | N/A |
Besides, there are various dedicated tools e.g. for ActiveMQ, JBoss, Quartz scheduler, Tomcat/tcServer... So which one should you use as an ultimate monitoring dashboard? Well, none of them provide out-of-the-box features you might require. In some applications you have to constantly monitor the contents and size of a given JMS queue. Others are known to have memory or CPU problems. I have also seen software where system administrators had to constantly run some SQL query and check the results or even parse the logs to make sure some essential background process is running. Possibilities are endless, because it really depends on the software and its use-cases. To make matters worse, your customer doesn't care about GC activity, number of open JDBC connections and whether this nasty batch process is not hanging. It should just work.
In this post we will try to develop easy, cheap, but yet powerful management console. It will be built around the idea of a single binary result – it works or not. If this single health indicator is green, no need to go deeper. But! If it turned red, we can easily drill-down. It is possible because instead of showing hundreds of unrelated metrics we will group them in a tree-like structure. The health status of each node in a tree is as bad as the worst child. This way if anything bad happens with our application, it will bubble-up.
We are not forcing system administrator to constantly monitor several metrics. We decide what is important and if even tiniest piece of our software is malfunctioning, it will pop-up. Compare this to a continuous integration server that does not have green/red builds and e-mail notifications. Instead you have to go to the server every other build and manually check whether the code is compiling and all tests were green. The logs and results are there, but why parse them and aggregate manually? This is what we are trying to avoid in our home-grown monitoring solution.
As a foundation I have chosen (not for the first time) Jolokia JMX to HTTP bridge. JVM already provides the monitoring infrastructure so why reinvent it? Also thanks to Jolokia the whole dashboard can be implemented in JavaScript on the client side. This has several advantages: server footprint is minimal, also it allows us to rapidly tune metrics by adding them or changing alert thresholds.
We'll start by downloading various JMX metrics onto the client (browser). I have developed some small application for demonstration purposes employing as many technologies as possible – Tomcat, Spring, Hibernate, ActiveMQ, Quartz, etc. I am not using the built-in JavaScript client library for Jolokia as I found it a bit cumbersome. But as you can see it is just a matter of a single AJAX call to fetch great deal of metrics.
function request() {
    var mbeans = [
        "java.lang:type=Memory",
        "java.lang:type=MemoryPool,name=Code Cache",
        "java.lang:type=MemoryPool,name=PS Eden Space",
        "java.lang:type=MemoryPool,name=PS Old Gen",
        "java.lang:type=MemoryPool,name=PS Perm Gen",
        "java.lang:type=MemoryPool,name=PS Survivor Space",
        "java.lang:type=OperatingSystem",
        "java.lang:type=Runtime",
        "java.lang:type=Threading",
        'Catalina:name="http-bio-8080",type=ThreadPool',
        'Catalina:type=GlobalRequestProcessor,name="http-bio-8080"',
        'Catalina:type=Manager,context=/jmx-dashboard,host=localhost',
        'org.hibernate:type=Statistics,application=jmx-dashboard',
        "net.sf.ehcache:type=CacheStatistics,CacheManager=jmx-dashboard,name=org.hibernate.cache.StandardQueryCache",
        "net.sf.ehcache:type=CacheStatistics,CacheManager=jmx-dashboard,name=org.hibernate.cache.UpdateTimestampsCache",
        "quartz:type=QuartzScheduler,name=schedulerFactory,instance=NON_CLUSTERED",
        'org.apache.activemq:BrokerName=localhost,Type=Queue,Destination=requests',
        "com.blogspot.nurkiewicz.spring:name=dataSource,type=ManagedBasicDataSource"
    ];
    return _.map(mbeans, function(mbean) {
        return {
            type:'read',
            mbean: mbean
        }
    });
}

$.ajax({
    url: 'jmx?ignoreErrors=true',
    type: "POST",
    dataType: "json",
    data: JSON.stringify(request()),
    contentType: "application/json",
    success: function(response) {
      displayRawData(response);
    }
});
Just to give you an overview what kind of information is accessible on the client side, we will first dump everything and display it on jQuery UI accordion:
function displayRawData(fullResponse) {
  _(fullResponse).each(function (response) {
    var content = $('<pre/>').append(JSON.stringify(response.value, null, '\t'));
    var header = $('<h3/>').append($("<a/>", {href:'#'}).append(response.request.mbean));
    $('#rawDataPanel').
        append(header).
        append($('<div/>').append(content));
  });
  $('#rawDataPanel').accordion({autoHeight: false, collapsible: true});
}
Remember that this is just for reference and debug purposes, we are not aiming to display endless list of JMX attributes.
As you can see it is actually possible to implement complete jconsole port inside a browser with Jolokia and JavaScript... maybe next time (anyone care to help?). Back to our project, let's pick few essential metrics and display them in a list:
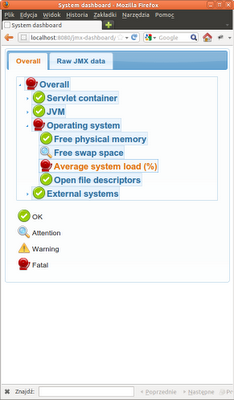
The list itself looks very promising. Instead of displaying charts or values I have assigned an icon to each metric (more on that later). But I don't want to go through the whole list all the time. Why can't I just have a single indicator that aggregates several metrics? Since we are already using jsTree, the transition is relatively simple:
On the first screenshot you see a healthy system. There is really no need to drill down since Overall metric is green. However the situation is worse on the second screenshot. System load is alarmingly high, also the Swap space
needs attention, but is less important. As you can see the former
metrics bubbles up all the way to the overall, top metric. This way we
can easily discover what is working incorrectly in our system. You might
be wondering how did we achieved this pretty tree while at the
beginning we only had raw JMX data? No magic here, see how am I
constructing the tree:
function buildTreeModel(jmx) {
  return new CompositeNode('Overall', [
    new CompositeNode('Servlet container', [
      new Node(
          'Active HTTP sessions',
          jmx['Catalina:context=/jmx-dashboard,host=localhost,type=Manager'].activeSessions,
          Node.threshold(200, 300, 500)
      ),
      new Node(
          'HTTP sessions create rate',
          jmx['Catalina:context=/jmx-dashboard,host=localhost,type=Manager'].sessionCreateRate,
          Node.threshold(5, 10, 50)
      ),
      new Node(
          'Rejected HTTP sessions',
          jmx['Catalina:context=/jmx-dashboard,host=localhost,type=Manager'].rejectedSessions,
          Node.threshold(1, 5, 10)
      ),
      new Node(
          'Busy worker threads count',
          jmx['Catalina:name="http-bio-8080",type=ThreadPool'].currentThreadsBusy,
          Node.relativeThreshold(0.85, 0.9, 0.95, jmx['Catalina:name="http-bio-8080",type=ThreadPool'].maxThreads)
      )
    ]),
    //...
    new CompositeNode('External systems', [
      new CompositeNode('Persistence', [
        new Node(
            'Active database connections',
            jmx['com.blogspot.nurkiewicz.spring:name=dataSource,type=ManagedBasicDataSource'].NumActive,
            Node.relativeThreshold(0.75, 0.85, 0.95, jmx['com.blogspot.nurkiewicz.spring:name=dataSource,type=ManagedBasicDataSource'].MaxActive)
        )
      ]),
      new CompositeNode('JMS messaging broker', [
        new Node(
            'Waiting in "requests" queue',
            jmx['org.apache.activemq:BrokerName=localhost,Destination=requests,Type=Queue'].QueueSize,
            Node.threshold(2, 5, 10)
        ),
        new Node(
            'Number of consumers',
            jmx['org.apache.activemq:BrokerName=localhost,Destination=requests,Type=Queue'].ConsumerCount,
            Node.threshold(0.2, 0.1, 0)
        )
      ])
    ])
  ]);
}
The tree model is quite simple. Root node can have a list of child nodes. Every child node can be either a leaf representing a single evaluated JMX metric or a composite node representing set of grandchildren. Each grandchild can in turns be a leaf or yet another composite node. Yes, it is a simple example of Composite design pattern! However it is not obvious where Strategy pattern was used. Look closer, each leaf node object has three properties: label (what you see on the screen), value (single JMX metric) and an odd function Node.threshold(200, 300, 500)... What is it? It is actually a higher order function (function returning a function) used later to interpret JMX metric. Remember, the raw value is meaningless, it has to be interpreted and translated into good-looking icon indicator. Here is how this implementation works:
Node.threshold = function(attention, warning, fatal) {
    if(attention > warning && warning > fatal) {
      return function(value) {
        if(value > attention) { return 1.0; }
        if(value > warning) { return 0.5; }
        if(value > fatal) { return 0.0; } else { return -1.0; }
      }
    }
    if(attention < warning && warning < fatal) {
      return function(value) {
        if(value < attention) { return 1.0; }
        if(value < warning) { return 0.5; }
        if(value < fatal) { return 0.0; } else { return -1.0; }
      }
    }
    throw new Error("All thresholds should either be increasing or decreasing: " + attention + ", " + warning + ", " + fatal);
  }
Now it becomes clear. The function receives level thresholds and returns
a function that translates them to number in -1:1 range. I could have
returned icons directly but I wanted to abstract tree model from GUI
representation. If you now go back to Node.threshold(200, 300, 500) example of Active HTTP sessions metric it is finally obvious: if the number of active HTTP sessions exceed 200, show attention icon instead of OK. If it exceeds 300, warning appears. Above 500 fatal icon will appear. This function is a strategy that understands the input and handles it somehow.
Of course these values/functions are only examples, but this is where
real hard work manifests – for each JMX metric you have to define a set
of sane thresholds. Is 500 HTTP sessions a disaster or only a high load
we can deal with? Is 90% CPU load problematic or maybe if it is really
low we should start worrying? Once you fine-tune these levels it should
no longer be required to monitor everything at the same time. Just look
at the top level single metric. If it is green, have a break. If
it is not, drill-down in few seconds to find what the real problem is.
Simple and effective. And did I mention it does not require any changes
on the server side (except adding Jolokia and mapping it to some URL)?
Obviously this is just a small proof-of-concept, not a complete
monitoring solution. However if you are interested in trying it out and
improving, the whole source code is available - as always on my GitHub account.
From http://nurkiewicz.blogspot.com/2012/02/client-side-server-monitoring-with.html
Opinions expressed by DZone contributors are their own.


Comments