Code Analysis With Gradle Plugins
Code Analysis is usually done as the last step (if done at all) in most projects. It is usually hard to configure and integrate it with the existing code. This article aims to outline the steps (and the ease of it) to integrate PMD and FindBugs with Gradle, and integrate these with an existing Sonar build tool.
Join the DZone community and get the full member experience.
Join For FreeCode Analysis is usually done as the last step (if done at all) in most projects. It is usually hard to configure and integrate it with the existing code.
This article aims to outline the steps (and the ease of it) to integrate PMD and FindBugs with Gradle, and integrate these with an existing Sonar build tool.
PMD, CheckStyle, and FindBugs
The first thing we need to add is the plugins in our build.gradle file:
apply plugin: 'checkstyle'
apply plugin: 'pmd'
apply plugin: 'findbugs'
These plugins enable PMD, CheckStyle, and FindBugs in our code.
By default, these tasks execute on both the Test and Main source code. For us to exclude FindBugs, and PMD from running on the test code, we include the following commands:
findbugs{
    findbugsTest.enabled=false
}
pmd {
    pmdTest.enabled=false
}
Next, we execute this from Gradle:
./gradlew clean findBugsMain pmdMainThis cleans out the project and then executes FindBugs and PMD on the source code.
The output is as below:
:clean
:compileJava
Note: Some input files use unchecked or unsafe operations.
Note: Recompile with -Xlint:unchecked for details.
:processResources
:classes
:findbugsMain FAILED

FAILURE: Build failed with an exception.

* What went wrong:
Execution failed for task ':findbugsMain'.
> FindBugs rule violations were found. See the report at: file:///myprojects/build/reports/findbugs/main.xml

* Try:
Run with --stacktrace option to get the stack trace. Run with --info or --debug option to get more log output.

BUILD FAILED

Total time: 24.597 secs
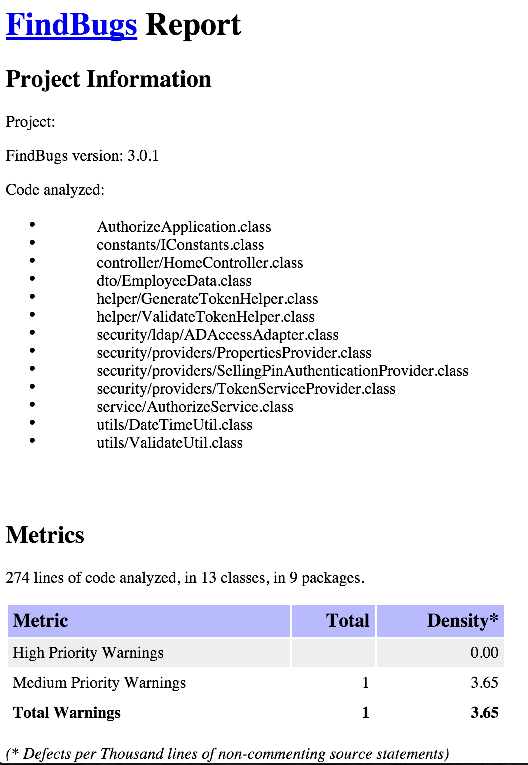
The build failed even without executing the PMD, since there are FindBugs violations. The output of the FindBugs and PMD are in XML.
The report can be found at <proj_home>/build/reports directory
In order to have a human readable HTML output and continue the build on failure, we make the following changes to the build.gradle file:
findbugs{
    ignoreFailures=true
    findbugsTest.enabled=false

}

tasks.withType(FindBugs) {
    reports {
        xml.enabled = false
        html.enabled = true
    }
}
tasks.withType(Pmd){
    reports{
        xml.enabled=true
        html.enabled=true
    }
}
pmd {
   ignoreFailures = true
    pmdTest.enabled=false
}
The task.withType is used to configure each of the tasks. In this, you are enabling the HTML and XML reports for PMD and HTML for FindBugs.
Note: At the time of writing, FindBugs only support one enabled output
./gradlew clean findBugsMain pmdMain
:clean
:compileJava
Note: Some input files use unchecked or unsafe operations.
Note: Recompile with -Xlint:unchecked for details.
:processResources
:classes
:findbugsMain
FindBugs rule violations were found. See the report at: file:///myprojects/build/reports/findbugs/main.html
:pmdMain
Removed misconfigured rule: LoosePackageCoupling  cause: No packages or classes specified
Removed misconfigured rule: LoosePackageCoupling  cause: No packages or classes specified
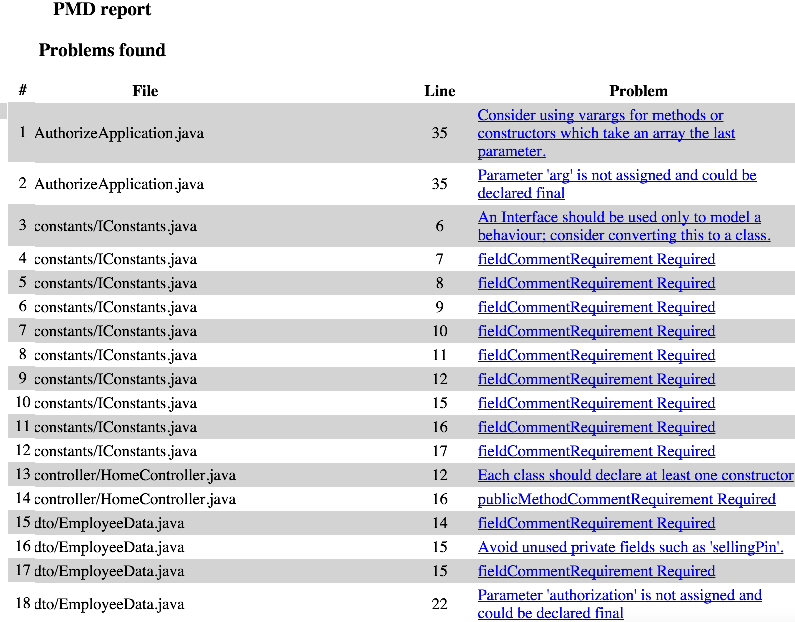
174 PMD rule violations were found. See the report at: file:///myprojects/build/reports/pmd/main.html

BUILD SUCCESSFUL

Total time: 6.013 secs
For PMD, you can configure the rulesets using the ruleSet option. Following are some of the commonly used rulesets.
pmd {
   ignoreFailures = true
    pmdTest.enabled=false
    ruleSets = [
            'java-basic',
            'java-braces',
            'java-clone',
            'java-codesize',
            'java-comments',
            'java-controversial',
            'java-coupling',
            'java-design',
            'java-empty',
            'java-finalizers',
            'java-imports',
            'java-optimizations',
            'java-strictexception',
            'java-strings',
            'java-typeresolution',
            'java-unnecessary',
            'java-unusedcode'
    ]
}
A sample output would be as below:


Sonar Integration
PMD, Checkstyle, and Sonar are all useful tools. However, from an organization prespective, we need to track the changes to the project's code quality and technical debt over a period of time. We need to be able to measure against other similar teams.
In order to do this, Sonar is used. This article assumes that you have a working Sonar setup.
Altassian provides the Sonar plugin for this. In order to use this, we add the necessary plugin.
buildscript {
    repositories {
        mavenCentral()
        maven { url "http://mvnrepo.nordstrom.net/nexus/content/groups/public" }
        maven { url "http://repo.maven.apache.org/maven2" }
    }
    dependencies {
        classpath "org.sonarsource.scanner.gradle:sonarqube-gradle-plugin:1.2"
    }

}
Once the build script is setup, we configure the sonarqube:
apply plugin: "org.sonarqube"

sonarqube{
    check
    properties {
        // Sonar Specific properties
        property 'sonar.projectName', 'Project Services' // This is the display project name
        property 'sonar.host.url','http://sonar:8080/' // This is the Sonar Server
        property 'sonar.projectKey', 'com.wordpress.mrvivekr:project' // The Key using which the project details are tracked

       // JDBC Properties
        property 'sonar.jdbc.url','jdbc:jtds:sqlserver://ABCD:1433/SonarDB;domain=MYCOMP;SelectMethod=Cursor'

        property 'sonar.jdbc.username','userName'
        property 'sonar.jdbc.password','Secr#%'

      //Which Sonar Profile to use - this is optional
        property 'sonar.profile','JavaProfile'
    }
}Note: sonar.profile is the pre-configured sonar profile (and rules) that is set up by your company. This is not mandatory and is optional. My JDBC connection uses a SQLServer to connect to
./gradlew sonarqube:compileJava UP-TO-DATE
:processResources UP-TO-DATE
:classes UP-TO-DATE
:compileTestJava
:processTestResources
:testClasses
:test
....... ommitted .....
11:27:36.713 INFO - Java Main Files AST scan done: 812 ms
11:27:36.714 INFO - 13/13 source files have been analyzed
11:27:36.715 INFO - Java bytecode scan...
11:27:36.762 INFO - Java bytecode scan done: 47 ms
11:27:36.762 INFO - Java Test Files AST scan...
11:27:36.762 INFO - 5 source files to be analyzed
11:27:36.885 INFO - Java Test Files AST scan done: 123 ms
11:27:36.885 INFO - 5/5 source files have been analyzed
11:27:36.888 INFO - Package design analysis...
11:27:39.868 INFO - Package design analysis done: 2980 ms
11:27:39.884 INFO - Sensor JavaSquidSensor (done) | time=4307ms
11:27:39.884 INFO - Sensor Lines Sensor
11:27:39.888 INFO - Sensor Lines Sensor (done) | time=4ms
11:27:39.888 INFO - Sensor QProfileSensor
11:27:39.891 INFO - Sensor QProfileSensor (done) | time=3ms
11:27:39.891 INFO - Sensor InitialOpenIssuesSensor
11:27:45.592 INFO - Sensor InitialOpenIssuesSensor (done) | time=5701ms
11:27:45.592 INFO - Sensor ProjectLinksSensor
11:27:45.730 INFO - Sensor ProjectLinksSensor (done) | time=138ms
11:27:45.730 INFO - Sensor VersionEventsSensor
11:27:47.690 INFO - Sensor VersionEventsSensor (done) | time=1960ms
11:27:47.690 INFO - Sensor org.sonar.plugins.findbugs.FindbugsSensor@7894f007
11:27:47.694 INFO - Execute Findbugs 3.0.1...
11:27:48.557 INFO - Found findbugs plugin: /myprojects/build/sonar/findbugs/fb-contrib.jar
11:27:48.596 INFO - Found findbugs plugin: /myprojects/build/sonar/findbugs/findsecbugs-plugin.jar
11:27:48.612 INFO - Findbugs output report: /myprojects/build/sonar/findbugs-result.xml
The following classes needed for analysis were missing:
javax.crypto.spec.SecretKeySpec
11:27:50.846 INFO - Execute Findbugs 3.0.1 done: 3153 ms
11:29:31.499 INFO - Sensor org.sonar.plugins.findbugs.FindbugsSensor@7894f007 (done) | time=103809ms
11:29:31.499 INFO - Sensor SurefireSensor
11:29:31.500 INFO - parsing /myprojects/build/test-results
11:29:31.558 INFO - Sensor SurefireSensor (done) | time=59ms
11:29:31.558 INFO - Sensor JaCoCoOverallSensor
11:29:31.565 WARN - You are not using the latest JaCoCo binary format version, please consider upgrading to latest JaCoCo version.
11:29:31.565 INFO - Analysing /myprojects/build/jacoco/test.exec
11:29:31.601 WARN - You are not using the latest JaCoCo binary format version, please consider upgrading to latest JaCoCo version.
......... Ommitted .............
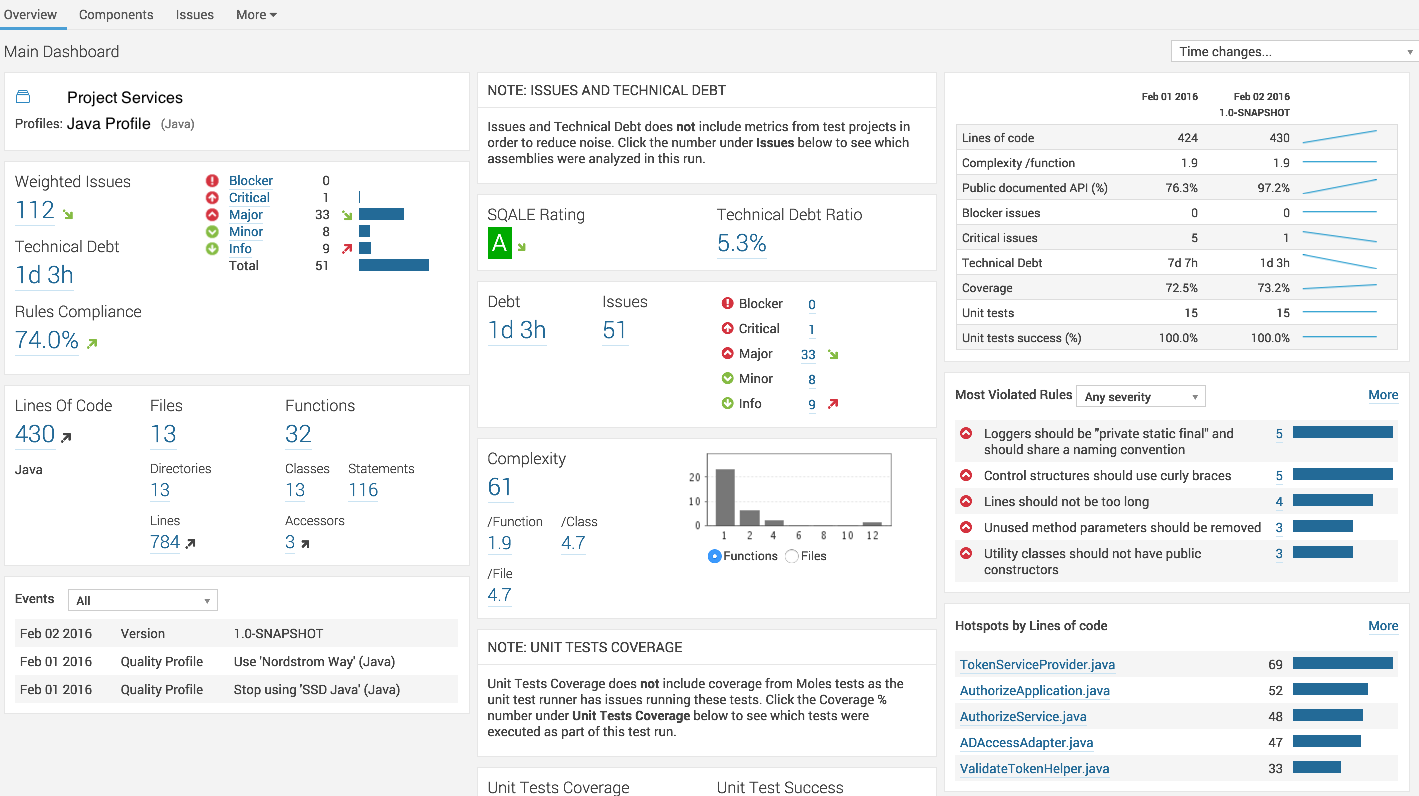
11:30:38.654 INFO - ANALYSIS SUCCESSFUL, you can browse http://sonar:8080/dashboard/index/com.wordpress.mrvivekr:project
11:30:38.654 INFO - Note that you will be able to access the updated dashboard once the server has processed the submitted analysis report.
11:30:38.655 INFO - Executing post-job class org.sonar.plugins.buildbreaker.AlertBreaker
11:30:38.657 INFO - Executing post-job class org.sonar.plugins.buildbreaker.ForbiddenConfigurationBreaker
BUILD SUCCESSFUL
Total time: 5 mins 16.499 secs
You should see a similar output:

Happy Code Analysis!
Opinions expressed by DZone contributors are their own.

Comments