

What 55 Runs Taught Me About Memory in AI Coding Agents
A controlled experiment examines how stored experience changes coding agents’ debugging paths, token usage, and investigation costs.
All 55 controlled runs passed the tests. On that measure, giving the agent memory made no difference. The differences showed up in the work it did before producing a passing patch: the files it read, the model calls it made, and the tokens it used.
I used a small coding agent and four Python repositories, giving it a short lesson from an earlier task in some runs and leaving that lesson out in others. I did not fine-tune the model. In the first 40 runs, the agent used fewer tokens with memory on two related tasks and more on an unrelated one. That looked like a relevance pattern until I ran 15 follow-up trials. On the same task, relevant and irrelevant memory produced exactly the same median token usage.
That result changed what I wanted to know about memory. I could see differences in how much work the agent did, but I could not explain them simply by saying the lesson was relevant. For anyone building a similar system, I think the useful question is what happens after a lesson enters the prompt, including how much the investigation costs. These runs are too limited to answer whether memory makes coding agents better in general.
Why I Tested Stored Experience
A developer rarely approaches every bug with a blank slate. Fix enough configuration problems and certain patterns become familiar. You learn where to look first, which assumptions deserve suspicion, and which mistakes tend to recur.
Coding agents do not necessarily get the same benefit from tasks they have already completed. An agent might successfully debug one repository, then meet a similar failure in another and investigate it almost from scratch.
I wanted to test a simple alternative. Instead of changing the model, I would preserve one lesson from an earlier debugging task and place it in the agent's context on a later task. The question was whether that small piece of experience would change how the agent investigated the repository.
The project was inspired by work on agents that accumulate and reuse experience while keeping the underlying model fixed. RSIAgent explores this idea in a much broader multi-agent setting. My experiment does not reproduce that system. It isolates one narrower mechanism: externally stored experience supplied as context during repository debugging.
How the Agent Received Memory
The memory in this experiment is not fine-tuning. The model parameters remain unchanged. It is also different from the temporary observations the agent collects while reading files or running tests during a single task.
Before the primary study, the agent solved a separate feature_flag repository. That task produced one general lesson: "Normalize external text input before interpreting it: trim surrounding whitespace, apply case folding, and then compare against the accepted tokens."
The lesson was stored in repo_memory.json. Memory runs included it in the prompt; no-memory runs did not. Everything else about the agent and task setup stayed the same.
That design gives memory an immediate cost. The lesson has to be sent to the model on every call in which it is included. If it does not change the agent's behavior, the best result we should expect is a small token penalty. If it does change the search, the savings or extra work can be larger than that mechanical prompt cost.
The Agent and the Debugging Tasks
I kept the coding agent deliberately small because I wanted to measure its behavior, not maximize benchmark performance. It can read known Python files, run the repository's configured tests, propose a fix to a known file, and stop. It does not have unrestricted shell access.
For each run, I recorded success, steps, files read, unique files read, repeated reads, test runs, LLM calls, input and output tokens, total tokens, and elapsed time.
Experimental environment:
| component | configuration |
|---|---|
|
Component |
Configuration |
|
Language |
Python 3.14.7 |
|
OpenAI Python package |
3.17.0 |
|
Model |
gpt-5.4-mini |
|
Inference |
Hosted API |
|
Fine-tuning |
None |
|
Primary runs |
40 |
|
Ablation runs |
15 |
|
Total controlled runs |
55 |
I used four small synthetic Python repositories so I could choose the bug in each one and how closely it related to the stored lesson. That made the comparisons easier to control. It also means the results tell us little about debugging a large production repository.
config_parser

def parse_boolean(value):
    value = value.strip().lower()

    if value:
        return True

    return False
This parser treats every non-empty string as true, including "false." The bug is closely related to the stored lesson about interpreting normalized text.
account_status

def is_active_status(value):
value = value.strip().lower()

if "active" in value:
return True

return False
The substring check accepts "inactive" because it contains "active." I made this task intentionally easy to see what memory cost when the agent could already find the fix quickly.
notification_service
This benchmark separated the visible symptom from the cause. Notifications were still being sent when configuration disabled them, but the faulty logic sat deeper in a parser reached through the settings path. The agent had to navigate several files before it could locate the bug.
order_report

for item in items[:-1]:
    subtotal += item["price"]
The slice excludes the last item, producing an incorrect subtotal. The configuration-parsing lesson has no obvious bearing on this bug, so I used order_report as a negative control.
What Changed in the First 40 Runs
Each benchmark was run five times with memory and five times without it. Before every run, the repository was reset to its original broken state. Condition order alternated by trial: odd-numbered trials ran no memory first, while even-numbered trials ran memory first.
All 40 runs passed the configured tests, so the success rate gave me no way to compare the conditions. I looked instead at how much work each run took. Each row in the table is the average of five runs. The Files column counts all file reads, including repeats.
| benchmark | condition | success | steps | files | llm calls | tokens | seconds |
|---|---|---|---|---|---|---|---|
|
account_status |
No memory |
100% |
2.00 |
1.00 |
3.00 |
819.0 |
3.997 |
|
account_status |
Memory |
100% |
2.00 |
1.00 |
3.00 |
877.8 |
4.136 |
|
config_parser |
No memory |
100% |
2.60 |
1.60 |
3.60 |
1095.6 |
4.899 |
|
config_parser |
Memory |
100% |
2.20 |
1.20 |
3.20 |
971.2 |
4.524 |
|
notification_service |
No memory |
100% |
4.60 |
3.60 |
5.60 |
2029.6 |
7.314 |
|
notification_service |
Memory |
100% |
3.80 |
2.80 |
4.80 |
1671.4 |
5.995 |
|
order_report |
No memory |
100% |
2.40 |
1.40 |
3.40 |
1019.2 |
3.909 |
|
order_report |
Memory |
100% |
3.40 |
2.40 |
4.40 |
1531.4 |
5.578 |
| benchmark | absolute change with memory | relative token change |
|---|---|---|
|
account_status |
+58.8 tokens; no change in steps/files/calls |
+7.2% |
|
config_parser |
-124.4 tokens; -0.4 steps; -0.4 files |
-11.4% |
|
notification_service |
-358.2 tokens; -0.8 steps; -0.8 files |
-17.6% |
|
order_report |
+512.2 tokens; +1.0 step; +1.0 file |
+50.3% |
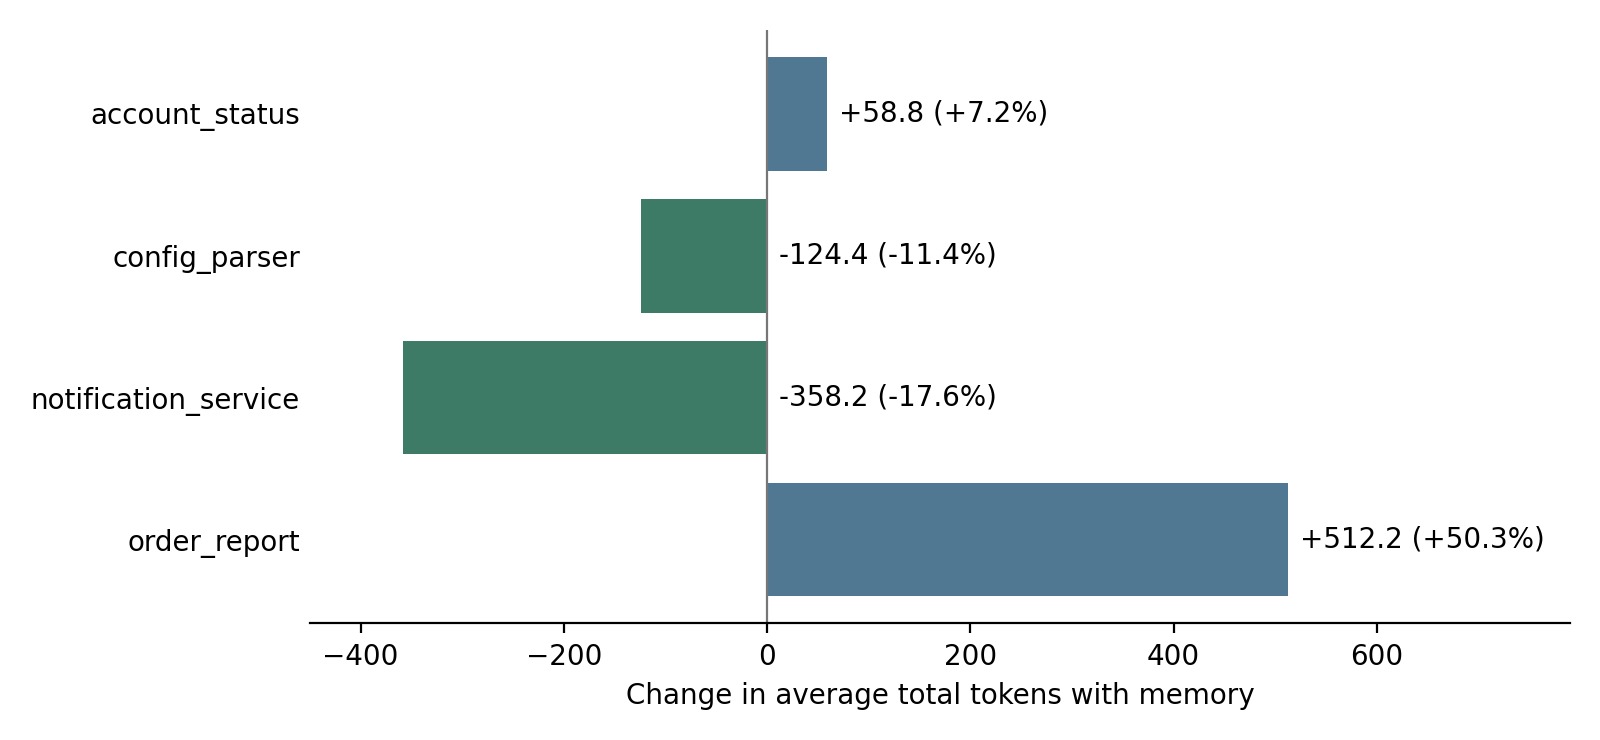
Figure 1. Absolute change in average total tokens with memory. Labels include the percentage change. Negative values indicate fewer tokens; each condition contains five runs.
The Easy-Task Baseline
account_status is useful because the measured action counts did not change. Both conditions averaged two steps, one file read, and three model calls. Token usage rose from 819.0 to 877.8, an increase of 58.8 tokens across the run.
My first explanation for those extra 58.8 tokens was the lesson itself being carried through three model calls. That fits the numbers, but I did not log its exact contribution on each call, so I cannot break the increase down precisely. The action counts were unchanged, which gives me no evidence here that memory changed the investigation route.
This is a cost I would include when evaluating a memory system. Even if the agent does the same amount of work, it still has to receive the extra context.
Where the Trajectories Changed
config_parser and notification_service moved in the other direction. On config_parser, memory saved 124.4 tokens on average and reduced both steps and file reads by 0.4. On notification_service, it saved 358.2 tokens, 0.8 steps, and 0.8 file reads.
The negative control went the opposite way. On order_report, the memory condition read one additional file on average, took one additional step, and used 512.2 more tokens. Saying that file reads increased by 71.4% is mathematically correct, but the absolute change from 1.4 to 2.4 files is more informative on such a small baseline.
At this point, I thought relevance might explain the pattern. The related lesson came with shorter investigations, and the unrelated lesson came with a longer one. But I was comparing different tasks. To check that explanation, I needed to give the same task different lessons.
Testing Whether Relevance Explained the Savings
The ablation used notification_service for all 15 runs. I compared no memory, the original text-processing lesson, and an unrelated collection-processing lesson: When processing collections of items, check that iteration includes every required element and does not accidentally skip the first or last item.
The three-condition order rotated across trials rather than remaining fixed. Each condition was repeated five times.
| condition | success | steps | files | llm calls | tokens | seconds |
|---|---|---|---|---|---|---|
|
No memory |
100% |
5.00 |
4.00 |
6.00 |
2254.2 |
7.835 |
|
Relevant memory |
100% |
4.20 |
3.20 |
5.20 |
1836.6 |
6.131 |
|
Irrelevant memory |
100% |
3.80 |
2.80 |
4.80 |
1666.6 |
5.934 |
I found it more useful to look at the five runs behind each mean:
No memory: 2311, 2274, 2299, 2286, 2101
Relevant memory: 1755, 1744, 2199, 1737, 1748
Irrelevant memory: 1344, 1749, 1743, 1749, 1748
| condition | mean tokens | median tokens | sample sd |
|---|---|---|---|
|
No memory |
2254.2 |
2286 |
86.8 |
|
Relevant memory |
1836.6 |
1748 |
202.7 |
|
Irrelevant memory |
1666.6 |
1748 |
180.4 |
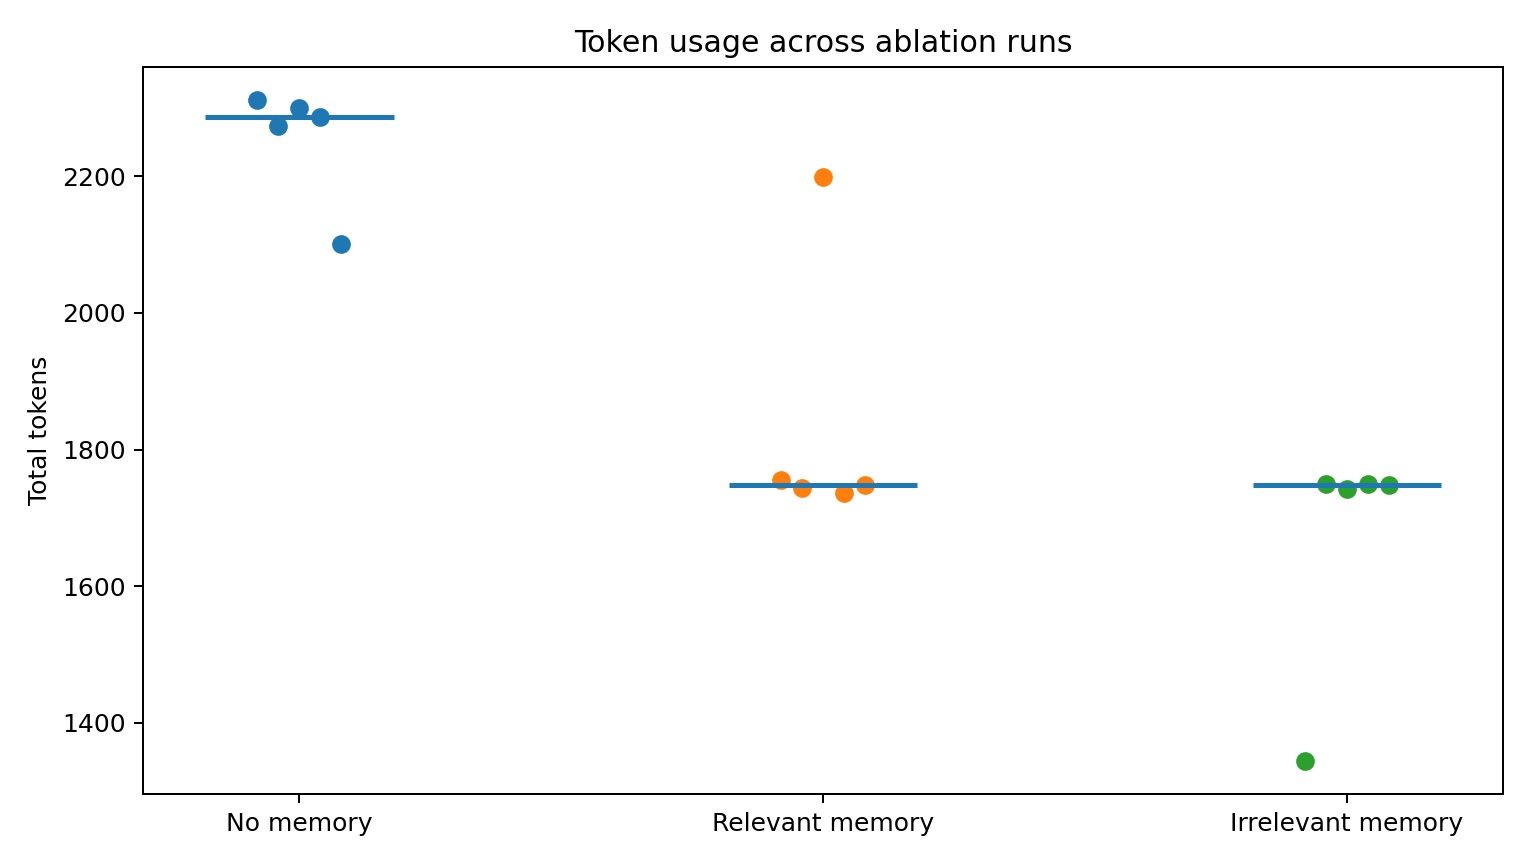
Figure 2. Total token usage for each ablation run. The short horizontal markers show the median. Relevant and irrelevant memory both have a median of 1,748 tokens.
The Baseline Moved Between Experiments
The follow-up also gave me a different no-memory baseline. That matters because I was using that baseline to judge how much memory was saved.
In the primary study, no-memory runs averaged 2,029.6 tokens. In the ablation, the same nominal condition averaged 2,254.2, an increase of 224.6 tokens, or about 11.1%, even though the agent and benchmark definition had not intentionally changed.
With only five runs, I would be cautious about treating any of these averages as a stable benchmark. The baseline moved by an amount comparable to some of the savings I had seen. I do not know what caused the change. In another experiment, I would rerun the controls with each new memory condition rather than rely on an average from an earlier batch.
There is an interesting symmetry on the other side as well. Primary notification_service with relevant memory averaged 1,671.4 tokens, while ablation notification_service with irrelevant memory averaged 1,666.6. Those means differ by only 4.8 tokens. That does not make the two conditions equivalent, because they came from separate batches, but it reinforces the central caution: the observed efficiency change cannot be cleanly attributed to semantic relevance.
What I Would Measure in a Memory System
If I were evaluating memory in another coding agent, I would keep the passing tests as one measure and pay more attention to the investigation that produced the patch.
In these runs, success rate hid the differences I was trying to understand. All 55 passed, but some took more file reads, model calls, and tokens to get there. I would record those counts, including repeated reads, so I could see whether a lesson actually reduced the work.
I would also include the cost of sending the lesson. On account_status, the agent took the same number of actions with memory and used more tokens. On the other tasks, the investigation changed enough for the total cost to move much further in either direction. Looking only at the length of the added lesson would have missed that.
The notification_service follow-up would also make me test several kinds of context before crediting relevance for an improvement. The relevant and irrelevant lessons had the same median token usage. Finding a lesson that seems appropriate is only the first step; I would still want to see what the agent does when it receives it.
There are limits to how far I can take these observations. I ran each condition only five times, used synthetic repositories, and tested one model configuration. Every task was also easy enough for all the runs to pass. Elapsed time needs extra caution because API latency contributes to it. I would not use these results to claim a mechanism or predict the outcome on harder repositories.
The Controls I Would Add Next
Next, I would add comparisons that help separate the content of a lesson from the influence of simply adding more context.
The most obvious missing control is the mirror image of the existing ablation: give order_report a lesson that is genuinely relevant to its collection-processing bug, then compare that with the irrelevant text-parsing lesson and no memory. That would test whether order_report's extra investigation was specific to irrelevant memory or whether any added experience context tends to perturb that task.
I would also add a neutral context condition matched approximately for length, increase the number of repetitions, and record trajectory categories directly. Instead of inferring a short path from token clusters, the analysis could count which files were read, in what order, and how many runs followed each distinct route.
A later version should move to harder, real repository tasks. SWE-bench is relevant here because it evaluates patches against real GitHub issues and repository tests. I would not jump immediately to the full benchmark, but a carefully selected subset would better test whether experience transfers when repositories are larger and the search space is less controlled.
Finally, I would make retrieval itself part of the experiment. A realistic agent will not have one hand-selected memory. It will have a library of past experiences and must decide which, if any, belong in the current context.
How I Would Evaluate Memory Now
I started with a fairly straightforward expectation: a lesson from a related bug should help the agent find the next fix with less investigation. Some of the primary results matched that expectation. The follow-up made me less confident in the explanation, because the unrelated lesson also came with lower token usage, and the no-memory baseline had changed.
For now, I would test each lesson I put into the prompt rather than assume it earns its place there. It adds tokens and may change where the agent looks. I would compare runs with that lesson against runs with no memory, an irrelevant lesson, and neutral context, checking both whether the patch passes and how much work it takes. I would want those comparisons before deciding which lessons to include in a memory system.
I still want to know when a stored lesson is worth sending to the agent. This pilot gave me a way to examine that question, but it did not settle it. The next useful evidence would be a record of how the agent uses the lesson during its investigation, alongside the final test result.
Reproducibility and Resources
The controlled evidence consists of 40 primary runs and 15 ablation runs. Earlier developmental runs were preserved separately and excluded from the reported study. The primary dataset was frozen before the ablation began.
Repository: https://github.com/martinsonogu/agent-memory-lab
Primary dataset: results/repo_results.jsonl
Ablation dataset: results/ablation_results.jsonl
Primary analysis: analyze_results.py
Ablation analysis: analyze_ablation.py
Opinions expressed by DZone contributors are their own.