Correlations Made Easy
In this article, we will check out in more detail correlations and how to identify the correlation coefficient between given variables.
Join the DZone community and get the full member experience.
Join For FreePrelude
In the connected world, the internet and social networks give an additional push to generate humongous data. There is no such great challenge to store all the data that was generated, and one can leverage the latest advancements in terms of storing data. The real challenge is to understand and identify the possibility to correlate this data and draw meaningful insights. In this article, we will check out in more detail correlations and how to identify the correlation coefficient between given variables.
Data Analytics
Data Analytics plays a key role in deep diving into data, identifying trends, discovering data patterns, and extracting value out of data. Here, I would like to give a real-time example instead of regular correlation examples (sales of umbrellas during rainstorms and sales of ice cream during summer). The two variables we consider here to correlate are:
- Life Expectancy
- Public Health Care Expenditure % of GDP
We are analyzing data sets from “Our World in Data” the “life expectancy” of individuals in a country is correlated to “Public Health Care Expenditure % of GDP” or not.
There are four different types of analytics, and we just try to understand them with the same example in simple statements.
1. Descriptive Analytics: “What happened?”
- What is life expectancy in a specific continent or country?
- How much government expenditure on healthcare as a percent of gross domestic product (GDP) is spent?
2. Diagnostic Analytics: “What could be the root cause?”
- Why the life expectancy in some countries is very low?
- Is there a correlation between life expectancy and government spending on public health?
- Identifying data patterns and correlations is key as part of Diagnostic Analytics.
3. Predictive Analytics: “What might possibly happen in the future?”
- What will be the life expectancy of a specific country in the next two years?
- What percentage of the amount will be spent in the next five years of time?
4. Prescriptive Analytics: “What are the possible action items?”
- Whether to start a program globally that can help countries to focus on healthcare as a priority or a program to collaborate with NGOs to develop local health facilities.
Diagnostic Analytics — Correlation Analysis
Let’s talk about correlation analysis in a bit more detail on how it is used to identify the strength of correlation between two different variables.
The two different variables we are considering here:
- Public Health Care Expenditure % of GDP (2019 — “Our World in Data”) — Independent Variable
- Life Expectancy (2019 — “Our World in Data”) — Dependent Variable
We will identify if the dependent variable is changing as the value changes in independent variables.
The correlation coefficient (r) is calculated to identify the strength of the given two variables.
Correlation is identified based on the r value:
- r towards 1: Positive Correlation
- r towards -1: Negative Correlation
- r towards 0: No Correlation
Sample data for a few countries and aggregation values for 52 countries:
| Country 2019 | Public Health Care Expenditure % of GDP - X |
Life expectancy 2019 - Y |
X * X |
Y * Y |
X * Y |
Argentina |
5.954 |
77.3 |
35.45012 |
5975.29 |
460.2442 |
Australia |
7.361 |
83.1 |
54.18432 |
6905.61 |
611.6991 |
Austria |
7.865 |
81.9 |
61.85823 |
6707.61 |
644.1435 |
Belgium |
8.107 |
81.8 |
65.72345 |
6691.24 |
663.1526 |
Brazil |
3.93 |
75.3 |
15.4449 |
5670.09 |
295.929 |
Bulgaria |
4.295 |
75.1 |
18.44703 |
5640.01 |
322.5545 |
Canada |
7.641 |
82.4 |
58.38488 |
6789.76 |
629.6184 |
Chile |
5.656 |
80.3 |
31.99034 |
6448.09 |
454.1768 |
China |
3.002 |
78 |
9.012004 |
6084 |
234.156 |
Colombia |
6.284 |
76.8 |
39.48866 |
5898.24 |
482.6112 |
Costa Rica |
5.339 |
79.4 |
28.50492 |
6304.36 |
423.9166 |
Croatia |
5.579 |
78.7 |
31.12524 |
6193.69 |
439.0673 |
Cyprus |
3.857 |
81.4 |
14.87645 |
6625.96 |
313.9598 |
Czechia |
6.463 |
79.2 |
41.77037 |
6272.64 |
511.8696 |
Denmark |
8.473 |
81.4 |
71.79173 |
6625.96 |
689.7022 |
Estonia |
5.081 |
78.7 |
25.81656 |
6193.69 |
399.8747 |
Finland |
7.136 |
81.9 |
50.9225 |
6707.61 |
584.4384 |
France |
9.273 |
82.7 |
85.98853 |
6839.29 |
766.8771 |
Germany |
9.827 |
81.6 |
96.56993 |
6658.56 |
801.8832 |
Total for all 52 Countries |
312.279 |
4141.4 |
2125.139 |
330504.1 |
25103.71 |
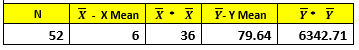 We have all the required X and Y values available to quantify the correlation r value between the given two variables.
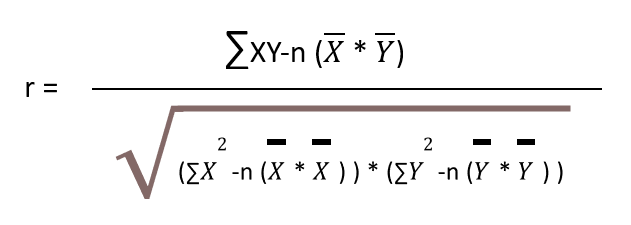
There are several different types to calculate the correlation coefficient (ex: Pearson, Rank, Intra-class, etc..).
In this article, we will use the Pearson Correlation coefficient.
Pearson Correlation Coefficient Formulae
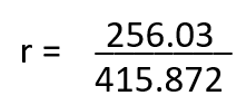
r = 0.61564
Result of r, which is towards 1 and says the given 2 variables have a positive correlation. In the same way, we can quantify the correlation between any given two variables. It’s not only about identifying correlations but visualizing them with proper storytelling plays a key role in decision-making.
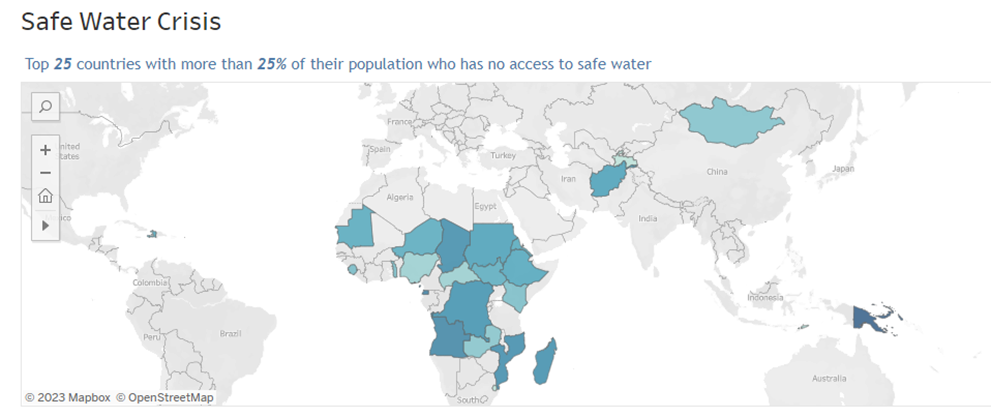
Let us see another example where we can visualize two different variables.
- Life Expectancy
- No. of people having access to safe water
Here, we not only quantify the correlation between having access to safe water and the life expectancy of the population in any country, but we also visualize those correlations. Visualizations were created using Tableau.
Visualize
Life Expectancy:

The complete interactive dashboard can be accessed here.
Correlation Analysis plays a vital role as part of Diagnostic Analysis. Pearson Correlation is widely used to identify and quantify the correlation between given two variables.
Opinions expressed by DZone contributors are their own.
Comments