CPU-Based Pod Auto-Scaling in Kubernetes
This article demonstrates and explains how different types of autoscaling work and goes in-depth with horizontal autoscaling with visualizations.
Join the DZone community and get the full member experience.
Join For Free
The auto-scaling allows us to optimally allocate the resource to an application based its current resource consumption.
Kubernetes offers three main types of autoscaling:
- Horizontal Pod Autoscaler (HPA): HPA controls the number of pods
- Vertical Pod Autoscaler (VPA): VPA controls the resources in individual pods
- Cluster Autoscaler (CA): CA controls the number of nodes in a cluster
Horizontal Pod Autoscaler (HPA)
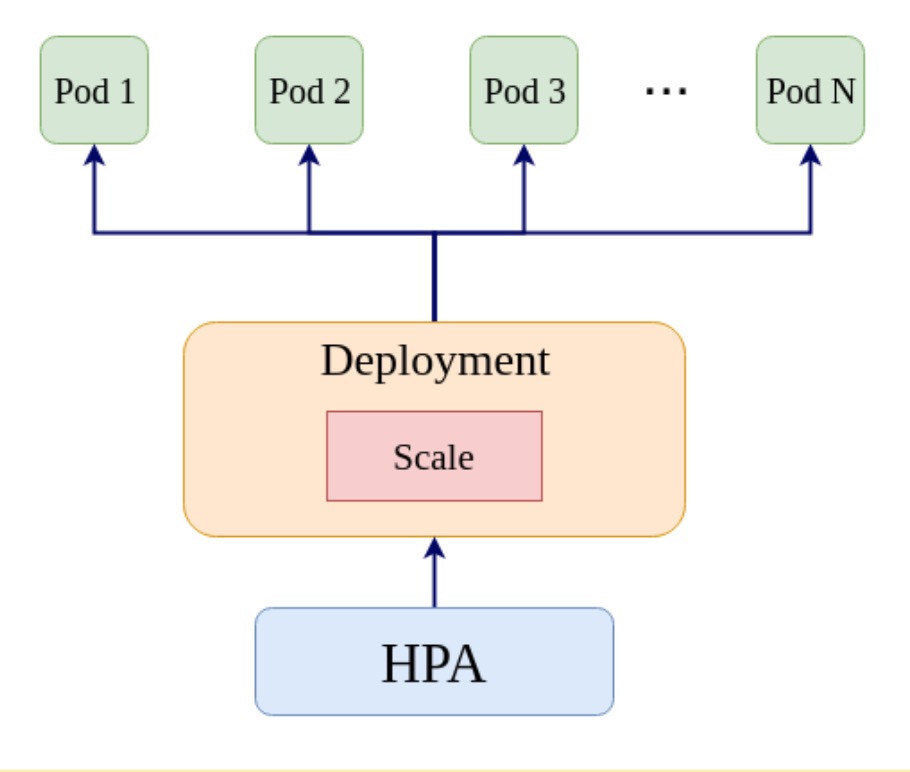
--horizontal-pod-auto-scaler-sync-period flag) and if the current threshold is higher than the specified threshold HPA attempts to increase the number of pods. HPA controller assumes a linear relationship between the metric and the number of pods. It operates on the ratio between the desired metric value and the current metric value. The formula used to compute the desired replicas is as follows (refer to the K8s documentation for more details).

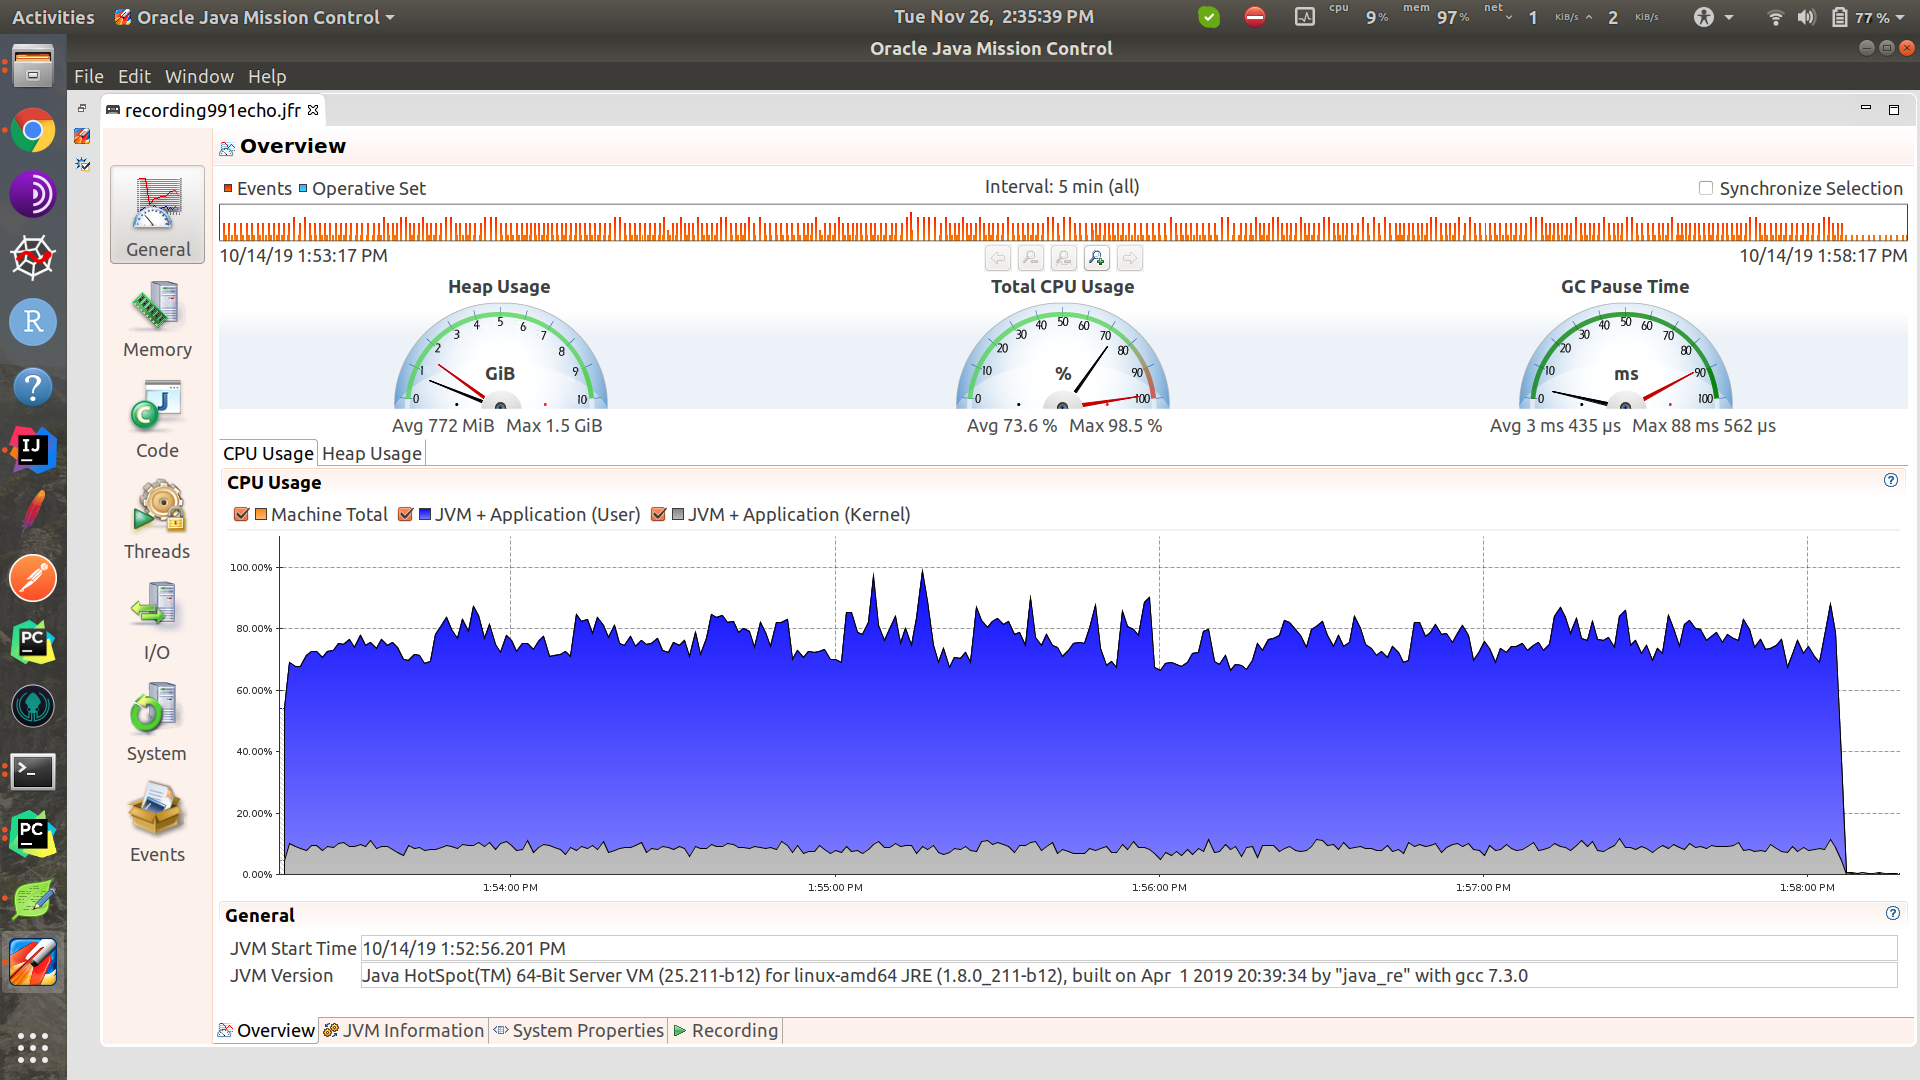
In this article, we will focus on horizontal pod autoscaling and we will scale based on the CPU utilization (which is one of the most commonly used metrics). Note that higher CPU utilization indicates higher latency. Therefore, maintaining the CPU utilization at lower levels allows us to maintain the latency (of the application) at lower levels as well. The following figure shows the variation of the CPU utilization of an (I/O bound) microservice.
You may also enjoy: Microservices Architecture: Introduction to Auto Scaling
Deploying the App
Let us now deploy a microservice in Kubernetes and study the performance behaviors with auto-scaling enabled. We will deploy a Spring Boot microservice (see here for the Github repo) in K8s. The following is the Kubernetes YAML file for the deployment.
xxxxxxxxxx
#deploymet/app/app.yaml
apiVersionapps/v1
kindDeployment
metadata
namespringboot-app
labels
appspringboot-app
spec
replicas1
selector
matchLabels
appspringboot-app
template
metadata
labels
appspringboot-app
spec
containers
namespringboot-app
imageanushiya/applatest
resources
limits
cpu"100m"
requests
cpu"100m"
ports
containerPort9000
Configuring the Horizontal Pod Autoscaler
Let us now enable Horizontal Pod Autoscaling for the deployment created above. We configure the HPA to scale based on CPU utilization. The YAML file is shown below.
xxxxxxxxxx
#springboot-app-hpa.yaml
apiVersionautoscaling/v2beta2
kindHorizontalPodAutoscaler
metadata
namespringboot-app-hpa
spec
scaleTargetRef
apiVersionapps/v2beta2
kindDeployment
namespringboot-app
minReplicas1
maxReplicas20
metrics
resource
namecpu
targetAverageUtilization50
typeResource
HPA is also an API resource in the Kubernetes, with apiVersion, kind, metadata and spec fields (refer to K8s documentation for more details). The scaling condition is defined by resource: targetAverageUtilization. Here we specify a value of 50. This means that if the CPU utilization exceeds the given value, the scaling process starts. The value should be in between 1 and 100.
Deploying JMeter
To test the performance of the application, we use JMeter as the load testing client. To deploy the JMeter we created a Docker image. The following is the Dockerfile for the JMeter. The files used can be found in this repo.
xxxxxxxxxx
FROM anushiya/jmeter-plugins:v1
ADD bash /home/kubernetes-performance/bash
ADD jar /home/kubernetes-performance/jar
ADD jmx /home/kubernetes-performance/jmx
ADD python /home/kubernetes-performance/python
WORKDIR /home/kubernetes-performance/bash
RUN chmod +x start_performance_test.sh
RUN apt-get update && apt-get install python3.5 -y
RUN apt-get install python-pip -y
RUN pip install numpy requests schedule
Since we want to store the performance test results permanently we use host volume to store the results of the tests performed. To create a host volume ssh into any of the nodes and create a directory to mount.
xxxxxxxxxx
#Get the list of nodes
kubectl get node
#Select a node and ssh into it
sudo gcloud beta compute --project "[name of the project]" ssh --zone "[zone]" "[name of the node]"
#example
sudo gcloud beta compute --project "performance-testing" ssh --zone "us-central1-a" "gke-performance-testing-default-pool-b6e4d476-78zn"
#Create a directory to mount
sudo mkdir /mnt/data/results
Create a persistent volume.
xxxxxxxxxx
#pv-volume.yaml
apiVersionv1
kindPersistentVolume
metadata
namepv-volume
labels
typelocal
spec
storageClassNamemanual
capacity
storage10Gi
accessModes
ReadWriteOnce
hostPath
path"/mnt/data/results"
Create a persistent volume claim.
xxxxxxxxxx
#deployment/volume/pv-claim.yaml
apiVersionv1
kindPersistentVolumeClaim
metadata
namepv-claim
spec
storageClassNamemanual
accessModes
ReadWriteOnce
resources
requests
storage6Gi
Apply the YAML files to create persistent volume and persistent volume claim
xxxxxxxxxx
#create persistent volume
kubectl apply -f deployment/volume/pv-volume.yaml
#create persistent volume claim
kubectl apply -f deployment/volume/pv-claim.yaml
For more details about PersistentVolume and PersistenetVolumeClaim see this. Now that we have created volumes to store the test results, we'll move on to creating a Job to perform the tests. The test results can be found in the directory specified above.
#perf-test.yaml
apiVersionbatch/v1
kindJob
metadata
nameperf-test
spec
template
spec
containers
nameperf-test
imageanushiya/perf-testv1
imagePullPolicyAlways
command"bash" "start_performance_test.sh"
volumeMounts
mountPath"/home/kubernetes-performance/results"
namepv-storage
restartPolicyNever
volumes
namepv-storage
persistentVolumeClaim
claimNamepv-claim
backoffLimit4
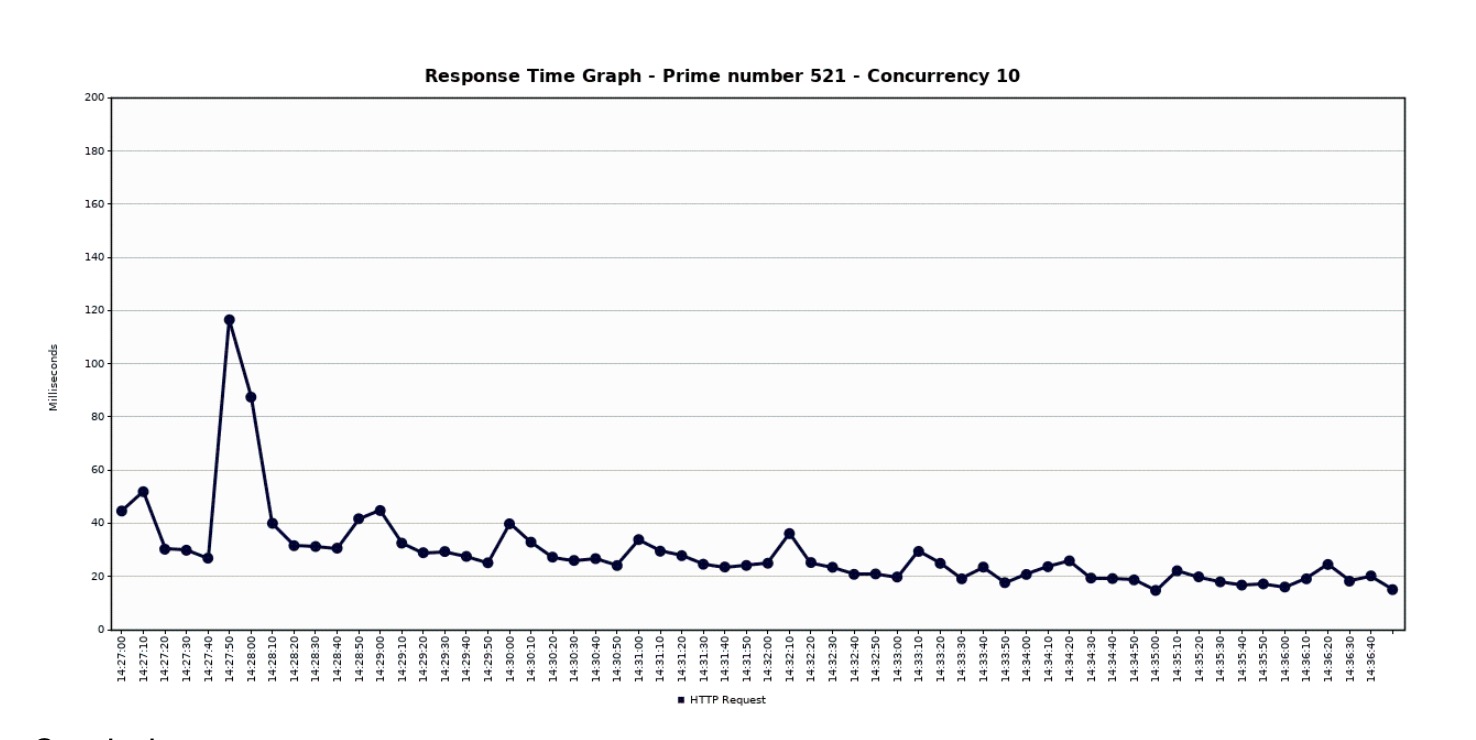
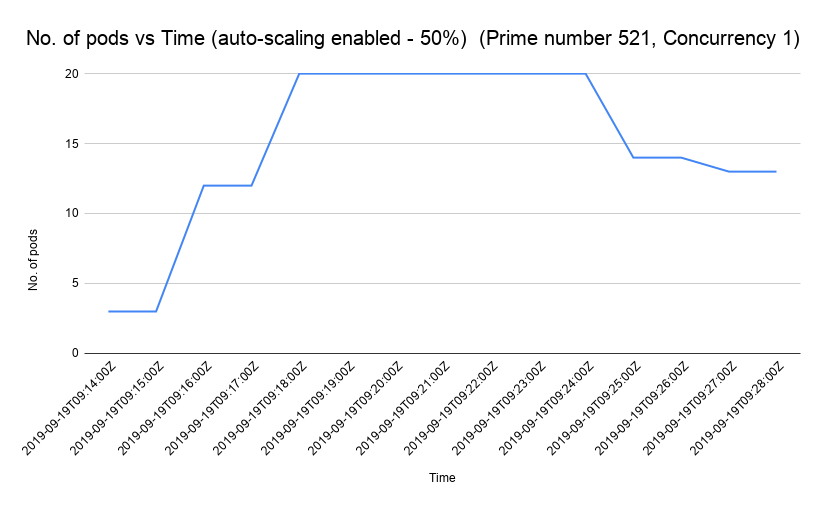
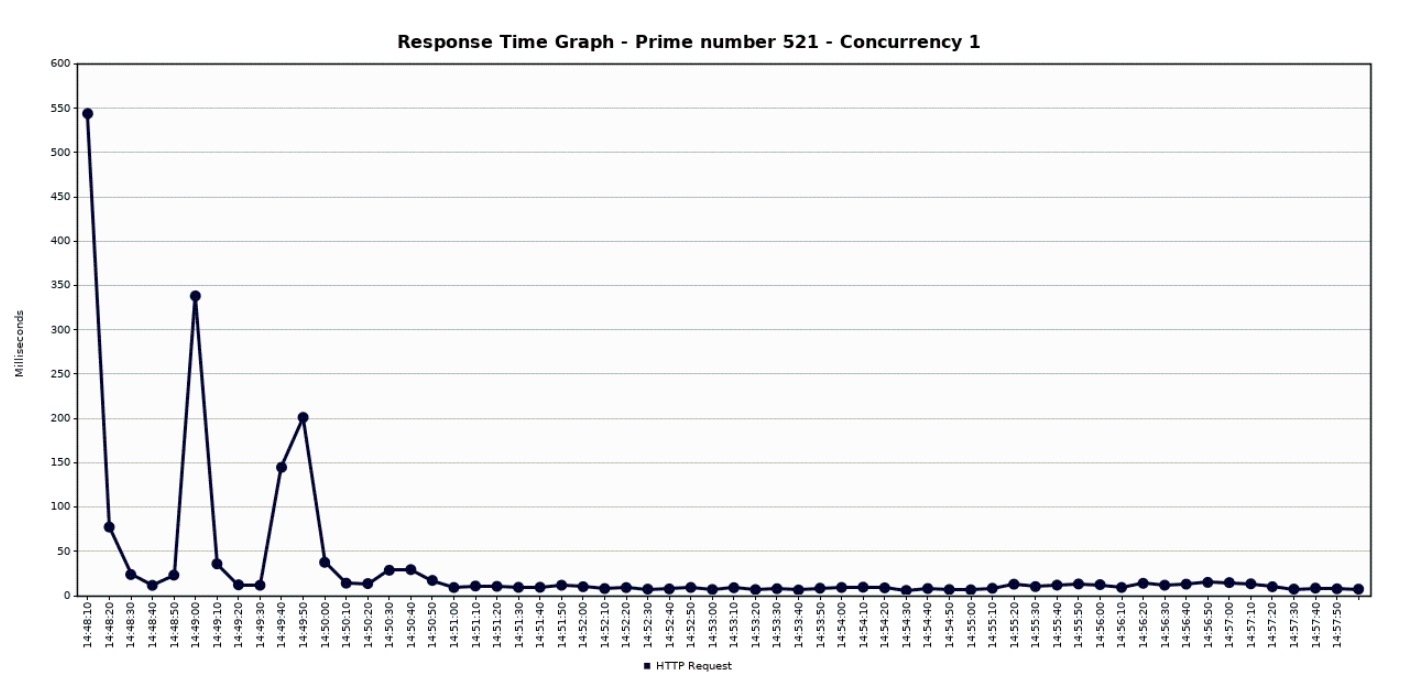
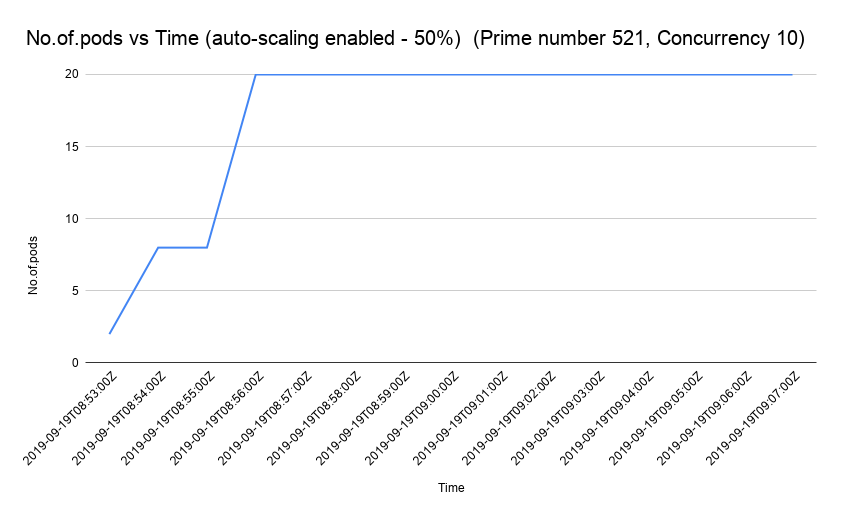
Analyzing the Behavior of CPU Utilization, Latency and Pod Count
Let us now take a look at how the CPU, pod count, and latency vary with time. The following figures show the variation in CPU utilization, pod count and the latency when we test the performance using a single concurrency user. We have used Stackdriver Monitoring API to get the performance statistics (see this link for more details).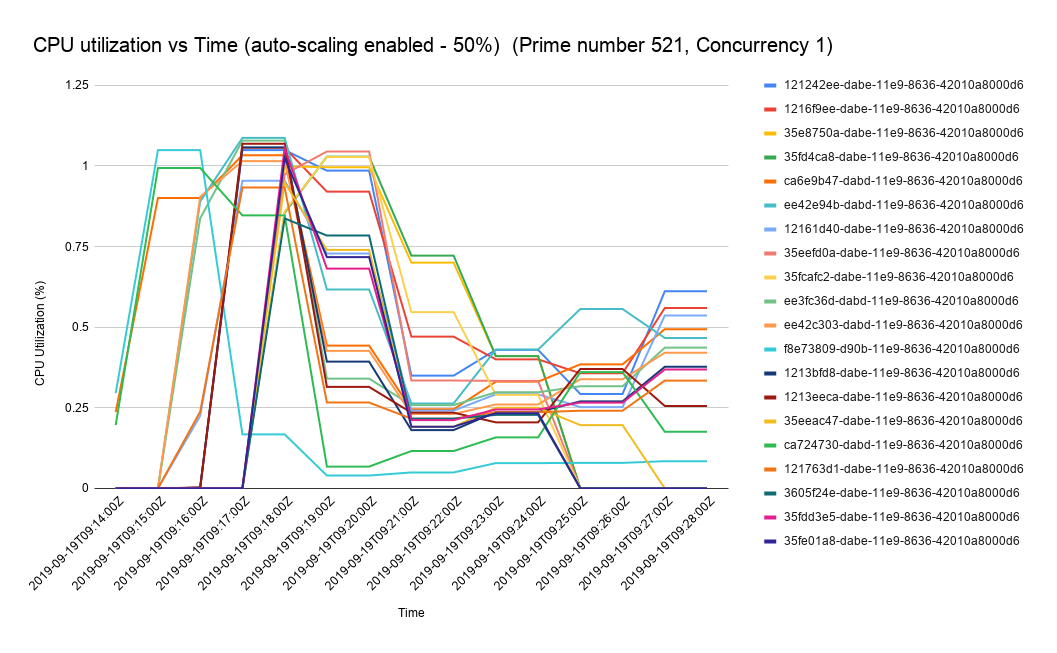

Further Reading
Vertical Scaling and Horizontal Scaling in AWS
Opinions expressed by DZone contributors are their own.
Comments