Create a Millisecond-Precision Time Ticks Chart with NodeJS
You'll create an interactive and real-time time ticks chart with NodeJS and LightningChart JS. This chart features an ultra-high precision zoom level up to milliseconds.
Join the DZone community and get the full member experience.
Join For FreeHello!
Omar from LightningChart here. As my first article for DZone, I wanted to experiment with how to create different charts available from the lcjs library.
This time, I'll walk you through how to create a time ticks chart using NodeJS and the lcjs library.
There are several options for placing and formatting automatic axis ticks within a chart. In this case, we're using TimeTickStrategy, as featured in the LightningChart JS library.
This feature has been designed for depicting milliseconds of timestamp data with an extremely high resolution, flexibility, and performance.
The effective range of TimeTickStrategy starts from a maximum of 100 hours all the way down to rendering at a level of individual milliseconds.
So, in a real-world use case scenario, this chart is specially designed for industries that require visualizing data at very low zoom levels—for instance, visualizing data points of an 8-hour, 1-hour, 1-minute, 1-second, or even 1-millisecond interval.
For this entire range, the tick labels are formatted dynamically, showing the currently relevant precision with all the required accuracy.
Some industries that benefit from this would be trading, real-time monitoring, research, engineering, and even audio and vibration analysis.
You can read more about the chart here.
With that being said, let's set up our project template.
Setting Up Our Template
- To follow the article, you'd ideally download the project template. The template is a RAR file and you can download the Time Ticks Chart project template here.
- Once downloaded, please open up the folder in Visual Studio Code. Then, you'll see a file tree like this:
![Project-Time-Ticks-Chart-file-tree]()
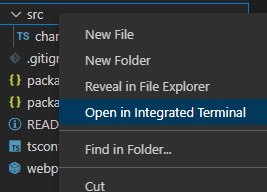
- Now, open a new terminal.
- And, as usual in a NodeJS project, we will have to run our NPM Install command.
This would be everything for our initial setup.
Let’s code.
CHART.ts
Inside this file, we will have all the logic needed to create our chart, configure animations, and format the data.
1. Declare the constant lcjs that will refer to setting up the @arction/lcjs library.
2. Extract required classes from lcjs.
// Import LightningChartJS
const lcjs = require('@arction/lcjs')

// Extract required parts from LightningChartJS.
const {
    lightningChart,
    AxisTickStrategies,
    Themes
} = lcjs
3. Next, we'll start creating the chart object.
const chart = lightningChart()
    .ChartXY({
        theme: Themes.cyberSpace,
    })
    .setTitle('TimeTickStrategy example')
    .setPadding({ right: 40 })
    .setMouseInteractionsWhileScrolling(true)
So, here's a quick explanation of what the properties do:
- setMouseInteractionWhileScrolling. This determines if the mouse and cursor interactions should be disabled during scrolling animations for the chart's series.
Parameters
- State: Boolean. Set to True if the mouse and the cursor interactions should be disabled during the scrolling animations, false if otherwise.
- Returns this: The chart itself for a fluent interface.
- Theme: it refers to the collection of default implementations that can be accessed by Themes. The Color theme of the components must be specified when it is created, and can't be changed afterward (without destroying and having to recreate the component). You can read more about the themes here.
4. createProgressiveTraceGenerator:
This property creates a new Sampled data generator with default values. This means that the generator will sample the given input data array at a specific frequency. See the code below:
const {
    createProgressiveTraceGenerator
} = require('@arction/xydata')
5. getDefaultAxisY:
This property will retrieve the Y-axis.
setScrollStrategy: Specify ScrollStrategy of the Axis. This decides where the Axis scrolls based on the current view and series boundaries.
6. getDefaultAxisX: This property will retrieve the X-axis.
setTickStrategy: The TickStrategy defines the positioning and formatting logic of the Axis ticks as well as the style of created ticks. You can read more about the setTickStrategy here.
const axisX = chart
    .getDefaultAxisX()
    // Enable TimeTickStrategy for X Axis.
    .setTickStrategy(AxisTickStrategies.Time)

const axisY = chart.getDefaultAxisY()
7. addLineSeries: This is a method for adding a new LineSeries to the chart. Briefly, what a line series does is visualize a list of given coordinates (X and Y points) with a continuous stroke.
It's worth mentioning that the LineSeries is fully optimized for visualizing a massive amount of data, seizing the GPU acceleration capability of the lcjs library.
However, the final amount of data rendered will depend on the LineSeries type. LightningChart JS supports static, refreshing, and appending line charts.
For instance, when testing the static line charts for visualizing 10 million data points, the loading speed is only 330 ms.
On the other hand, a refreshing line chart processes 1 million data points at 10 FPS using only 57.6% of the CPU resources. And for appending line charts, 1 million data points per second are appended using only 23.7% of CPU resources, at a rounded 60 FPS.
Therefore, the LineSeries performance will depend on your application requirements, but the component is mainly a performance-oriented component.
If you want to know more about the latest of LineSeries performance, visit the LineSeries performance comparison.
const series = chart.addLineSeries({
    dataPattern: {
        pattern: 'ProgressiveX',
    },
})
8. addLegendBox: this property adds a box to the chart. The box has the capability of hiding and showing the data series.
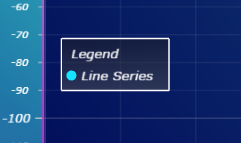
const legend = chart.addLegendBox().add(chart)
    // Dispose example UI elements automatically if they take too much space. This is to avoid bad UI on mobile / etc. devices.
    .setAutoDispose({
        type: 'max-width',
        maxWidth: 0.30,
    })
9. numberOfPoints: This property sets the number of points to be displayed in the charts. If you decide to use smaller values, the chart will look simplified.
I'll set my example to: const numberOfPoints = 1 * 10
// Generate ~8 hours of data for line series.
const numberOfPoints = 1 * 10
// TimeTickStrategy interprets values as milliseconds (UNIX timestamp).
const xInterval = 80 * 60 * 60 * 1000
createProgressiveTraceGenerator()
.setNumberOfPoints(numberOfPoints)
.generate()
.toPromise()
.then((data) => {
data = data.map((p) => ({
x: (p.x * xInterval) / numberOfPoints,
y: p.y,
}))
series.add(data)
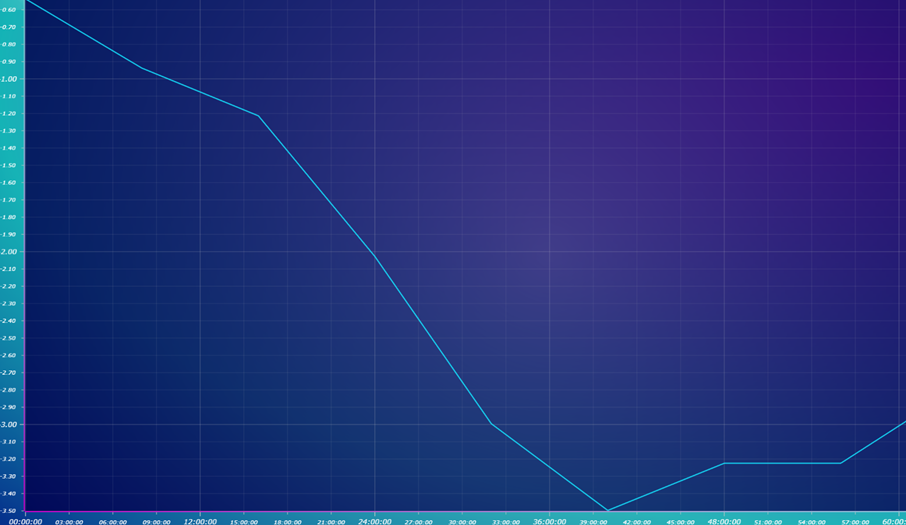
})NPM Start
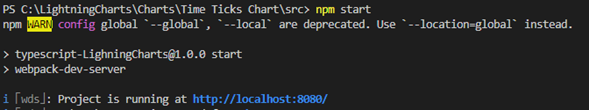
Finally, you'll just have to run the npm start command to visualize the time ticks chart in a local server:
Run "npm start" and you'll get access to your local server:
Final Words
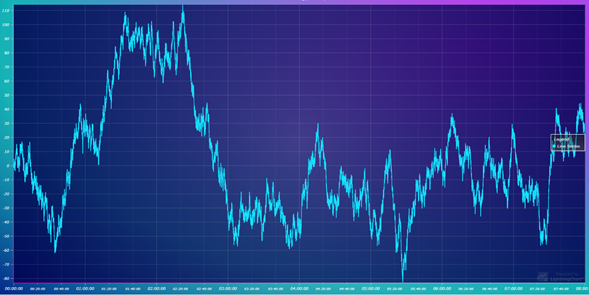
The TimeTicksStrategy is a powerful property that allows you to render data up to a millisecond's precision. This is especially useful when working with high-frequency data, or when you need to display very precise timing information.
This makes the TimeTicksStrategy an ideal feature for applications that require full precision rendering when visualizing millions of data points in real time, such as financial or scientific applications.
With the TimeTicksStrategy property, you can ensure that your data is rendered accurately and efficiently.
So, this is definitely a useful feature for those developers who need to track data over very short periods of time, such as when monitoring computer processes or network activity.
If you need this level of detail in your charts, then the line series chart is definitely worth considering.
Thanks!
Opinions expressed by DZone contributors are their own.
Comments