Leveraging Snowflake’s AI/ML Capabilities for Anomaly Detection
Explore the AI/ML capabilities of Snowflake, focusing on leveraging the SNOWFLAKE.ML.ANOMALY_DETECTION function to detect anomalies in superstore sales.
Join the DZone community and get the full member experience.
Join For FreeAnomaly detection is the process of identifying the data deviation from the expected results in a time-series data. This deviation can have a huge impact on forecasting models if not identified before the model creation. Snowflake Cortex AL/ML suite helps you train the models to spot and correct these outliers in order to help improve the quality of your results. Detecting outliers also helps in identifying the source of the deviations in processes.
Anomaly detection works with both single and multi-series data. Multi-series data represents multiple independent threads of events. For example, if you have sales data for multiple stores, each store’s sales can be checked separately by a single model based on the store identifier. These outliers can be detected in time-series data using the Snowflake built-in class SNOWFLAKE.ML.ANOMALY_DETECTION.
Please follow the steps below to implement the anomaly detection in a time-series dataset.
- Create an anomaly detection object by passing the training data. This object fits a model to the training data that you provide.
- Using this anomaly detection model object, call the
DETECT_ANOMALIESfunction to identify anomalies by passing the data to analyze.
In this article, I will be focusing on leveraging the SNOWFLAKE.ML.ANOMALY_DETECTION function to detect anomalies in superstore sales.
Data Setup and Exploration
In this article, we will be using the historical Technology sales data for a superstore. The following code can be used to explore the technology sales.
select * from superstore.superstore_ml_functions.superstore_sales where category = 'Technology';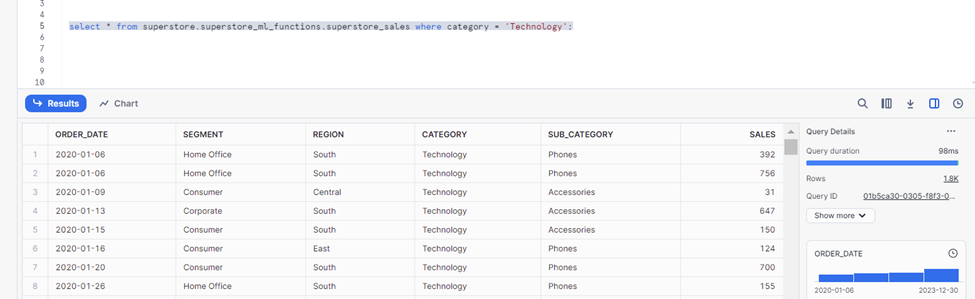
Having explored the historical sales, let’s create a table to store the last year of sales. This data will be used as training data.
CREATE OR REPLACE TABLE superstore_tech_sales_last_year AS (
    SELECT
     to_timestamp_ntz(Order_Date) AS timestamp,
        Segment,
        Category,
        Sub_Category,
        Sales
    FROM
        superstore_sales
    WHERE
        Order_Date > (SELECT max(Order_Date) - interval '1 year' FROM superstore_sales where category = 'Technology')
        and category = 'Technology'
    GROUP BY
        all
);

CREATE OR REPLACE TABLE superstore_tech_sales_historical AS (
    SELECT
        to_timestamp_ntz(Order_Date) AS timestamp,
        Segment,
        Category,
        Sub_Category,
        Sales
    FROM
        superstore_sales
    WHERE
        Order_Date <= (SELECT max(Order_Date) - interval '1 year' FROM superstore_sales where category = 'Technology')
        and category = 'Technology'
    GROUP BY
        all
);
Identifying Anomalies
In this section, we will focus on creating training datasets, analysis datasets, and models to detect the anomalies in a time series dataset.
The following code can be used to create training datasets for 6 months of historical sales to enrich the forecast models to detect the anomalies.
CREATE OR REPLACE VIEW superstore_tech_sales_historical_training
  AS SELECT timestamp,sum(sales) as sales  FROM superstore_tech_sales_historical where timestamp <= '2022-06-30' and timestamp >= '2022-01-01' group by timestamp;
After creating the training dataset, let's create the model to detect the anomalies using SNOWFLAKE.ML.ANOMALY_DETECTION class, key parameters to this function are as follows.
- Model name:
anomaly_basic_model - Training dataset:
superstore_tech_sales_historical_training
Along with these two key attributes, we also need to specify the timestamp column and key metric column in the dataset. In our use, SALES is the key metric where we want to identify the outliers. This call might take a few minutes to build the models.
  CREATE OR REPLACE SNOWFLAKE.ML.ANOMALY_DETECTION anomaly_basic_model(
  INPUT_DATA => TABLE(superstore_tech_sales_historical_training),
  TIMESTAMP_COLNAME => 'TIMESTAMP',
  TARGET_COLNAME => 'SALES',
  LABEL_COLNAME => '');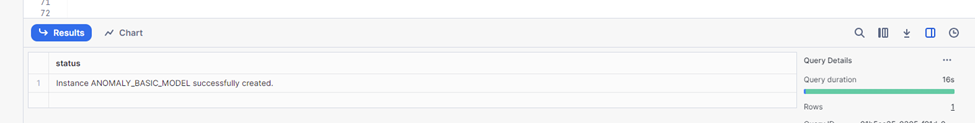
Now that we have the basic model ready, we will create the data to analyze using this model. You can use the code below to create a view. This view will be the source for the anomaly detection.
CREATE OR REPLACE VIEW superstore_tech_sales_for_analysis
  AS SELECT timestamp,sum(sales) as sales  FROM superstore_tech_sales_last_year where timestamp <= '2023-01-07' group by timestamp;
After creating the training data, models, and analysis datasets, the final stage in this process is to identify the anomalies. Please use the code below to look for the outliers in our analysis dataset.
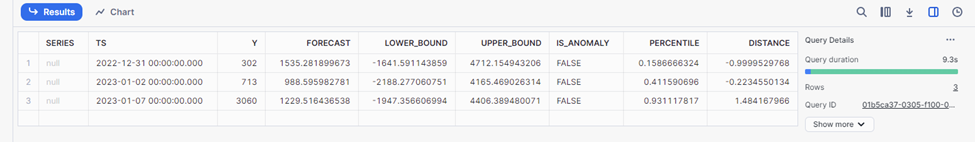
CALL anomaly_basic_model!DETECT_ANOMALIES(
  INPUT_DATA => TABLE(superstore_tech_sales_for_analysis),
  TIMESTAMP_COLNAME =>'TIMESTAMP',
  TARGET_COLNAME => 'SALES'
);
The above code will forecast the actuals, lower band, and upper band, and also call out if there are any anomalies in the data.
While detecting the anomalies, you can also provide the labeled data to the model. For example, if you want to identify a few abnormal sales and want the forecast models to consider them as outliers while forecasting the sales, you can use labeled data as part of the LABEL_COLNAME parameter. This is called supervised anomalies detection.
The following code block will create a new training model with an additional attribute called LABEL. This will be a boolean type to identify the outliers. Any sale of $1,000 or more is being labeled here.
CREATE OR REPLACE VIEW superstore_tech_sales_historical_training_with_label
AS SELECT DATE_TRUNC('day',timestamp) as timestamp,sum(sales) as sales, case when sum(sales) > 1000 then true else false end as label FROM superstore_tech_sales_historical where timestamp <= '2022-01-30' and timestamp >= '2022-01-01' group by DATE_TRUNC('day',timestamp);
CREATE OR REPLACE SNOWFLAKE.ML.ANOMALY_DETECTION anomaly_labeled_model(
INPUT_DATA => TABLE(superstore_tech_sales_historical_training_with_label),
TIMESTAMP_COLNAME => 'TIMESTAMP',
TARGET_COLNAME => 'SALES',
LABEL_COLNAME => 'LABEL');
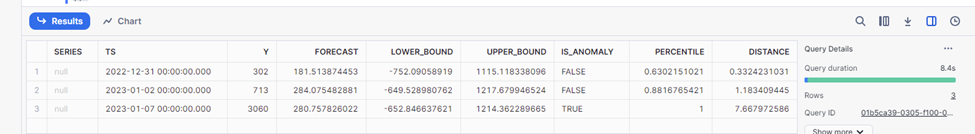
CALL anomaly_labeled_model!DETECT_ANOMALIES(
INPUT_DATA => TABLE(superstore_tech_sales_for_analysis),
TIMESTAMP_COLNAME =>'TIMESTAMP',
TARGET_COLNAME => 'SALES'
);
The following is the output for a supervised forecast model.
Conclusion
In this article, we have explored the Snowflake AI/ML capabilities to uncover the anomalies by creating forecast models. As a next step, I would recommend continued learning the Snowflake Cortex framework. You can explore designing anomaly visualizations, and create an automated anomaly detection pipeline for recurring training and execution.
Opinions expressed by DZone contributors are their own.
Comments