Real-Time Anomaly Detection
Emphasizing the importance of designing the analytics solution with the right tools for telemetry analytics solutions in Device Management solutions.
Join the DZone community and get the full member experience.
Join For FreeImproving an organization's overall data capabilities enables teams to operate more efficiently. Emerging technologies have brought real-time data closer to business users, which plays a critical role in effective decision-making.
In data analytics, the "hot path" and "cold path" refer to two distinct processing routes for handling data. The hot path involves real-time or near-real-time processing of data, where information is analyzed and acted upon immediately as it arrives. This path is crucial for time-sensitive applications, enabling quick responses to emerging trends or events. On the other hand, the cold path involves the batch processing of historical or less time-sensitive data, allowing for in-depth analysis, long-term trends identification, and comprehensive reporting, making it ideal for strategic planning and retrospective insights in data analytics workflows.
In typical analytics solutions, the integration of incoming telemetry data with corresponding meta-data related to entities such as devices, users, or applications is a prerequisite on the server side before effective visualization in an application can occur. In this article, we will explore innovative methodologies for seamlessly combining data from diverse sources so that an effective dashboard can be built.
The Event-Driven Architecture for Real-Time Anomalies

Let's explore a real-time dashboard wherein administrators meticulously monitor network usage. In this scenario, live data on network usage from each device is transmitted in real-time, undergoing aggregation on the server side, inclusive of associating the data with respective client names before refreshing the user's table. In such use cases, the implementation of Event-Driven architecture patterns emerges as the optimal approach for ensuring seamless data processing and real-time insights.
Event-driven design seamlessly orchestrates data flow between disparate microservices, enabling the aggregation of critical data points. Through clearly defined events, information from two distinct microservices is aggregated, ensuring real-time updates. The culmination of this event-driven approach provides a comprehensive and up-to-date representation of key metrics and insights for informed decision-making.

In the depicted scenario, the telemetry data is seamlessly transmitted to the service bus for integration into the Dashboard service. Conversely, device metadata exhibits infrequent changes. Upon receipt of new telemetry events, the Dashboard service dynamically augments each record with all relevant metadata, presenting a comprehensive dataset for consumption by APIs. This entire process unfolds in real-time, empowering administrators to promptly identify network anomalies and initiate timely corrective measures.
This methodology proves effective for those real-time scenarios, characterized by frequent incremental data ingestion to the server and a resilient system for processing those events.
The Materialized View Architecture for Historical Reports
For a historical report dashboard, adopting an event-driven approach might entail unnecessary effort, given that real-time updates are not imperative. A more efficient strategy would involve leveraging PostgreSQL Materialized Views, which is particularly suitable for handling bursty data updates. This approach allows for scheduled data crunching at predefined intervals, such as daily, weekly, or monthly, aligning with the periodic nature of the reporting requirements.
PostgreSQL Materialized Views provide a robust mechanism for persistently storing the results of complex joins between disparate tables as physical tables. One of the standout advantages of materialized views is their ability to significantly improve the efficiency of data retrieval operations in APIs, as a considerable portion of the data is pre-computed. The incorporation of materialized views within PostgreSQL represents a substantial performance boost for read queries, particularly beneficial when the application can tolerate older, stale data. This feature serves to reduce disk access and streamline complex query computations by transforming the result set of a view into a tangible physical table.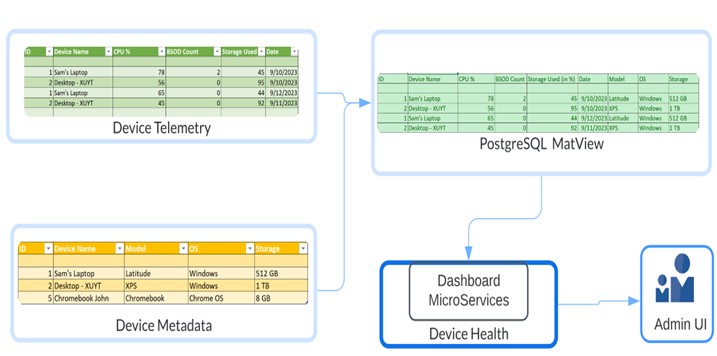
Let’s look at the above example with Device telemetry and metadata tables. The mat view can be created by the command below in SQL.
CREATE MATERIALIZED VIEW  device_health_mat AS

SELECT t.bsod_count, t.storage_used, t.date

FROM device_telemetry t

INNER JOIN device d ON t.ID = d.ID

WITH DATA;
Materialized views are beneficial in data warehousing and business intelligence applications where complex queries, data transformation, and aggregations are the norms. You can leverage materialized views when you have complex queries powering user-facing visualizations that need to load quickly to provide a great user experience.
The only bottleneck with them is that the refresh needs to be explicitly done when the underlying tables have new data and can be scheduled with the command below.
REFRESH MATERIALIZED VIEW device_health_mat;

(or)

REFRESH MATERIALIZED VIEW CONCURRENTLY device_health_mat;
In conclusion, while both aforementioned use cases share a dashboard requirement, the selection of tools and design must be meticulously tailored to the specific usage patterns to ensure the effectiveness of the solution.
Opinions expressed by DZone contributors are their own.
Comments