Cypress Debugging Hacks: Tips and Tricks for Speedy Resolution
Debugging Cypress tests can help identify issues in test code and the application under test. Here, learn more about the Cypress debugger and other dev tools.
Join the DZone community and get the full member experience.
Join For FreeWriting code quickly is a valuable skill, but the true mark of a proficient software developer is the ability to effectively debug and resolve errors and bugs. Debugging is a critical aspect of the development process, ensuring that software functions as intended and meets user needs.
Cypress’s debugging capabilities make it an invaluable tool for QA engineers and developers. Its detailed error messages, interactive test runner, integration with developer tools, and specialized debug commands allow for quick and efficient resolution of test failures. Debugging Cypress tests can help you identify issues in your test code and the application under test. Cypress offers several methods and tools for effective debugging. In this blog, we will discuss how to debug your Cypress tests using the Cypress debugger and other developer tools.
Before jumping into the various methods of Cypress debugging, let’s try to understand why debugging is important.
Why Is Debugging Important?
Debugging is a critical aspect of software development, and the quality of debugging tools available in a framework can significantly impact the development process. Here’s a more detailed look at why debugging is so crucial and what to consider when choosing a framework:
Importance of Debugging
Error Detection
Debugging tools help identify where and why errors occur in the code, allowing developers to pinpoint the exact location of the issue.
Code Correction
Once an error is detected, debugging tools assist in understanding the cause of the error, facilitating the development of a solution.
Performance Optimization
Debugging is not only about fixing errors but also about improving the performance of the code. It helps identify inefficiencies and bottlenecks in the program.
Ensuring Functionality
Debugging ensures that the software behaves as expected, meeting the specified requirements and providing a smooth user experience.
Enhancing Security
Identifying and fixing vulnerabilities through debugging can prevent potential security breaches.
In the next section, you will see the various Cypress debugging methods.
Methods of Debugging in Cypress
Debugging in Cypress can be performed using various methods, including command logs, .pause(), .debug(), cy.log(), console.log(), and the native JavaScript debugger.
An additional method of debugging the test case in Cypress is by screenshot and video.
Debugging in Cypress involves several methods to help identify and resolve issues in your tests. Here’s a detailed guide on each debugging method:
Cypress Debugging Using Command Logs
Cypress command logs are automatically shown in the Cypress Test Runner. it provides a detailed log of all Cypress commands executed during the test, including their status, duration, and any associated errors.
Usage
- Run your test in the Cypress Test Runner.
- Observe the command log in the left panel to see each command executed step-by-step.
- Click on individual commands to see more details, including DOM snapshots before and after the command execution.
Benefits
- Provides a visual timeline of all actions
- Easy to spot where a test fails
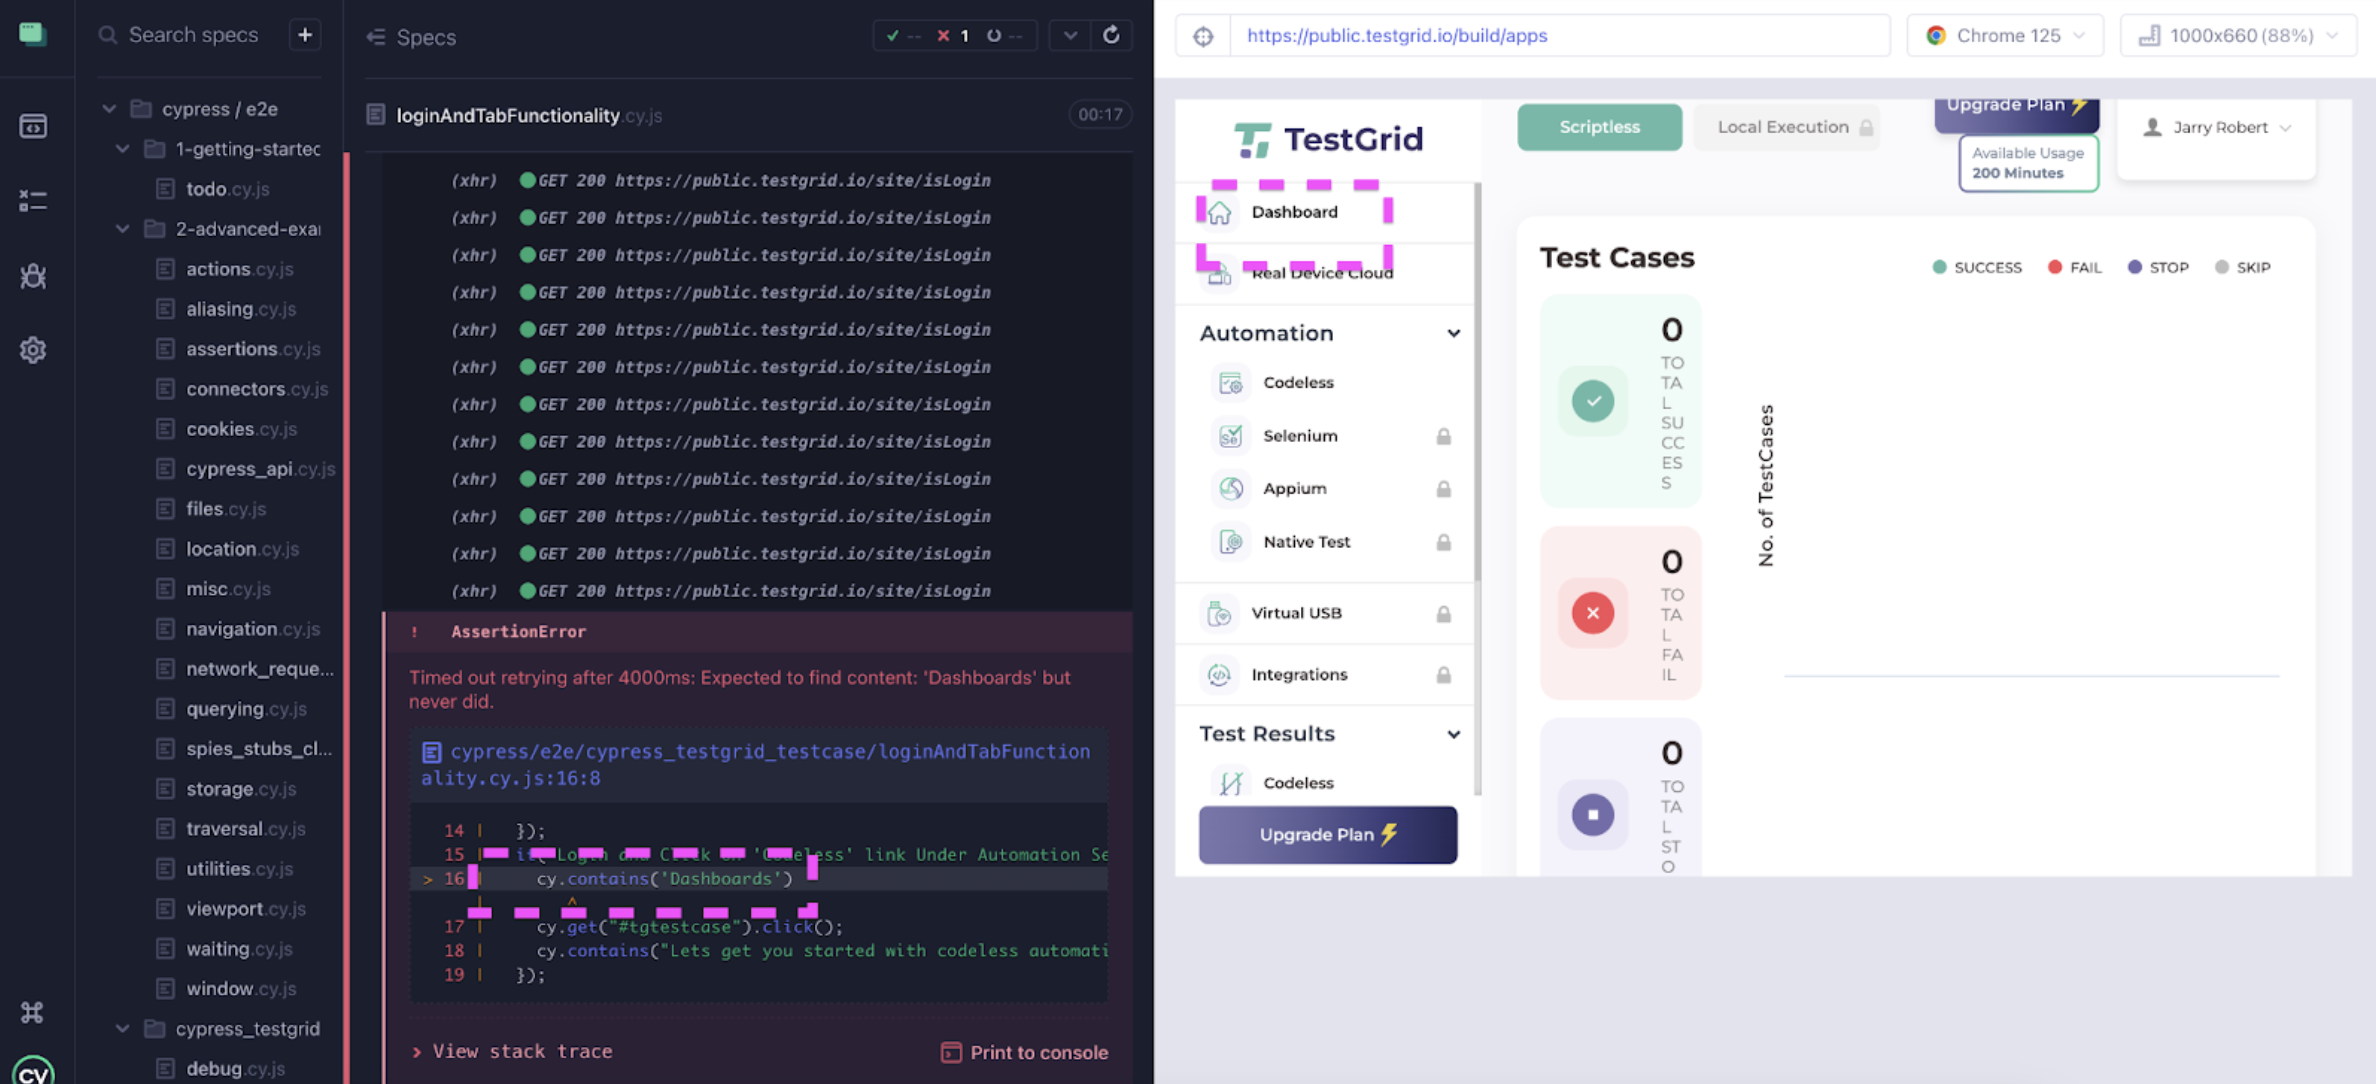
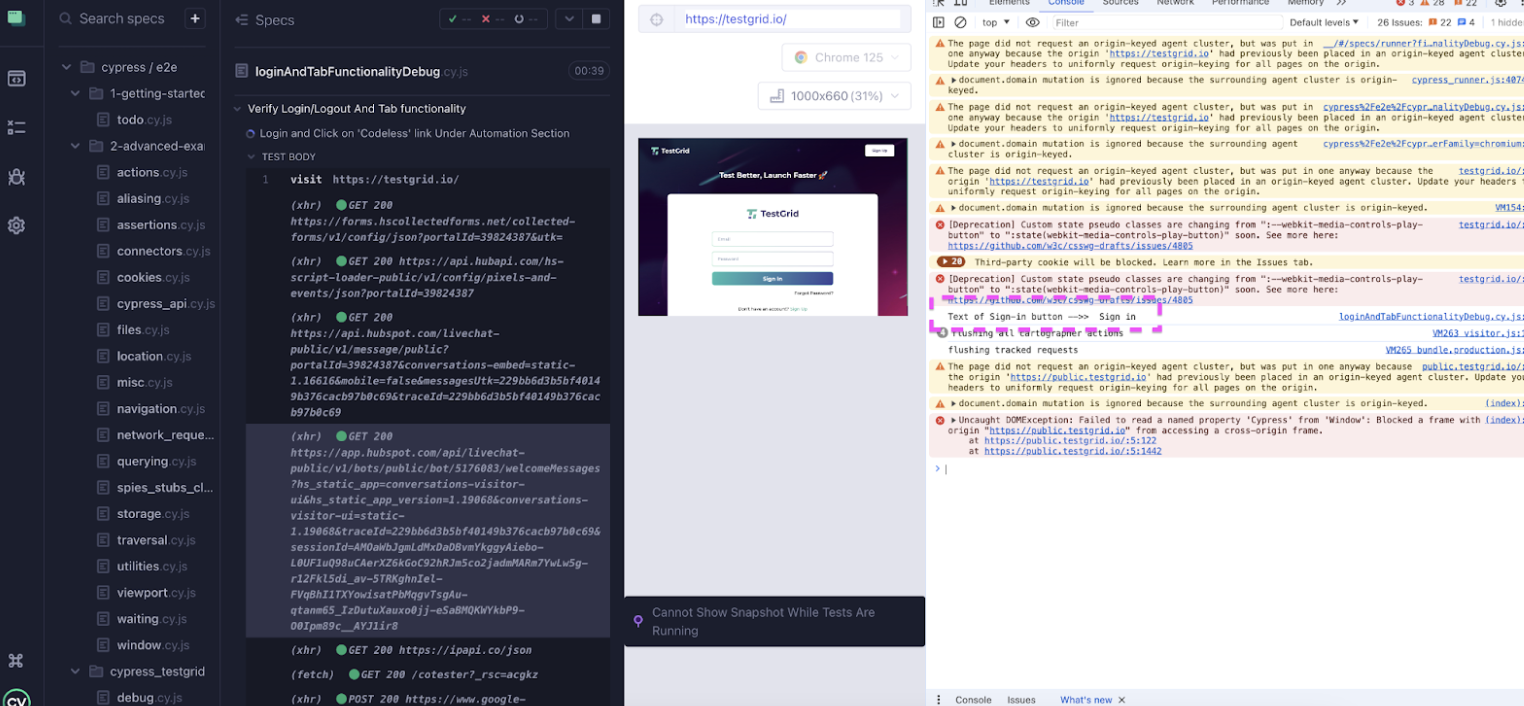
In the screenshot below, the left panel displays each command executed step-by-step, while the right side shows the corresponding outcomes. This setup enables us to pinpoint the cause of test case failures efficiently. For instance, in the example provided, the test is failing because the UI displays different text.
Cypress Debugging Using Method .pause()
The .pause() method pauses the test execution at a specific point, allowing you to inspect the state of the application and debug any issues.
cy.get(‘.element’).pause().click();Benefits
- Useful for stopping execution at a precise step to inspect the DOM
- You can resume the test manually in the Cypress Test Runner by clicking the “Resume” button.
Example
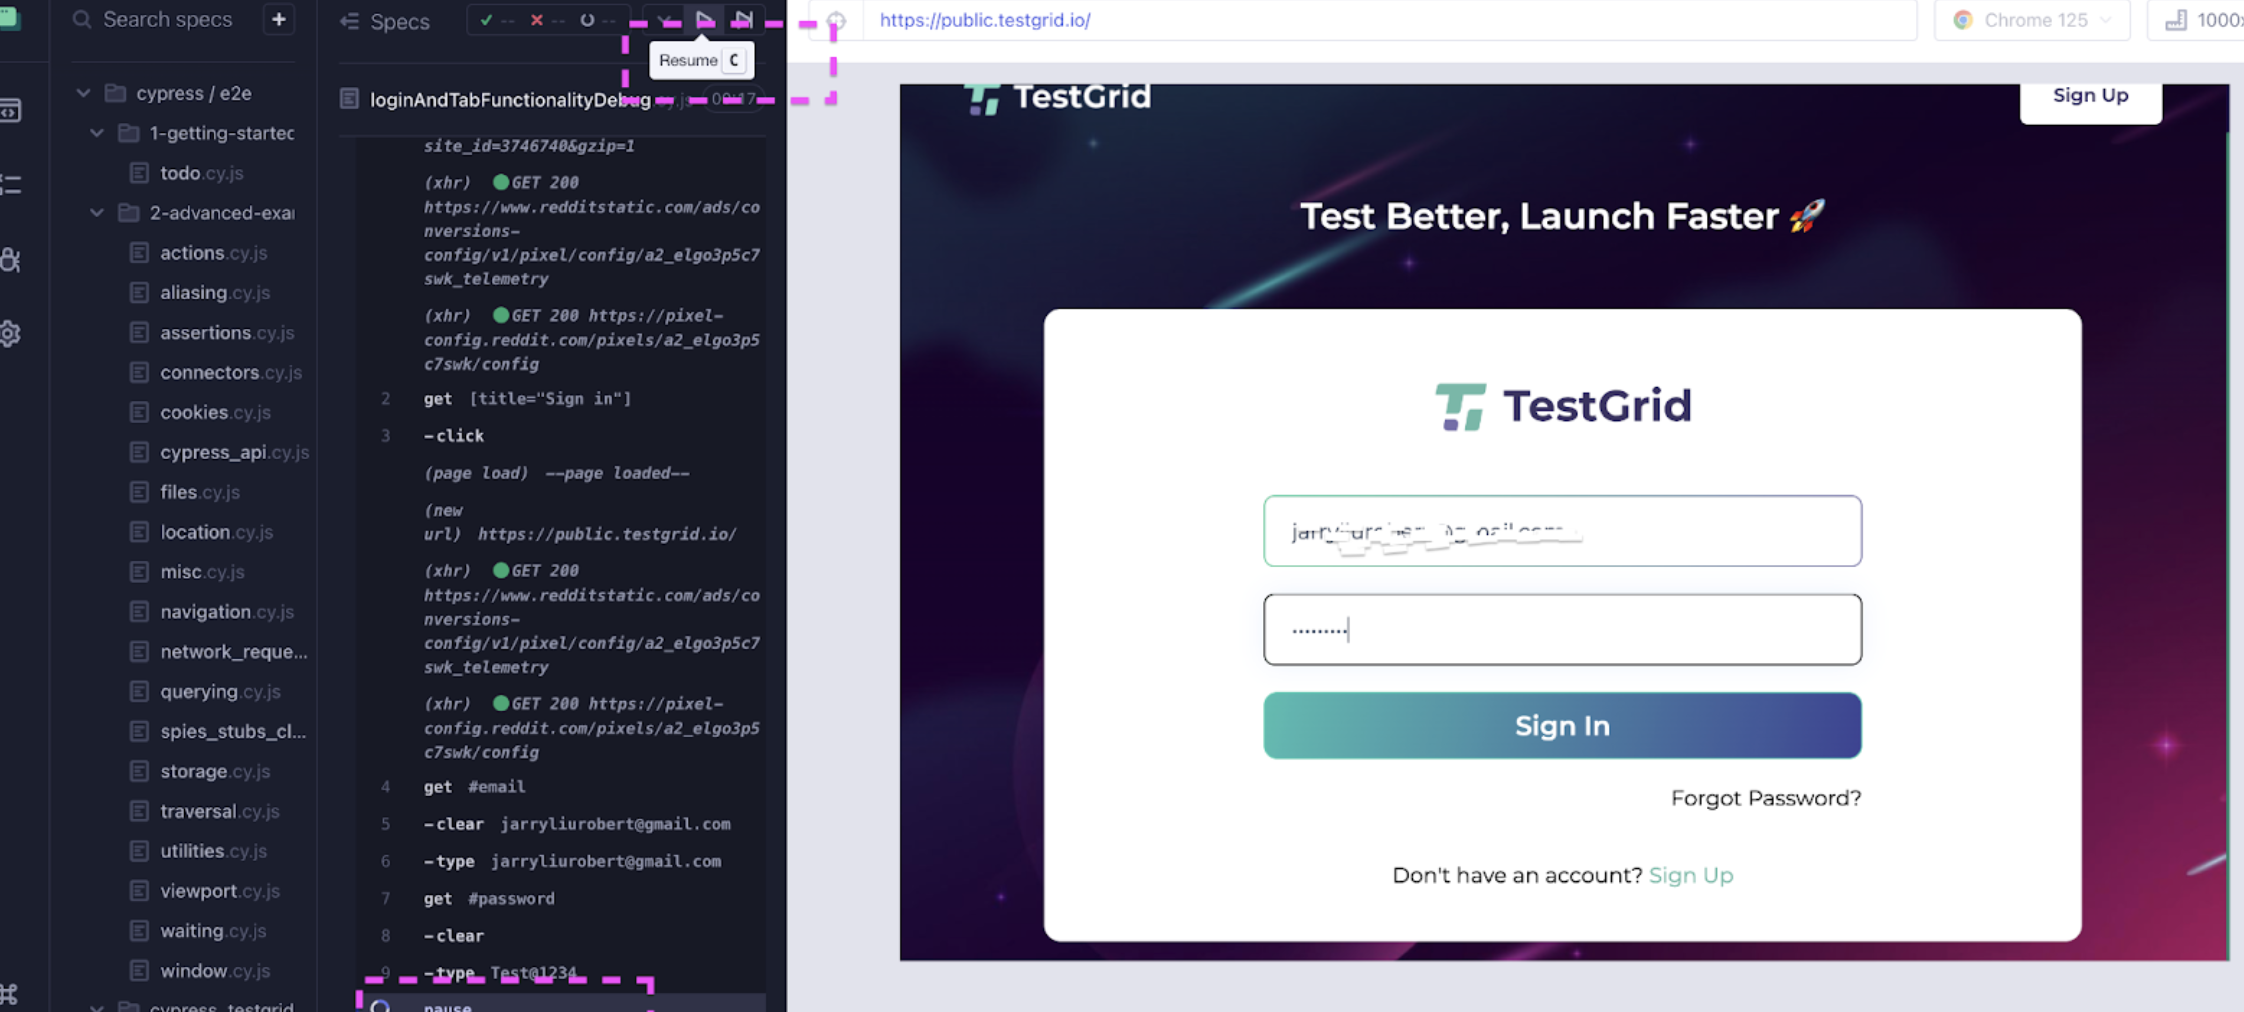
In the example below, we have put .pause() on the sign-in button after entering the data in the password field.
/// <reference types="cypress" />
describe("Verify Login/Logout And Tab functionality", () => {
 it("Login and Click on 'Codeless' link Under Automation Section", function () {
 cy.visit("https://testgrid.io/");
 cy.get('[title="Sign in"]').click();
 cy.get("#email")
 .clear("jarryliurobert@gmail.com")
 .type("jarryliurobert@gmail.com");
 cy.get("#password").clear().type("Test@1234");
 cy.get(".signin-button").click().pause();
 cy.contains("Dashboard");
 cy.get("#tgtestcase").click();
 cy.contains("Lets get you started with codeless");
 cy.get("[data-toggle='dropdown']").click();
 cy.contains("Logout").click();
 cy.contains("Forgot Password?");
 });
});
So after entering data in email and password, the test execution is paused. The code will run only the first four commands and pause before running the fifth command.
Cypress debugging Using .debug() Method
The Cypress debugging function .debug() is useful for debugging and can be chained to any Cypress command to pause the test and open the DevTools. This allows you to inspect the current state of your application and the test runner.
- NOTE: For the
.debug()command to execute, we have to keep the console window of the browser open where test cases are executing.
In the example below, we have put .debug() after entering data in the password field.
/// <reference types="cypress" />
describe("Verify Login/Logout And Tab functionality", () => {
 it("Login and Click on 'Codeless' link Under Automation Section", function () {
 cy.visit("https://testgrid.io/");
 cy.get('[title="Sign in"]').click();
 cy.get("#email")
 .clear("jarryliurobert@gmail.com")
 .type("jarryliurobert@gmail.com");
 cy.get("#password").clear().type("Test@1234")
 cy.get(".signin-button").debug().click();
 cy.contains("Dashboard");
 cy.get("#tgtestcase").click();
 cy.contains("Lets get you started with codeless");
 cy.get("[data-toggle='dropdown']").click();
 cy.contains("Logout").click();
 cy.contains("Forgot Password?");
 });
});
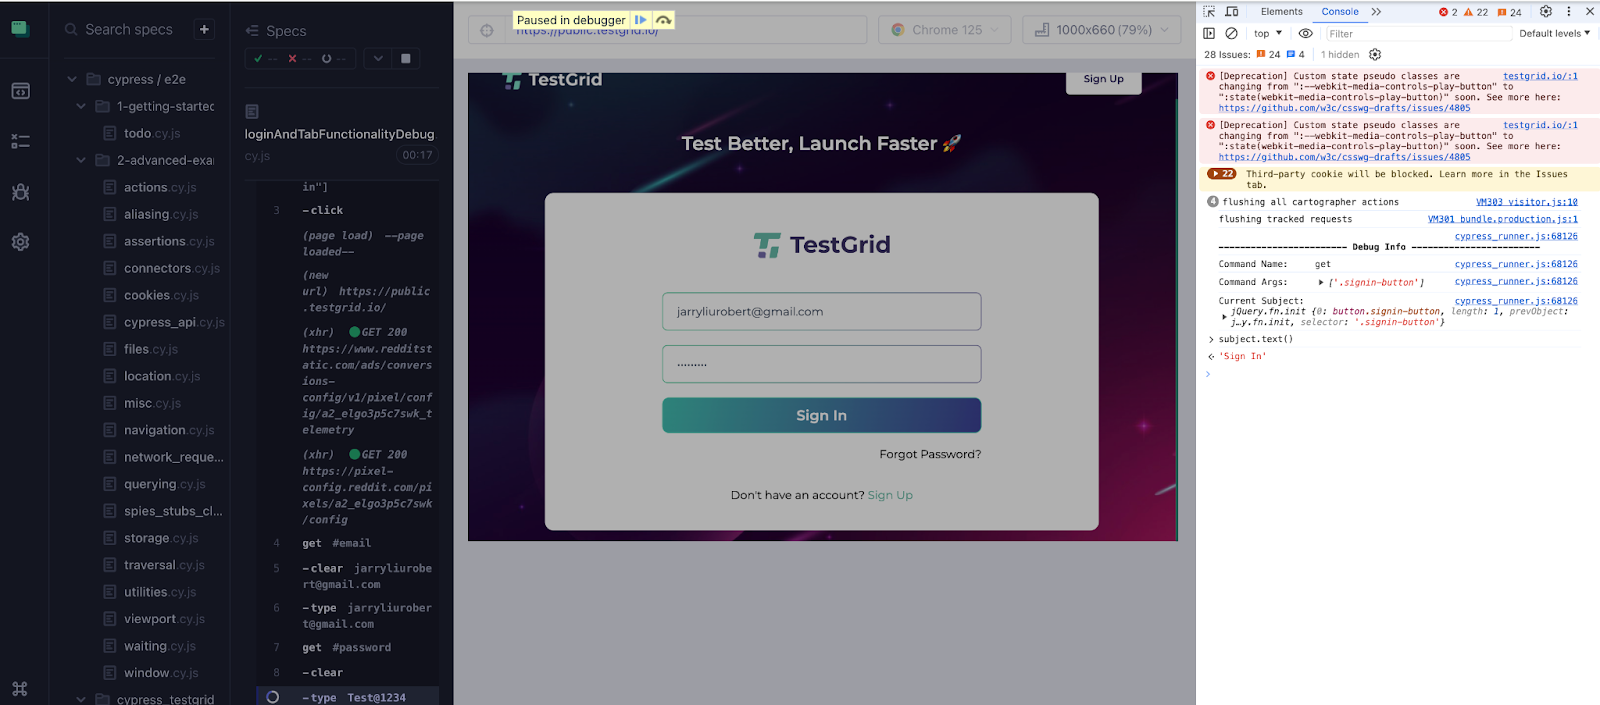
The subject variable in Cypress represents the return value of the Cypress command, which you can interact with in the browser’s console during debugging. When we run the command subject.text(), this will give us the text content inside the sign-in button.
Cypress Debugging Using cy.log()
The cy.log() function in Cypress allows you to print messages to the Cypress test runner’s console. This is particularly useful for debugging purposes and for providing context or additional information about the test execution.
cy.get('.element').then(($el) => {
 cy.log('Element text is:', $el.text());
});
Benefits
- Helps in printing custom information to the cypress console log
- Useful for adding context to your tests
Example
In the example below, you can see we are printing the text of the sign-in link which is available on the home page after opening the URL https://testgrid.io/.
/// <reference types="cypress" />
describe("Verify Login/Logout And Tab functionality", () => {
 it("Login and Click on 'Codeless' link Under Automation Section", function () {
 cy.visit("https://testgrid.io/");
 cy.get('[title="Sign in"]').then($signin => {
 cy.log("The Value is",$signin.text())
 })
 cy.get('[title="Sign in"]').click();
 cy.get("#email").clear("jarryliurobert@gmail.com").type("jarryliurobert@gmail.com");

 cy.get("#password").clear().type("Test@1234")
 cy.get(".signin-button").debug().click();
 cy.contains("Dashboard");
 cy.get("#tgtestcase").click();
 cy.contains("Lets get you started with codeless automation");
 cy.get("[data-toggle='dropdown']").click();
 cy.contains("Logout").click();
 cy.contains("Forgot Password?");
 });
});
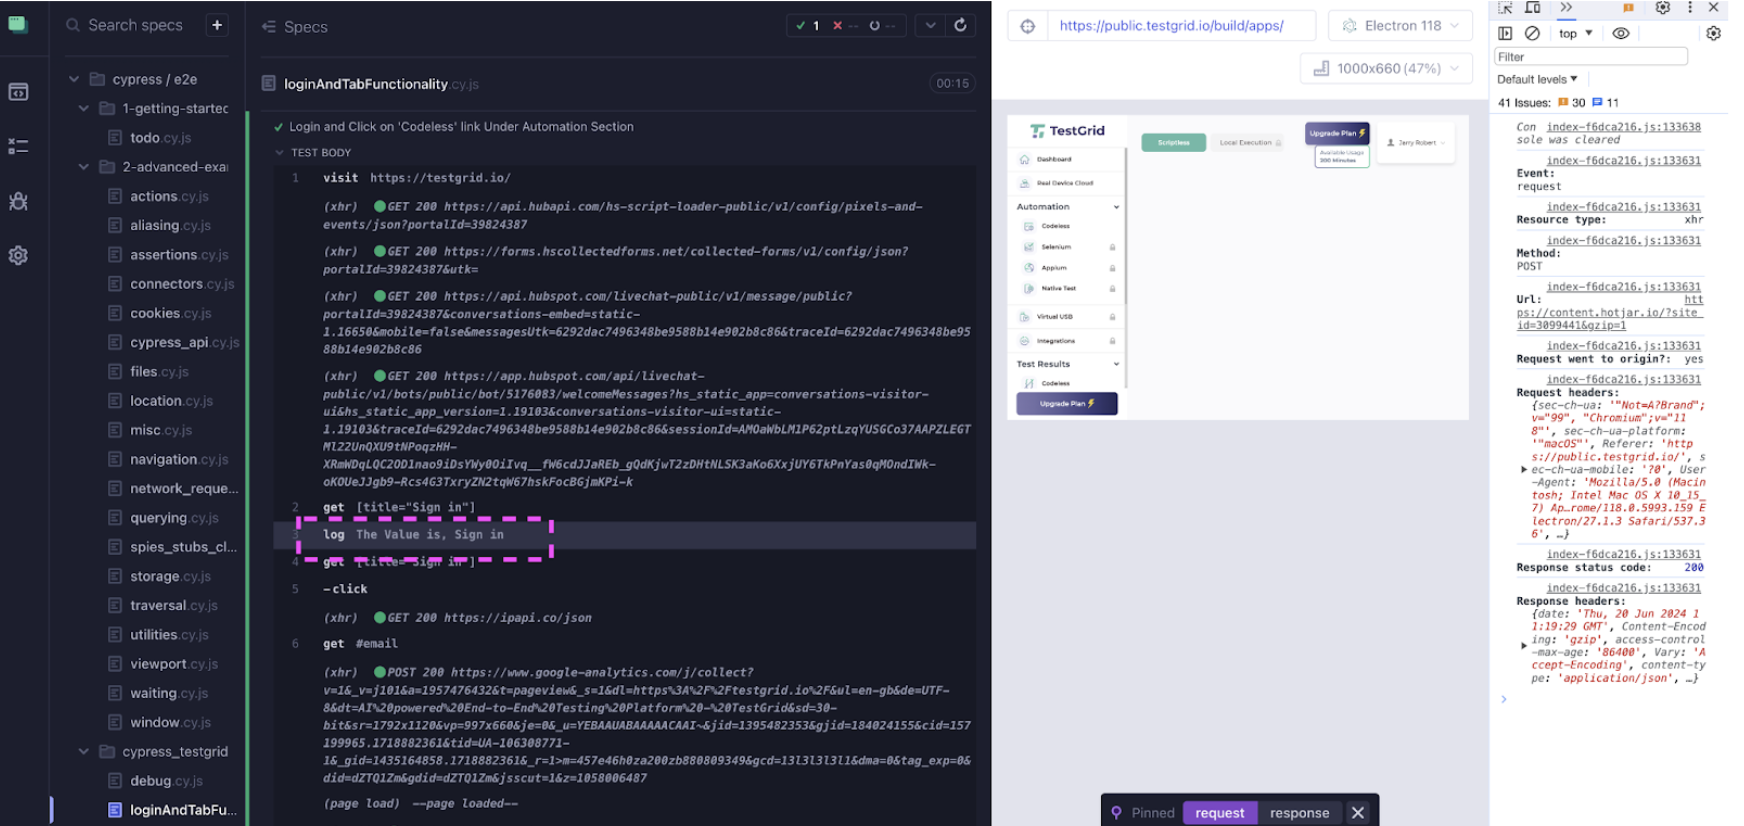
Below is the output of the above code where you can see that in the command log, logs are printed that are really helpful in debugging.
Cypress Debugging Using console.log()
In Cypress, console.log() can be used to print messages to the browser’s console for debugging purposes.
Here is an example of how to use console.log():
cy.get(‘.element’).then(($el) => {
console.log(‘Element:’, $el);
});
Benefits
- Directly outputs messages to the browser’s console
- Helps in debugging more complex JavaScript code
In the code below, you can see we are printing the text of the sign-in link on the home page in the console window.
/// <reference types="cypress" />
describe("Verify Login/Logout And Tab functionality", () => {
 it("Login and Click on 'Codeless' link Under Automation Section", function () {
 cy.visit("https://testgrid.io/");
 cy.get('[title="Sign in"]').then($signin => {
 console.log("Text of Sign-in button →> ",$signin.text())
 })
 cy.get('[title="Sign in"]').click();
 cy.get("#email").clear("jarryliurobert@gmail.com").type("jarryliurobert@gmail.com");

 cy.get("#password").clear().type("Test@1234")
 cy.get(".signin-button").click();
 cy.contains("Dashboard");
 cy.get("#tgtestcase").click();
 cy.contains("Lets get you started with codeless");
 cy.get("[data-toggle='dropdown']").click();
 cy.contains("Logout").click();
 cy.contains("Forgot Password?");
 });
});
Cypress Debugging Using Native debugger
The native JavaScript debugger statement can be used within Cypress tests to set a breakpoint in the code. When the debugger statement is reached, execution will pause and the browser’s developer tools will open.
- NOTE: For native
debuggercommands to execute we have to keep the source window of the browser open where test cases are executing.
cy.get('.element').then(($el) => {
 debugger;
 // inspect $el in the console
});
Benefits
- Allows you to set breakpoints to your code: This makes it easier to step through your code line-by-line and observe the exact behavior and state of your application at each step.
- Full access to the browser’s debugging tools
In the code below, you can see we have put a native debugger after opening the URL https://testgrid.io/.
/// <reference types="cypress" />
describe("Verify Login/Logout And Tab functionality", () => {
 it("Login and Click on 'Codeless' link Under Automation Section", function () {
 cy.visit("https://testgrid.io/");
 cy.get('[title="Sign in"]').then($signin => {
 debugger;
 console.log("Text of Sign-in button →> ",$signin.text())
 })
 cy.get('[title="Sign in"]').click();
 cy.get("#email").clear("jarryliurobert@gmail.com").type("jarryliurobert@gmail.com");

 cy.get("#password").clear().type("Test@1234")
 cy.get(".signin-button").click();
 cy.contains("Dashboard");
 cy.get("#tgtestcase").click();
 cy.contains("Lets get you started with codeless");
 cy.get("[data-toggle='dropdown']").click();
 cy.contains("Logout").click();
 cy.contains("Forgot Password?");
 });
});
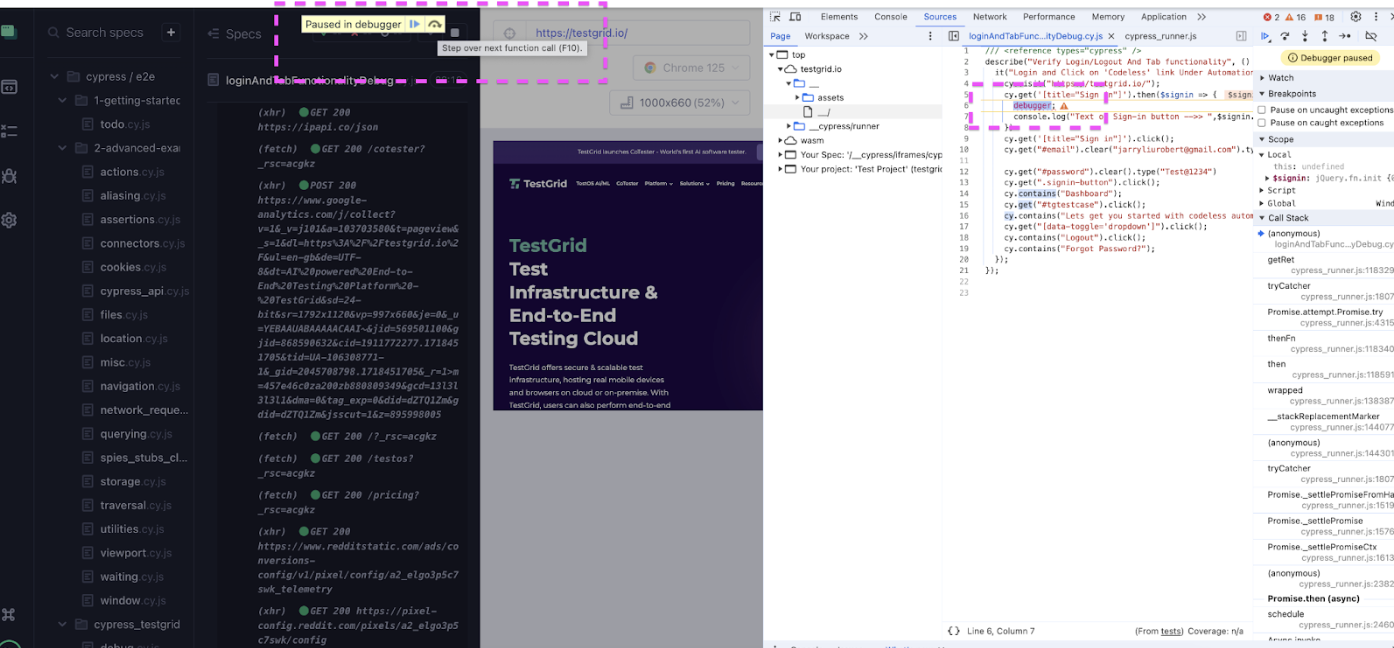
In the screenshot below, the test run will pause as soon as it encounters the debugger keyword. We can either move to the next line by clicking on step over or resume the script by clicking on the first icon in the highlighted area.
Cypress Debugging Using Screenshot and Video
By capturing screenshots and videos, we can take advantage of debugging failing tests. This helps you quickly identify issues by visualizing the exact state of the application at the time of failure.
We have to update the cypress.config.js file to enable screenshots and videos.
Cypress comes with the option to take screenshots when you run the test cases via ‘cypress open’ or ‘cypress run’, even in CI/CD. We have to update the setting screenshotOnRunFailure: true. This setting will capture the screenshot when test cases fail.
Video recording is turned off by default but can be enabled by setting the video option to true in your configuration file. Videos will not be recorded while Cypress is open.
const { defineConfig } = require("cypress");
module.exports = defineConfig({
 "screenshotsFolder": "cypress/screenshots",
 "screenshotOnRunFailure": true,
 "video": true,
 "trashAssetsBeforeRun": true,
 "videosFolder": "cypress/videos",
 "videoCompression": 32,
 e2e: {

 experimentalStudio:true,
 setupNodeEvents(on, config) {
 // implement node event listeners here
 },
 },
});
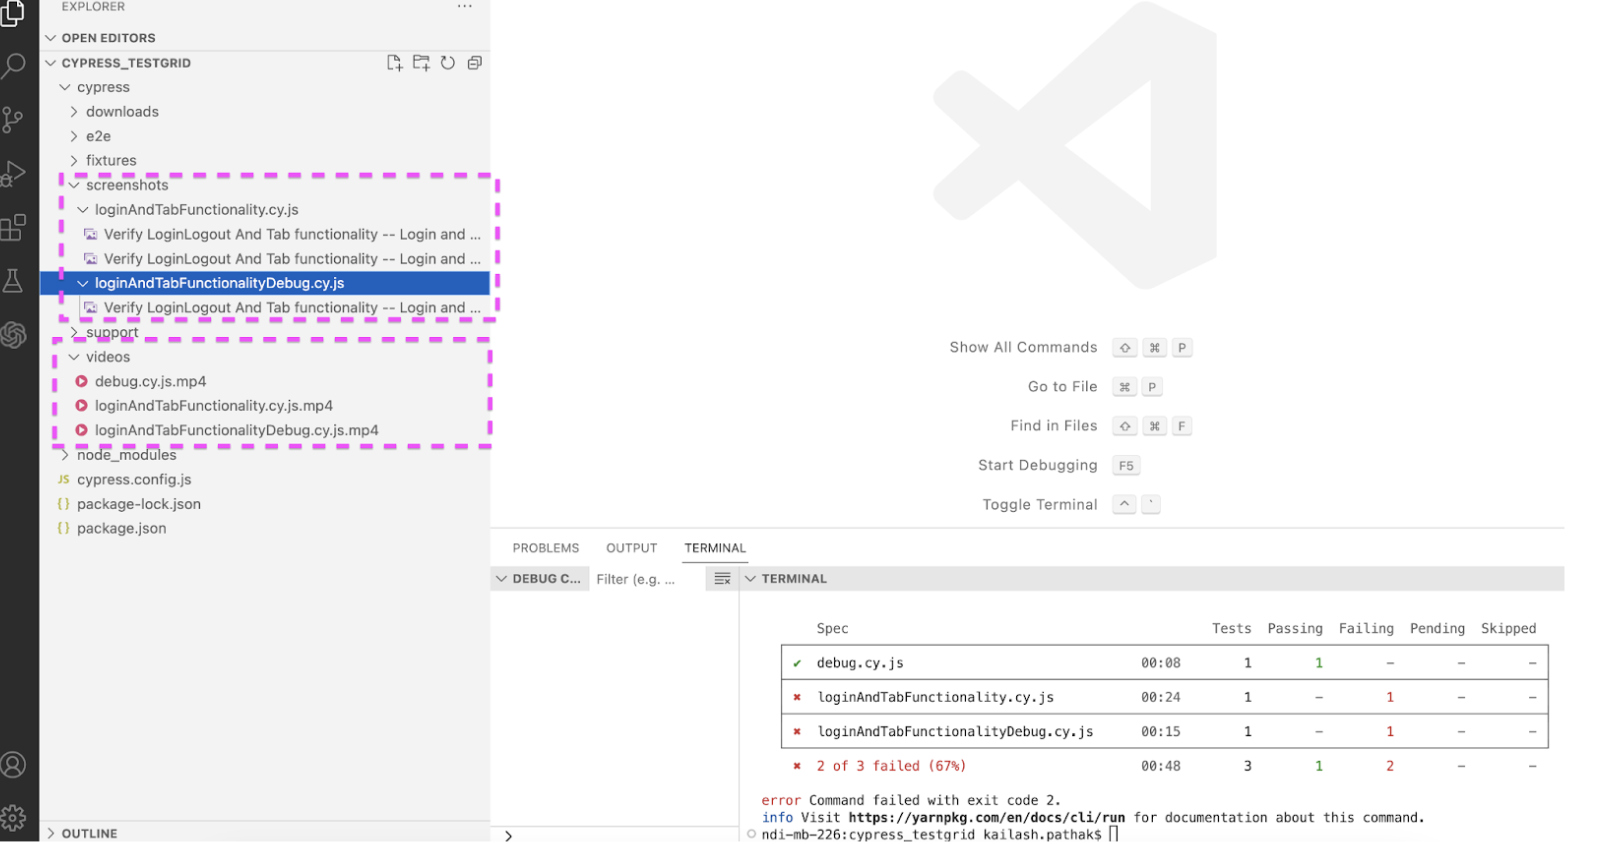
In the screenshot below, you can see two folders have been created with the names "screenshots" and "videos," where we can see the attached screenshot and video that help in debugging the test cases.
Conclusion
Cypress offers a comprehensive set of debugging tools that can significantly streamline the process of identifying and resolving issues in your test cases. Whether you are leveraging command logs for a detailed step-by-step account, using .pause() to halt execution, employing .debug() for in-depth inspection, or utilizing cy.log() and console.log() for custom messages, Cypress provides versatile methods to suit various debugging needs.
Published at DZone with permission of Kailash Pathak. See the original article here.
Opinions expressed by DZone contributors are their own.
Comments