Developing Your Visualization Plugin for Grafana
Learn how to set up and develop a data visualization plugin to extend the functionality of Grafana for monitoring.
Join the DZone community and get the full member experience.
Join For FreeGrafana is a nice tool for monitoring and visualizing time series data from many popular datasources. I would to introduce key concepts about plugins so you can start to create your own to make a time series visualization or extend Grafana's functionality.
What Is a Plugin? A Technical Point of View
Grafana 5.x is a Angular app v 1.6.6 with some React.js inside. A plugin is a an Angular controller located in data/plugins/your-module/dist/module.js which is loaded by SystemJS and plugin.json with metadata like name, id, icons, etc.
Setting Up the Plugin Project
If don't have Grafana on your host, install it and run bin/grafana-server. You should see the folder $GRAFANA_PATH/data.
I recommend using the webpack template. There is more info in the Readme about why this is better. It is mentioned in the official documentation. You need to install npm to continue.
cd $GRAFANA_PATH/data/plugins
git clone https://github.com/CorpGlory/grafana-plugin-template-webpack.git
cd grafana-plugin-template-webpack
npm install
npm run build
You need to restart the Grafana server and see this new line in the logs:
INFO[05-17|06:08:46] Registering plugin logger=plugins name="Plugin Template Name"
Now open http://localhost:3000 , click and sign a new logo to create a new dashboard, and there you will see a menu with the name Plugin Template Name . Click on it and see something like this:
Hacking the Code
Open the file src/module.js; this is the entry point. Grafana loads the Angular controller expecting an instance of PanelCtrl, which we export in the end of the file with export { Ctrl as PanelCtrl }. You are working in Grafana's environment and you can import many features, like import {...} from grafana/*
Let's change the constructor like this:
constructor($scope, $injector) {
  super($scope, $injector);
  console.log('hello from console');
}
To recompile the source, use npm run dev for faster development. Don't forget about the Grafana cache. It can't just reload your changes. By the way, you don't need to restart Grafana's server to see the updates. There is a video below on YouTube where I explain how the build system works.
Your class is Angular controller and you can use link(scope, element) . Write console.log(element) inside the method to see the html holder for your plugin.
Getting Data From a Metrics Query
Our controller is a child of PanelCtrl. Let's change it to MetricsPanelCtrl, which is also is a child of PanelCtrl. If you open edit mode of the panel, you will notice a new tab:
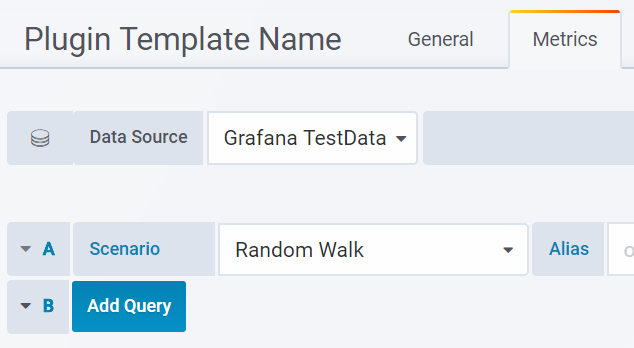
I used GrafanaTestData here.
Now let's change our controller constructor:
  constructor($scope, $injector) {
    super($scope, $injector);
    this.events.on('data-received', this._onDataReceived.bind(this));
  }

  _onDataReceived(data) {
    console.log(data);
  }
We use the this.events object we got from MetricsPanelCtrl. We subscribe to the event data-received. See the source code to learn more features.
Reload the dasboard and see a nice object with data in JavaScript logs. Now you can make a fancy visualization using d3.js, for example.
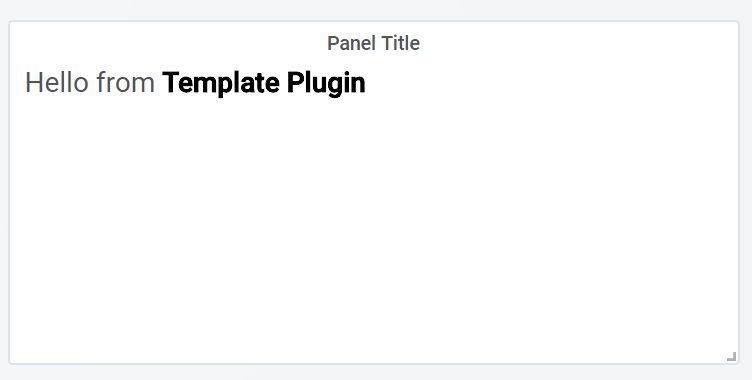
Now let's change the html template to see some dynamic data:
constructor($scope, $injector) {
  super($scope, $injector);
  this.message = "nice!";
}
and change partials/template.html like this:
<div class="hello">
  Hello from <b>Template Plugin</b> {{ ctrl.message }}
</div>
Other
I suggest reading the official docs and check out plugins made on this template, grafana-progress-list and hastic-grafana-graph-panel, to learn more about Grafana features you can use, like plugin.json file assets. I also suggest using TypeScript and not using Angular directive because of collisions. We are moving to using componens and React.js (but not only). Please leave comments with your thoughts.
Also, there is a video tutorial about plugin creation with more useful details and bad sound and another one, explaining debugging in VSCode.
Thanks to Alexandr Zobnin for your help with making with post.
Opinions expressed by DZone contributors are their own.
Comments