Enterprise-Grade Distributed JMeter Load Testing on Kubernetes: A Scalable, CI/CD-Driven DevOps Approach
Run distributed JMeter load tests on Kubernetes environments with CI/CD integration, auto-scaling, and real-time monitoring using InfluxDB and Grafana.
Join the DZone community and get the full member experience.
Join For FreeApplication performance, scalability, and resilience are critical for ensuring a seamless user experience. Apache JMeter is a powerful open-source tool for load testing, but running it on a single machine limits scalability, automation, and distributed execution.
This blog presents a Kubernetes-powered JMeter setup on Azure Kubernetes Service (AKS), which can also be deployed on other cloud platforms like AWS EKS and Google GKE, integrated with CI/CD pipelines in Azure DevOps. This approach enables dynamic scaling, automated test execution, real-time performance monitoring, and automated reporting and alerting.
Key Benefits of JMeter on AKS
- Run large-scale distributed load tests efficiently
- Auto-scale worker nodes dynamically based on traffic
- Automate test execution and result storage with CI/CD
- Monitor performance in real-time using InfluxDB & Grafana
- Generate automated reports and notify teams via email
This guide follows a Kubernetes-native approach, leveraging:
- ConfigMaps for configuration management
- Deployments for master and worker nodes
- Services for inter-node communication
- Horizontal Pod Autoscaler (HPA) for dynamic scaling
While this guide uses Azure DevOps as an example, the same approach can be applied to other CI/CD tools like Jenkins, GitHub Actions, or any automation framework with minimal modifications. For CI/CD integration, the same setup can be adapted for Jenkins, GitHub Actions, or any other CI/CD tool. Additionally, this JMeter setup is multi-cloud compatible, meaning it can be deployed on AWS EKS, Google GKE, or any Kubernetes environment.
To fully automate the JMeter load simulation process, we integrate it with CI/CD pipelines, ensuring tests can be triggered on every code change, scheduled runs, or manually, while also enabling automated reporting and alerting to notify stakeholders of test results.
What This Guide Covers
- Service Connection Setup – Authenticate AKS using Azure Service Principal.
- CI Pipeline Setup – Validate JMeter test scripts upon code commits.
- CD Pipeline Setup – Deploy and execute JMeter tests in a scalable environment.
- Performance Monitoring – Using InfluxDB and Grafana for real-time observability.
- Automated Reporting & Alerts – Convert JTL reports into HTML, extract key metrics, and send email notifications.
- Best Practices – Managing secrets securely and optimizing resource usage.
If your system fails under heavy traffic, it could mean revenue loss, poor user experience, or even security risks. Traditional performance testing tools work well for small-scale tests, but what if you need to simulate thousands of concurrent users across multiple locations?
This is where Kubernetes-powered JMeter comes in! By deploying JMeter on Azure Kubernetes Service (AKS) and integrating it with CI/CD Pipelines, we can:
- Run large-scale distributed tests efficiently
- Scale worker nodes dynamically based on load
- Automate the entire process, from deployment to reporting and result analysis
Key Challenges with Traditional JMeter Execution
Limitations of Running JMeter on a Single Machine
- Resource bottlenecks – Can’t simulate real-world distributed loads.
- Manual execution – No automation or CI/CD integration.
- Scalability issues – Hard to scale up or down dynamically.
- Data management – Handling large test datasets is cumbersome.
|
Challenge |
JMeter on Local Machine |
JMeter on AKS |
|
Scalability |
Limited by CPU/memory |
Auto-scales with HPA |
|
Automation |
Manual test execution |
CI/CD pipelines for automation |
|
Parallel Execution |
Hard to distribute |
Kubernetes distributes the load |
|
Observability |
No centralized monitoring |
Grafana + InfluxDB integration |
|
Cost Efficiency |
Wasted resources |
On-demand scaling |
By deploying JMeter on AKS, we eliminate bottlenecks and achieve scalability, automation, and observability.
JMeter Architecture on AKS
A distributed JMeter deployment consists of:
- JMeter Master Pod – Orchestrates test execution.
- JMeter Worker Pods (Slaves) – Generate the actual load.
- JMeter Service – Enables inter-pod communication.
- InfluxDB – Stores real-time performance metrics.
- Grafana – Visualizes test execution.
- Azure File Storage – Stores test logs and results.
- Horizontal Pod Autoscaler (HPA) – Adjusts worker count based on CPU utilization.

Figure 1: JMeter Distributed Load Testing Architecture on Azure Kubernetes Service (AKS), showing how the Master node orchestrates tests, Worker Pods generate load, and InfluxDB/Grafana monitor performance.
Adding Real-World Use Cases
To make the blog more relatable, let’s add examples of industries that benefit from scalable performance testing.
- E-commerce & Retail: Load testing before Black Friday & holiday sales.
- Banking & FinTech: Ensuring secure, high-performance online banking.
- Streaming Platforms: Handling millions of concurrent video streams.
- Healthcare Apps: Load-testing telemedicine platforms during peak hours.
- Gaming & Metaverse: Performance testing multiplayer online games.
Optimizing Costs When Running JMeter on AKS
Running JMeter on Azure Kubernetes Service (AKS) is powerful, but without optimization, it can get expensive. Let’s add a section on cost-saving strategies:
- Use Spot Instances for Non-Critical Tests
- Auto-Scale JMeter Worker Nodes Based on Load
- Schedule Tests During Non-Peak Hours to Save Costs
- Monitor and Delete Unused Resources After Test Execution
- Optimize Log Storage – Avoid Keeping Large Log Files on AKS
Deploying JMeter on AKS
Prerequisites
Ensure you have: Azure subscription with AKS configured. kubectl and helm installed. JMeter Docker images for master and worker nodes. JMX test plans and CSV datasets for load execution. Azure Service Principal for CI/CD automation.
Creating JMeter Docker Images
Your setup requires different Dockerfiles for the JMeter Master and JMeter Worker (Slave) nodes.
Dockerfile - JMeter Master
FROM ubuntu:latest
RUN apt-get update && apt-get install -y openjdk-11-jdk wget unzip
WORKDIR /jmeter
RUN wget https://downloads.apache.org//jmeter/binaries/apache-jmeter-5.5.tgz && \
    tar -xzf apache-jmeter-5.5.tgz && rm apache-jmeter-5.5.tgz
CMD ["/jmeter/apache-jmeter-5.5/bin/jmeter"]
Dockerfile - JMeter Worker (Slave)
FROM ubuntu:latest
RUN apt-get update && apt-get install -y openjdk-11-jdk wget unzip
WORKDIR /jmeter
RUN wget https://downloads.apache.org//jmeter/binaries/apache-jmeter-5.5.tgz && \
    tar -xzf apache-jmeter-5.5.tgz && rm apache-jmeter-5.5.tgz
CMD ["/bin/bash"]
Once built and pushed to Azure Container Registry, these images will be used in Kubernetes deployments.
Deploying InfluxDB for Performance Monitoring
To capture real-time test results, deploy InfluxDB, which stores metrics from JMeter.
File: jmeter_influxdb_configmap.yaml
apiVersion: v1
kind: ConfigMap
metadata:
  name: influxdb-config
  labels:
    app: influxdb-jmeter
data:
  influxdb.conf: |
    [meta]
      dir = "/var/lib/influxdb/meta"
    [data]
      dir = "/var/lib/influxdb/data"
      engine = "tsm1"
      wal-dir = "/var/lib/influxdb/wal"
    [[graphite]]
    enabled = true
    bind-address = ":2003"
    database = "jmeter"
File: jmeter_influxdb_deploy.yaml
apiVersion: apps/v1
kind: Deployment
metadata:
  name: influxdb-jmeter
  labels:
    app: influxdb-jmeter
spec:
  replicas: 1
  selector:
    matchLabels:
      app: influxdb-jmeter
  template:
    metadata:
      labels:
        app: influxdb-jmeter
    spec:
      containers:
      - image: influxdb
        name: influxdb
        volumeMounts:
        - name: config-volume
          mountPath: /etc/influxdb
        ports:
        - containerPort: 8086
      volumes:
      - name: config-volume
        configMap:
          name: influxdb-config
File: jmeter_influxdb_svc.yaml
apiVersion: v1
kind: Service
metadata:
  name: jmeter-influxdb
  labels:
    app: influxdb-jmeter
spec:
  ports:
    - port: 8086
      name: api
      targetPort: 8086
  selector:
    app: influxdb-jmeter
Deployment Command
kubectl apply -f jmeter_influxdb_configmap.yaml
kubectl apply -f jmeter_influxdb_deploy.yaml
kubectl apply -f jmeter_influxdb_svc.yaml
Verify InfluxDB
kubectl get pods -n <namespace-name> | grep influxdbDeploying Jmeter Master and Worker Nodes with Autoscaling
Creating ConfigMap for JMeter Master - A ConfigMap is used to configure the JMeter master node.
File: jmeter_master_configmap.yaml
apiVersion: v1
kind: ConfigMap
metadata:
  name: jmeter-load-test
  labels:
    app: jmeter
data:
  load_test: |
    #!/bin/bash
    /jmeter/apache-jmeter-*/bin/jmeter -n -t $1 -Dserver.rmi.ssl.disable=true -R $(getent ahostsv4 jmeter-slaves-svc | awk '{print $1}' | paste -sd ",")
This script:
- Runs JMeter in non-GUI mode (-n).
- Disables RMI SSL for inter-pod communication.
- Dynamically resolves JMeter slave IPs.
Deploying JMeter Master Nodes
File: jmeter_master_deploy.yaml
apiVersion: apps/v1
kind: Deployment
metadata:
  name: jmeter-master
  labels:
    app: jmeter-master
spec:
  replicas: 1
  selector:
    matchLabels:
      app: jmeter-master
  template:
    metadata:
      labels:
        app: jmeter-master
    spec:
      serviceAccountName: <Service Account Name>
      containers:
      - name: jmeter-master
        image: <your-jmeter-master-image>
        imagePullPolicy: IfNotPresent
        command: [ "/bin/bash", "-c", "--" ]
        args: [ "while true; do sleep 30; done;" ]
        volumeMounts:
          - name: loadtest
            mountPath: /jmeter/load_test
            subPath: "load_test"
          - name: azure
            mountPath: /mnt/azure/jmeterresults
        ports:
        - containerPort: 60000
      volumes:
      - name: loadtest
        configMap:
          name: jmeter-load-test
          defaultMode: 0777
      - name: azure
        azureFile:
          secretName: files-secret
          shareName: jmeterresults
          readOnly: false
This ensures:
- ConfigMap-based test execution
- Persistent storage for test results
- The master node is always available
Deploying JMeter Worker Nodes
File: jmeter_slaves_deploy.yaml
apiVersion: apps/v1
kind: Deployment
metadata:
  name: jmeter-slaves
  labels:
    app: jmeter-slave
spec:
  replicas: 2  # Initial count, will be auto-scaled
  selector:
    matchLabels:
      app: jmeter-slave
  template:
    metadata:
      labels:
        app: jmeter-slave
    spec:
      serviceAccountName: <Service Account Name>
      containers:
      - name: jmeter-slave
        image: <your-jmeter-worker-image>
        imagePullPolicy: IfNotPresent
        volumeMounts:
          - name: azure
            mountPath: /mnt/azure/jmeterresults
        ports:
        - containerPort: 1099
        - containerPort: 50000
      volumes:
      - name: azure
        azureFile:
          secretName: files-secret
          shareName: jmeterresults
          readOnly: false
Worker pods dynamically join the JMeter master and execute tests.
Creating JMeter Worker Service
File: jmeter_slaves_svc.yaml
apiVersion: v1
kind: Service
metadata:
  name: jmeter-slaves-svc
  labels:
    app: jmeter-slave
spec:
  clusterIP: None  # Headless service for inter-pod communication
  ports:
    - port: 1099
      targetPort: 1099
    - port: 50000
      targetPort: 50000
  selector:
    app: jmeter-slave
This enables JMeter master to discover worker nodes dynamically.
Enabling Auto-Scaling for JMeter Workers
File: jmeter_hpa.yaml
apiVersion: autoscaling/v2
kind: HorizontalPodAutoscaler
metadata:
  name: jmeter-slaves-hpa
spec:
  scaleTargetRef:
    apiVersion: apps/v1
    kind: Deployment
    name: jmeter-slaves
  minReplicas: 2
  maxReplicas: 10
  metrics:
  - type: Resource
    resource:
      name: cpu
      target:
        type: Utilization
        averageUtilization: 70
Deploying All Components command
Run the following command to deploy all components:
kubectl apply -f jmeter_master_configmap.yaml
kubectl apply -f jmeter_master_deploy.yaml
kubectl apply -f jmeter_slaves_deploy.yaml
kubectl apply -f jmeter_slaves_svc.yaml
kubectl apply -f jmeter_hpa.yaml
To verify deployment:
kubectl get all -n <namespace-name>
kubectl get hpa -n <namespace-name>
kubectl get cm -n <namespace-name>
Adding More Depth to Monitoring & Observability
Performance testing is not just about running the tests—it’s about analyzing the results effectively.
- Using InfluxDB for Test Data Storage
- Creating Grafana Dashboards to Visualize Trends
- Integrating Azure Monitor & Log Analytics for Deeper Insights
Example: Grafana Metrics for JMeter Performance
|
Metric |
Description |
|
Response Time |
Measures how fast the system responds |
|
Throughput |
Requests per second handled |
|
Error Rate |
Percentage of failed requests |
|
CPU & Memory Usage |
Tracks AKS node utilization |
Deploying Grafana for Visualizing Test Results
Once InfluxDB is running, configure Grafana to visualize the data.
File: dashboard.sh
#!/usr/bin/env bash
working_dir=`pwd`
tenant=`awk '{print $NF}' $working_dir/tenant_export`
grafana_pod=`kubectl get po -n $tenant | grep jmeter-grafana | awk '{print $1}'`
kubectl exec -ti -n $tenant $grafana_pod -- curl 'http://admin:[email protected]:3000/api/datasources' -X POST -H 'Content-Type: application/json;charset=UTF-8' --data-binary '{"name":"jmeterdb","type":"influxdb","url":"http://jmeter-influxdb:8086","access":"proxy","isDefault":true,"database":"jmeter","user":"admin","password":"admin"}'
Run Dashboard Script
chmod +x dashboard.sh
./dashboard.sh
Automating Cluster Cleanup
Once tests are complete, automate cleanup to free up resources.
File: jmeter_cluster_delete.sh
#!/usr/bin/env bash
clustername=$1
tenant=<namespace-name>
echo "Deleting ConfigMaps"
kubectl delete -n $tenant configmap jmeter-${clustername}-load-test
echo "Deleting Jmeter Slaves"
kubectl delete deployment.apps/jmeter-${clustername}-slaves
kubectl delete service/jmeter-${clustername}-slaves-svc
echo "Deleting Jmeter Master"
kubectl delete deployment.apps/jmeter-${clustername}-master
kubectl get -n $tenant all
Run Cleanup
chmod +x jmeter_cluster_delete.sh
./jmeter_cluster_delete.sh <clustername>
Running JMeter Tests
Run a JMeter load test by executing the following in the master pod:
kubectl exec -ti jmeter-master -- /jmeter/load_test /mnt/azure/testplans/test.jmx -Gusers=100 -Gramp=10This runs the test with:
- 100 concurrent users
- 10-second ramp-up period
Monitor Performance in Grafana
- Open Grafana UI (http://<Grafana-IP>:3000).
- View real-time results under the JMeter Dashboard.
Stopping the JMeter Test
To stop an active test:
kubectl exec -ti jmeter-master -- /jmeter/apache-jmeter-5.5/bin/stoptest.shAutomating JMeter Load Testing Using CI/CD Pipeline in Azure DevOps
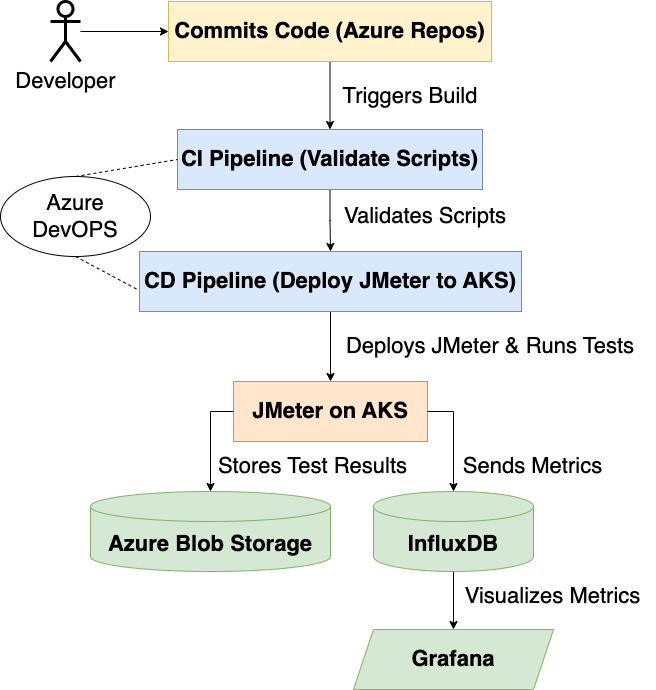
Figure 2: The CI/CD pipeline in Azure DevOps for automating JMeter execution, validating scripts, deploying to AKS, and storing results in Azure Blob Storage.
Prerequisites for CI/CD in Azure DevOps
Before creating the pipelines, ensure:
- Service Connection for AKS is set up using Azure App Registration / Service Principal with permissions to interact with AKS.
- Azure DevOps Agent (Self-hosted or Microsoft-hosted) is available to run the pipeline.
- Variable Groups & Key Vault Integration are configured for secure secrets management.
Setting up Service Connection for AKS
Create a Service Principal in Azure:az ad sp create-for-rbac --name "aks-service-connection" --role Contributor --scopes /subscriptions/<subscription-id>
- Go to Azure DevOps → Project Settings → Service Connections.
- Add a new Kubernetes Service Connection and authenticate using the Service Principal.
Verify access using:az aks get-credentials --resource-group <resource-group> --name <aks-cluster>
Setting Up CI/CD Pipelines for JMeter in Azure DevOps
We will create two pipelines:
- CI Pipeline (Continuous Integration): Triggers when a commit happens and validates JMeter scripts.
- CD Pipeline (Continuous Deployment): Deploys JMeter to AKS and executes tests.
Implementing the CI Pipeline (Validate JMeter Test Scripts)
The CI pipeline will:
- Validate JMeter test scripts (.jmx)
- Check syntax and correctness
Created File: azure-pipelines-ci.yml
trigger:
  branches:
    include:
      - main
pool:
  vmImage: 'ubuntu-latest'
steps:
  - checkout: self
  - task: UsePythonVersion@0
    inputs:
      versionSpec: '3.x'
  - script: |
      echo "Validating JMeter Test Scripts"
      jmeter -n -t test_plan.jmx -l test_log.jtl
    displayName: "Validate JMeter Test Plan"
Pipeline Execution:
- Saves logs (test_log.jtl) for debugging.
- Ensures no syntax errors before running tests in the CD pipeline.
Implementing the CD Pipeline (Deploy & Execute JMeter Tests on AKS)
The CD pipeline:
- Pulls the validated JMeter scripts.
- Deploys JMeter to AKS.
- Scales up worker nodes dynamically.
- Executes JMeter tests in distributed mode.
- Generates test reports and stores them in Azure Storage.
Create File: azure-pipelines-cd.yml
trigger:
  - main
pool:
  name: 'Self-hosted-agent'  # Or use 'ubuntu-latest' for Microsoft-hosted agents
variables:
  - group: "jmeter-variable-group"  # Fetch secrets from Azure DevOps Variable Group
stages:
  - stage: Deploy_JMeter
    displayName: "Deploy JMeter on AKS"
    jobs:
      - job: Deploy
        steps:
          - checkout: self
          - task: AzureCLI@2
            displayName: "Login to Azure and Set AKS Context"
            inputs:
              azureSubscription: "$(azureServiceConnection)"
              scriptType: bash
              scriptLocation: inlineScript
              inlineScript: |
                az aks get-credentials --resource-group $(aksResourceGroup) --name $(aksClusterName)
                kubectl config use-context $(aksClusterName)
          - script: |
              echo "Deploying JMeter Master and Worker Nodes"
              kubectl apply -f jmeter_master_deploy.yaml
              kubectl apply -f jmeter_slaves_deploy.yaml
              kubectl apply -f jmeter_influxdb_deploy.yaml
            displayName: "Deploy JMeter to AKS"
          - script: |
              echo "Scaling Worker Nodes for Load Test"
              kubectl scale deployment jmeter-slaves --replicas=5
            displayName: "Scale JMeter Workers"
  - stage: Execute_Load_Test
    displayName: "Run JMeter Load Tests"
    dependsOn: Deploy_JMeter
    jobs:
      - job: RunTest
        steps:
          - script: |
              echo "Executing JMeter Test Plan"
              kubectl exec -ti jmeter-master -- /jmeter/load_test /mnt/azure/testplans/test.jmx -Gusers=100 -Gramp=10
            displayName: "Run JMeter Load Test"
          - script: |
              echo "Fetching JMeter Test Results"
              kubectl cp jmeter-master:/mnt/azure/jmeterresults/results test-results
            displayName: "Copy Test Results"
          - task: PublishPipelineArtifact@1
            inputs:
              targetPath: "test-results"
              artifact: "JMeterTestResults"
              publishLocation: "pipeline"
            displayName: "Publish JMeter Test Results"
Understanding the CD Pipeline Breakdown
Step 1: Deploy JMeter on AKS
- Uses AzureCLI@2 to authenticate and set AKS context.
- Deploys JMeter Master, Worker nodes, and InfluxDB using YAML files.
Step 2: Scale Worker Nodes Dynamically
- Uses kubectl scale to scale JMeter Worker pods based on test load.
Step 3: Execute JMeter Load Test
Runs the test using:kubectl exec -ti jmeter-master -- /jmeter/load_test /mnt/azure/testplans/test.jmx -Gusers=100 -Gramp=10
This triggers distributed execution.
Step 4: Fetch & Publish Results
- Copies test results from JMeter Master pod.
- Publish the results as an artifact in Azure DevOps.
Managing Secrets & Variables Securely
To prevent exposing credentials:
- Use Variable Groups to store AKS names, resource groups, and secrets.
- Azure Key Vault Integration for storing sensitive information.
variables:
  - group: "jmeter-variable-group"
Or directly use:
- task: AzureKeyVault@1
  inputs:
    azureSubscription: "$(azureServiceConnection)"
    KeyVaultName: "my-keyvault"
    SecretsFilter: "*"
Security Considerations in CI/CD Pipelines
When integrating JMeter tests in Azure DevOps CI/CD Pipelines, security should be a priority.
- Use Azure Key Vault for Storing Secrets
- task: AzureKeyVault@1
  inputs:
    azureSubscription: "$(azureServiceConnection)"
    KeyVaultName: "my-keyvault"
SecretsFilter: "*"- Limit AKS Access Using RBAC Policies
- Encrypt Test Data and Credentials
- Monitor Pipeline Activities with Azure Security Center
Automating Test Cleanup After Execution
To free up AKS resources, the pipeline should scale down workers' post-test.
Modify azure-pipelines-cd.yml
 - script: |
      echo "Scaling Down JMeter Workers"
      kubectl scale deployment jmeter-slaves --replicas=1
    displayName: "Scale Down Workers After Test"
Best Practices for JMeter on AKS and CI/CD in Azure DevOps
1. Optimizing Performance and Scaling
- Optimize Auto-Scaling – Use HPA (Horizontal Pod Autoscaler) to dynamically adjust JMeter worker nodes.
- Optimize Worker Pods – Assign proper CPU and memory limits to avoid resource exhaustion.
- Store Results in Azure Storage – Prevent overload by saving JMeter logs in Azure Blob Storage.
- Automate Cleanup – Scale down JMeter workers post-test to save costs.
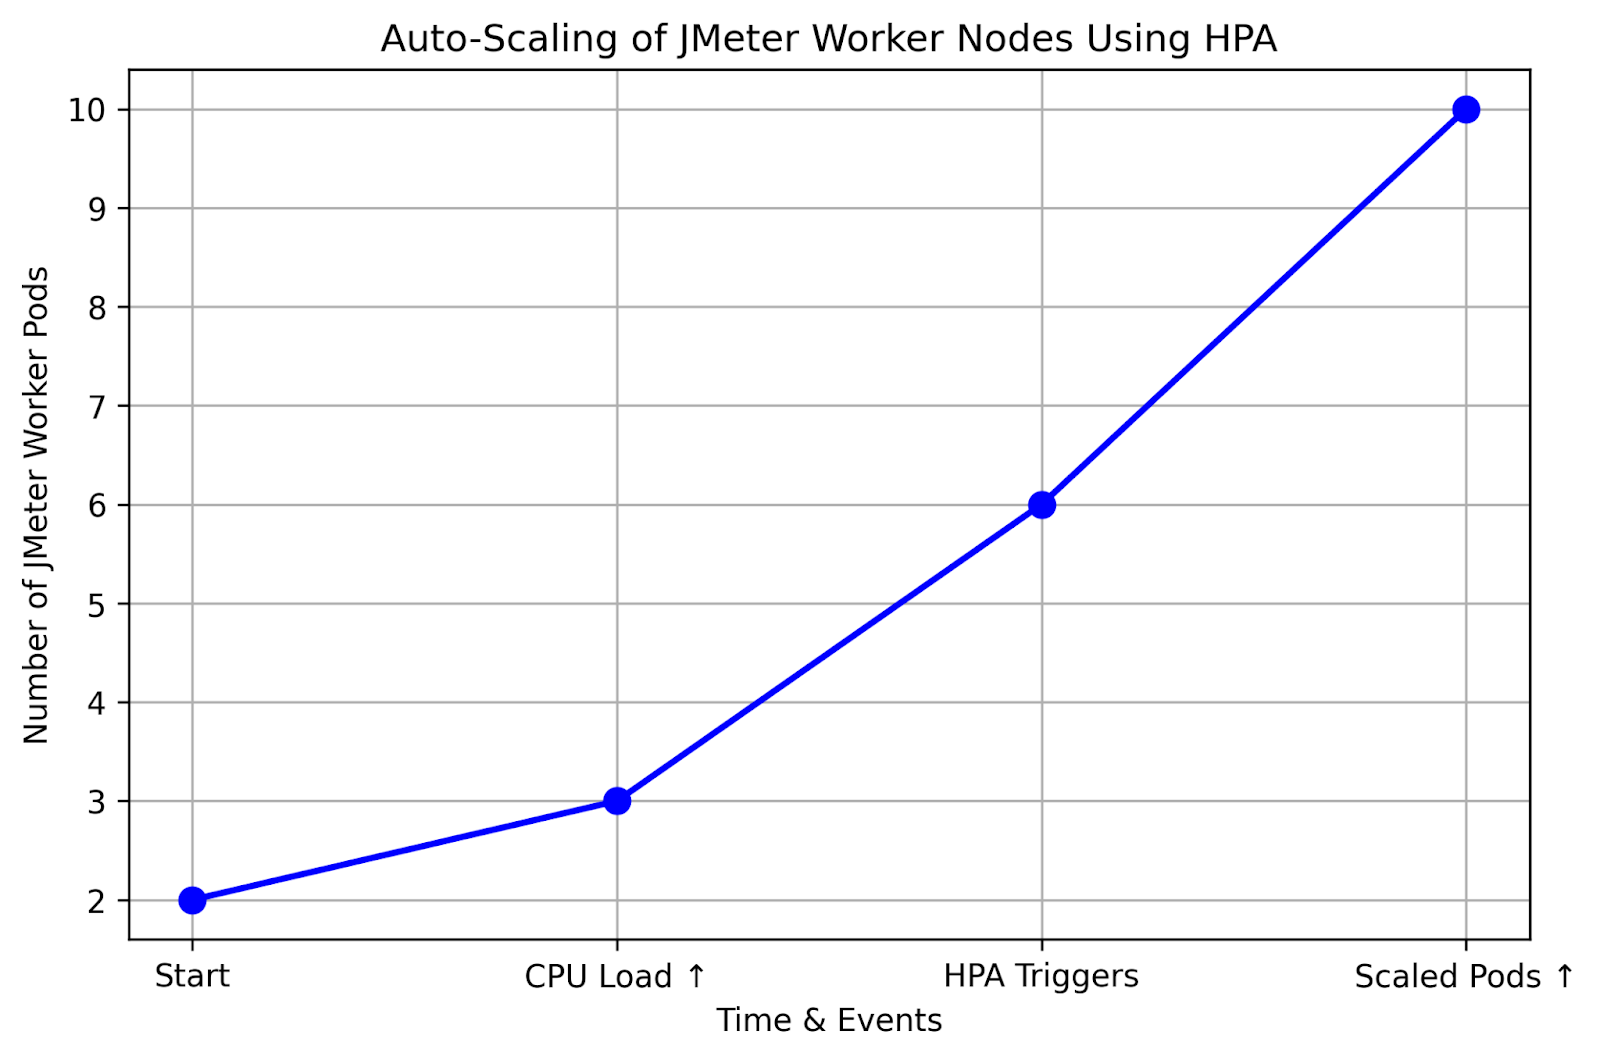
Figure 3: Auto-Scaling of JMeter Worker Nodes using Horizontal Pod Autoscaler (HPA) in Azure Kubernetes Service (AKS), dynamically adjusting pod count based on CPU usage.
2. Monitoring and Observability
- Monitor Performance – Use InfluxDB + Grafana for real-time analysis.
- Use Azure Monitor & Log Analytics – Track AKS cluster health and performance.
- Integrate Grafana & Prometheus – (Optional) Provides visualization for live metrics.
- Automate Grafana Setup – Ensure seamless test monitoring and reporting.
- JMeter Logs & Metrics Collection – View live test logs using:
kubectl logs -f jmeter-master
3. Best Practices for CI/CD Automation
- Use Self-hosted Agents – Provides better control over pipeline execution.
- Leverage HPA for CI/CD Workloads – Automatically adjust pod count during load test execution.
- Automate Deployment – Use Helm charts or Terraform for consistent infrastructure setup.
- Use CI/CD Pipelines – Automate test execution in Azure DevOps Pipelines.
- Optimize Cluster Cleanup – Prevent unnecessary costs by cleaning up resources after execution.
4. Automating Failure Handling & Alerts
- Set Up Alerting for Test Failures – Automatically detect failures in JMeter tests and trigger alerts.
- Send Notifications to Slack, Teams, or Email when a test fails.
Example: Automated Failure Alerting
- script: |
    if grep -q "Assertion failed" test_log.jtl; then
      echo "Test failed! Sending alert..."
      curl -X POST -H "Content-Type: application/json" -d '{"text": "JMeter Test Failed! Check logs."}' <Slack_Webhook_URL>
    fi
  displayName: "Monitor & Alert for Failures"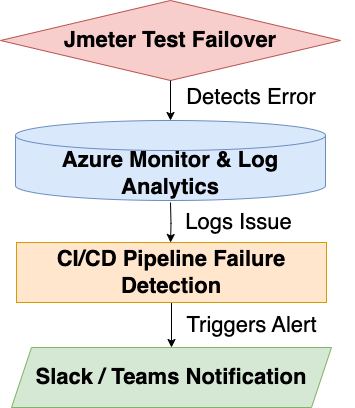
Figure 4: Automated failure detection and alerting mechanism for JMeter tests in Azure DevOps, utilizing Azure Monitor & Log Analytics for failure handling.
5. Steps for Automating JMeter Test Reporting & Email Notifications for JMeter Results
Once the CI/CD pipeline generates the JTL file, we can convert it into an HTML report.
Generate an HTML report from JTL:
jmeter -g results.jtl -o report/
This will create a detailed performance report inside the report/ directory.
Convert JTL to CSV (Optional):
awk -F, '{print $1, $2, $3, $4}' results.jtl > results.csv
This extracts key columns from results.jtl and saves them in results.csv.
Extracting Key Metrics from JTL
To summarize test results and send an email, extract key metrics like response time, error rate, and throughput.
Python script to parse results.jtl and summarize key stats:
import pandas as pd
def summarize_jtl_results(jtl_file):
    df = pd.read_csv(jtl_file)
    total_requests = len(df)
    avg_response_time = df["elapsed"].mean()
    error_count = df[df["success"] == False].shape[0]
    error_rate = (error_count / total_requests) * 100
    summary = f"""
    **JMeter Test Summary**
    ---------------------------------
    Total Requests: {total_requests}
    Avg Response Time: {avg_response_time:.2f} ms
    Error Count: {error_count}
    Error Rate: {error_rate:.2f} %
    ---------------------------------
    """
    return summary

# Example usage:
report = summarize_jtl_results("results.jtl")
print(report)
Sending JMeter Reports via Email
Once the report is generated, automate sending an email with the results.
Python script to send JMeter reports via email:
import smtplib
import os
from email.message import EmailMessage
def send_email(report_file, recipient):
    msg = EmailMessage()
    msg["Subject"] = "JMeter Test Report"
    msg["From"] = "[email protected]"
    msg["To"] = recipient
    msg.set_content("Hi,\n\nPlease find attached the JMeter test report.\n\nBest,\nPerformance Team")
    with open(report_file, "rb") as file:
        msg.add_attachment(file.read(), maintype="application", subtype="octet-stream", filename=os.path.basename(report_file))
    with smtplib.SMTP("smtp.example.com", 587) as server:
        server.starttls()
        server.login("[email protected]", "your-password")
        server.send_message(msg)

# Example usage:
send_email("report/index.html", "[email protected]")
Automating the Process in CI/CD Pipeline
Modify the azure-pipelines-cd.yml to Include Reporting & Emailing
- script: |
    echo "Generating JMeter Report"
    jmeter -g results.jtl -o report/
  displayName: "Generate JMeter HTML Report"
- script: |
    echo "Sending JMeter Report via Email"
    python send_email.py report/index.html [email protected]
  displayName: "Email JMeter Report"
This ensures:
- The JMeter test report is generated post-execution.
- The report is automatically emailed to stakeholders.
Conclusion
By leveraging JMeter on Kubernetes and CI/CD automation with Azure DevOps (or other CI/CD tools like Jenkins, GitHub Actions, etc.), you can ensure your applications are scalable, resilient, and cost-effective.
This guide covers the deployment and execution of JMeter on AKS, enabling distributed load testing at scale. By leveraging Kubernetes auto-scaling capabilities, this setup ensures efficient resource utilization and supports continuous performance testing with automated reporting and alerting.
This Kubernetes-native JMeter setup allows for scalable, cost-effective, and automated performance testing on Azure Kubernetes Service (AKS) but can also be deployed on AWS EKS, Google GKE, or any other Kubernetes environment. It integrates JMeter, Kubernetes, InfluxDB, and Grafana for scalable, automated, and observable performance testing, with automated email notifications and report generation.
Benefits of Automating JMeter Load Testing with CI/CD Pipelines
- End-to-end automation – From test execution to result storage and reporting.
- Scalability – JMeter runs are distributed across AKS worker nodes (or any Kubernetes cluster).
- Observability – Monitored via InfluxDB & Grafana with real-time insights.
- Automated Reporting – JTL test results are converted into HTML reports and sent via email notifications.
"With modern applications handling massive traffic, performance testing is no longer optional—it's a necessity. By leveraging JMeter on Kubernetes and CI/CD automation with Azure DevOps (or any CI/CD tool), you can ensure your applications are scalable, resilient, and cost-effective."
Key Takeaways:
- Automate Load Testing with Azure DevOps Pipelines (or Jenkins, GitHub Actions, etc.).
- Scale JMeter dynamically using Kubernetes & HPA across multi-cloud environments.
- Monitor & Analyze results with InfluxDB + Grafana in real time.
- Optimize Costs by using auto-scaling and scheduled tests.
- Enable Automated Reporting by sending test results via email notifications.
Next Step: Expanding Reporting & Alerting Mechanisms in CI/CD Pipelines, including AI-based anomaly detection for performance testing and predictive failure analysis. Stay tuned for advanced insights!
Take Action Today! Implement this setup in your environment—whether in Azure AKS, AWS EKS, or Google GKE—and share your feedback!
References
- Apache JMeter - Apache JMeterTM. (n.d.). https://jmeter.apache.org/
- Apache JMeter - User’s Manual: Best Practices. (n.d.). https://jmeter.apache.org/usermanual/best-practices.html
- Kubernetes documentation. (n.d.). Kubernetes. https://kubernetes.io/docs/
- Nickomang. (n.d.). Azure Kubernetes Service (AKS) documentation. Microsoft Learn. https://learn.microsoft.com/en-us/azure/aks/
- Chcomley. (n.d.). Azure DevOps documentation. Microsoft Learn. https://learn.microsoft.com/en-us/azure/devops/?view=azure-devops
- InfluxData. (2021, December 10). InfluxDB: Open Source Time Series Database | InfluxData. https://www.influxdata.com/products/influxdb/
- Grafana OSS and Enterprise | Grafana documentation. (n.d.). Grafana Labs. https://grafana.com/docs/grafana/latest/
- Apache JMeter - User’s Manual: Generating Dashboard Report. (n.d.). https://jmeter.apache.org/usermanual/generating-dashboard.html
Published at DZone with permission of Prabhu Chinnasamy. See the original article here.
Opinions expressed by DZone contributors are their own.
Comments