From 24 Hours to 2 Hours: How We Fixed a Broken BI System With Apache Airflow
Broken pipelines, inaccurate data, frustrated stakeholders. Here is what we did about it and what I wish I had known before we started.
Join the DZone community and get the full member experience.
Join For FreeThe System Was Broken, and Everyone Knew It
Our dashboards refreshed overnight. That was the expectation. Then, one week, they started taking six hours. Then eight. On a bad day, the full 24 hours. Business users would come in on Monday morning and still see Friday's numbers.
The data was wrong, too. Not wrong in an obvious way. Wrong in the quiet way where someone in finance notices a number looks off, checks it manually, finds a discrepancy, and then stops trusting the system. That is the worst kind of mistake. Because once trust is gone, you do not just have a technical problem. You have a people problem.
Our stack was old. SQL Server feeding an on-premises data warehouse, running through an ETL tool that was older than some of our engineers. It worked fine when data volumes were smaller. As volumes grew, the whole thing started showing cracks. One pipeline failing would back up three others. Dependencies were fragile. Retries were manual. The team spent more time keeping the lights on than actually doing analytics.
The most frustrating part was not the downtime. It was watching a report go out with wrong numbers and knowing exactly why it happened, and not having a fast way to fix it.
We needed to rebuild, not patch. And we needed something that could handle what we were asking of it.
Why Airflow
We looked at a few options. We kept coming back to Apache Airflow for three reasons.
First, it is Python-based. Our team writes Python. That matters more than people admit. The best orchestration tool is the one your team will use properly.
Second, it integrates with everything. We were moving to Databricks and AWS. We were already using Power BI and Tableau. Airflow has native integrations for all of it. We were not going to spend six months building connectors before we could even start.
Third, the DAG model forced us to think clearly about dependencies. That was a feature. Our old system had implicit dependencies that nobody fully understood. Writing explicit DAGs made us document what we needed the data to do.
One more thing that mattered: Airflow is what the rest of the industry uses. When we hired someone new, there was a good chance they already knew it. When something broke, the community had probably seen it before.
What We Actually Built
The Pipeline
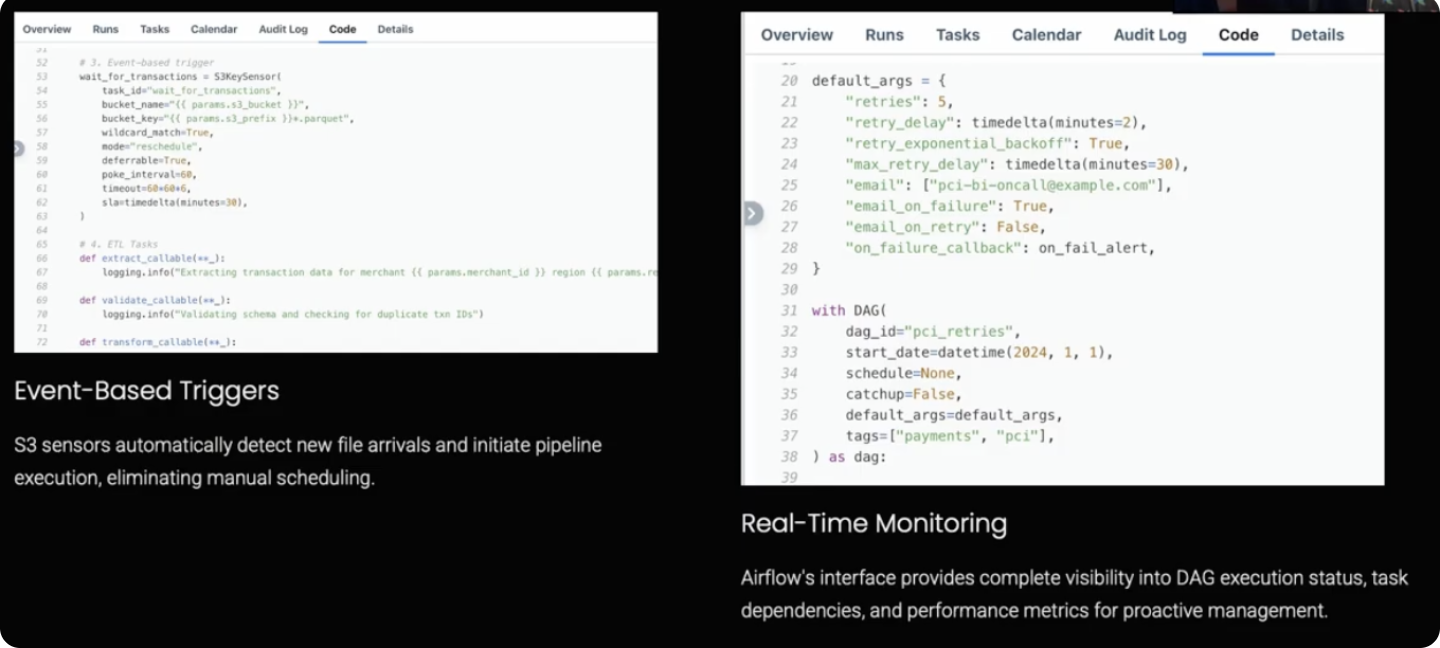
Data comes in from transactional sources and lands in AWS S3. Airflow picks it up when it arrives, not on a schedule, using an S3 sensor in deferrable mode. This was one of the better decisions we made. Event-based triggering means the pipeline starts as soon as the data is ready. No more sitting in a queue waiting for a fixed run time.
From S3, Airflow kicks off Spark jobs in Databricks. The jobs transform raw data into clean Delta tables. Once that is done, Airflow calls the Power BI and Tableau APIs to trigger dashboard refreshes. Before any refresh hits the dashboard, we validate the data. If something looks wrong, the refresh does not go through, and the team gets an alert.
After a successful refresh, stakeholders get a Slack notification and an email. They know exactly when fresh data is available. They stopped asking.
4 Patterns That Made It Work
We tried a lot of approaches. These four became our standard:
1. Parameterized DAG Templates
We built one template, not fifty DAGs. New data sources get added by updating a config file. This cut development time by around 80% once we had the pattern right.
2. Event-Based Triggers
S3 sensor in deferrable mode. The pipeline runs when data arrives, not on a schedule. This alone took significant latency out of the system.
3. SLA Monitoring on Every DAG
If a job runs longer than expected, the team gets an alert. We find out before a business deadline is missed, not after.
4. Automatic Retries With Escalation
Transient failures retry automatically. Persistent failures send an alert. Engineers deal with real problems, not network hiccups.
The Numbers After 6 Months
Data refresh went from 24 hours to under 2 hours for all critical processes. Manual intervention dropped 70%. We hit 100% SLA compliance for six straight months.
The number I care most about is the last one: stakeholder trust. After the system stabilized, our finance team stopped verifying dashboard numbers against source data before board meetings. That is not a metric you can put in a dashboard. But it is the one that tells you the work was worth it.
When the numbers got right, people were genuinely happy. Not just satisfied. Happy. That is what accurate data does to a team that has been burned by wrong numbers.
Beyond the BI team, the impact spread. Executives could see business unit performance in real time. Forecasting got more accurate because the inputs were reliable. The data team stopped being the people who maintain the pipes and started being the people who answer business questions.
What I Learned
1. Start With Less Than You Think You Need
We started with three data sources. Not the whole system. Starting small, let us figure out the patterns before we have to scale them. Every team I have seen try to migrate everything at once runs into problems that could have been caught earlier with a smaller scope.
2. DAG Readability Is Not Optional
Someone will read your DAG at 2 am when something is broken. Make it readable. Good names, modular code, comments that explain why, not just what. We paid for skipping this early on.
3. Build Monitoring Before You Need It
We deployed the first version without proper monitoring and spent weeks discovering failures reactively. Build observability first. Everything else can be improved later, but you cannot go back and add monitoring to failures that have already happened.
4. Understand Beyond the System
This is the one I wish someone had told me. Organizations trust their data systems. That trust is good, but it can also mask problems. Sometimes the pipeline is running fine, and the data is still wrong because of something upstream you did not model. You must go beyond the system to find those problems. Query the source. Check the logic. Do not assume that a green DAG means good data.
5. Treat DAGs Like Production Code
Code review. Version control. Testing. If you would not deploy application code without these, do not deploy DAGs without them either. We learned this by breaking things in production that we would have caught with a proper review process.
What I Would Do Differently
Two things.
Data quality checks should have been built into the framework from the start. We added them reactively when problems showed up. Building a proper data quality layer upfront would have caught issues before they became dashboard problems.
I would have brought business stakeholders into the DAG design conversations earlier. The engineers know what the data needs to do technically. The business users know what questions the data needs to answer. Those are different things. Getting both perspectives at the design stage produces better pipelines.
Where This Goes Next
The system works. That is not the end of the story; it is the beginning of what you can actually do when infrastructure stops being the constraint.
With reliable data pipelines in place, the team can focus on predictive analytics, anomaly detection, and real-time decision support. The boring infrastructure work unlocks the interesting analytics work. That was always the point.
If your team is still dealing with broken pipelines and inaccurate data, the problem is probably not your people. It is the architecture. Airflow will not fix everything, but it will give you the orchestration layer to build something that works. Start with one pipeline. Get it right. Then scale it.
The goal was never faster dashboards. The goal was data that people trusted enough to make decisions with. Everything else followed from that.
Opinions expressed by DZone contributors are their own.
Comments