How to Prevent Quality Failures in Enterprise Big Data Systems
Ensure reliable data pipelines with medallion architecture: Bronze, Silver, Gold layers catch quality issues early, preventing silent failures and bad decisions.
Join the DZone community and get the full member experience.
Join For FreeProblem
Modern enterprises run on data pipelines, and the quality of these pipelines directly determines the quality of business decisions. Many organizations, a critical flaw persists: data quality checks still happen at the very end, after data has already passed through multiple systems, transformations, and dashboards. By the time issues finally surface, they have already spread across layers and become much harder to diagnose. This systemic lag directly undermines the reliability of mission-critical decisions.
Solution
Medallion architecture (Bronze, Silver, Gold), shown in the diagrams, has become a preferred approach for building reliable pipelines. The true power of this architecture is the opportunity it creates for predictable data quality checkpoints. By embedding specific quality checks early and consistently, data teams can catch issues immediately and explain changes to prevent bad data from moving downstream.
I will explain how to execute these critical quality controls, walking through three essential quality checkpoints:
- Completeness checks in Bronze
- Transformation integrity checks in Silver
- Econciliation tests in Gold
I'll also discuss where these checks naturally fit into pipeline execution using PySpark examples and real-world failure scenarios. The diagrams included highlight both pre-production and production flows, helping you understand where these checks naturally fit.
Our ultimate goal is straightforward: Build observable pipelines that catch data problems early, long before they reach dashboards or impact decision-makers.
The Silent Data Failure
Most data quality failures go undetected until they reach the dashboard.
A PySpark job aggregates daily trading positions. The job runs successfully — no errors. Three days later, risk officers notice portfolio positions are 8% understated. Investigation reveals a join condition silently excluded records due to a schema mismatch. Nobody caught it because the job didn't crash. The data was wrong, but invisible.
This happens at scale because data problems compound downstream. One bad record in Bronze becomes 100 bad records in Gold after joins and aggregations. By the time it reaches dashboards, the damage is exponential.
The solution isn't better dashboards. It's predictable validation checkpoints embedded in the pipeline architecture.
This is the medallion architecture.
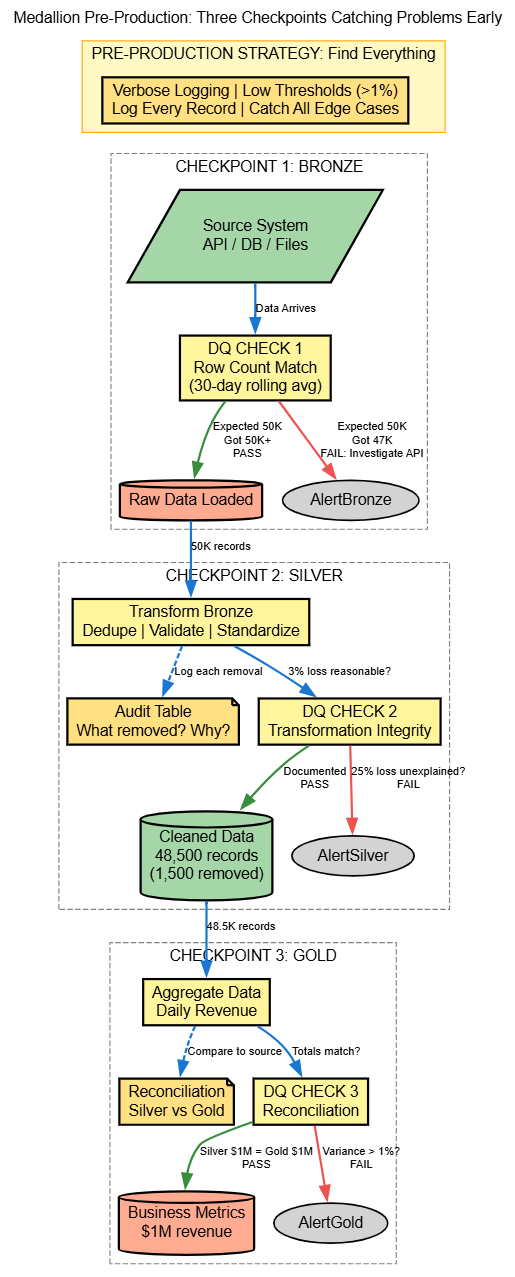
Pre-Production Data Quality Flow
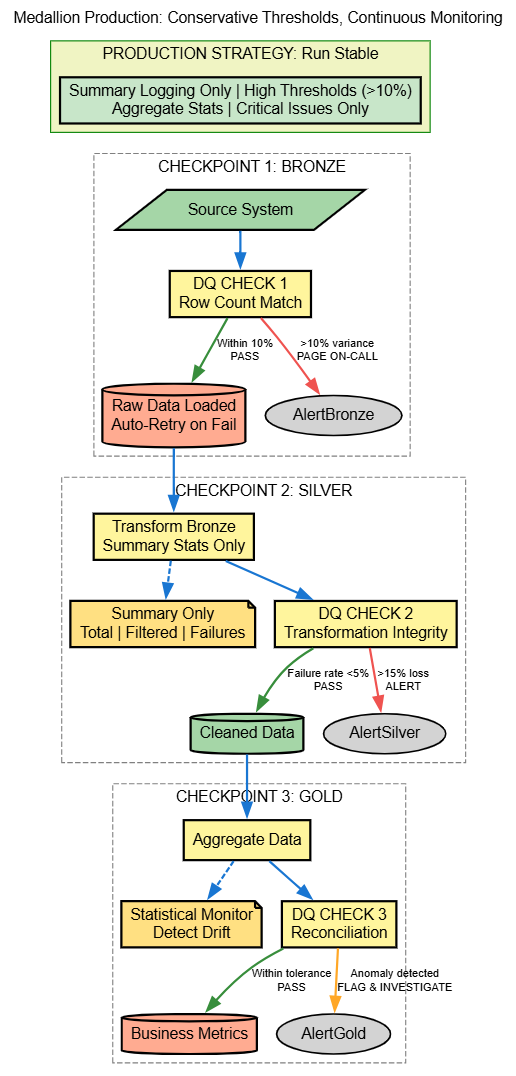
Production Data Quality Flow
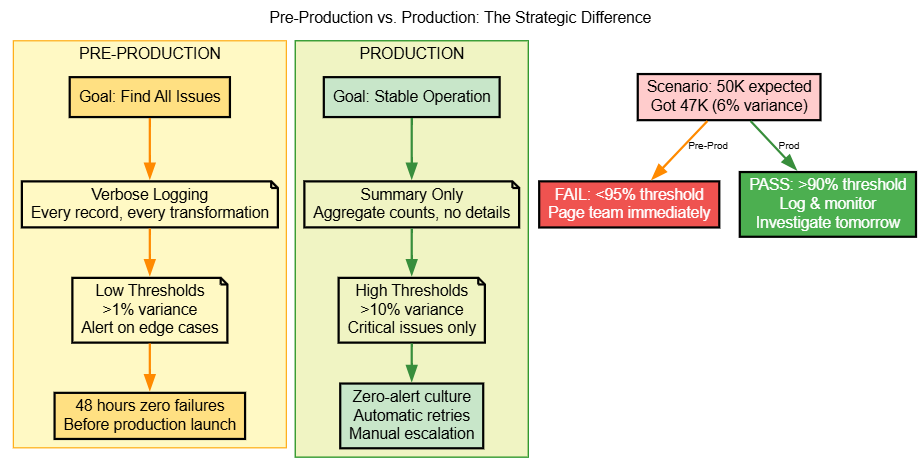
Pre-Production vs. Production Strategy
Three Checkpoints With PySpark
DQ Check 1: Bronze Completeness
What it validates: Row count comparison. Expected 50,000 records, got only 47,000.
from pyspark.sql.functions import count, col, lag, current_date
from pyspark.sql.window import Window

# Read Bronze layer
bronze_df = spark.read.table("bronze.orders")

# Calculate row counts with comparison to previous day
window_spec = Window.orderBy("ingestion_date")

check_1 = (bronze_df
    .filter(col("ingestion_date") >= current_date() - 1)
    .groupBy("ingestion_date")
    .agg(count("*").alias("rows_loaded"))
    .withColumn("yesterday_count", lag("rows_loaded").over(window_spec))
    .withColumn("pct_change",
                ((col("rows_loaded") - col("yesterday_count")) / col("yesterday_count") * 100))
    .withColumn("status",
                when(col("pct_change") < -5, "FAIL: >5% drop")
                .when(col("rows_loaded") == 0, "FAIL: No data")
                .otherwise("PASS")))

check_1.show()
# Alert if status = FAIL
Real-world pattern: IoT sensor ingestion dropping to 25% volume. DQ Check 1 fired immediately.
Root cause: upstream API rate limiting. Team adjusted connection pooling and circuit breaker patterns within 30 minutes. Without this check, downstream analytics would show incorrect sensor data for days.
DQ Check 2: Silver Transformation Integrity
What it validates: Data loss during transformation. If 5,000 records are removed, the audit table explains why.
from pyspark.sql.functions import count, when, col, isnan, isnull
from pyspark.sql import functions as F

# Read Bronze and Silver
bronze_df = spark.read.table("bronze.customers")
silver_df = spark.read.table("silver.customers")

bronze_count = bronze_df.count()
silver_count = silver_df.count()

# Log what was removed
removed_df = (bronze_df
    .join(silver_df, "customer_id", "anti")  # Records in Bronze but not in Silver
    .withColumn("removal_reason",
        when(~col("email").rlike(r"^[^\s@]+@[^\s@]+\.[^\s@]+$"), "Invalid email format")
        .when(col("age") < 0, "Negative age")
        .when(col("age") > 150, "Unrealistic age")
        .otherwise("Duplicate customer_id")))

audit_summary = (removed_df
    .groupBy("removal_reason")
    .agg(count("*").alias("removal_count"))
    .withColumn("pct_of_total", col("removal_count") / bronze_count * 100)
    .orderBy("removal_count", ascending=False))

# Write to audit table
audit_summary.write.mode("append").option("mergeSchema", "true").saveAsTable("silver.audit_log")

# Check if loss is reasonable (pre-prod >5%, prod >15%)
loss_pct = (bronze_count - silver_count) / bronze_count * 100
status = "PASS" if loss_pct < 0.05 else "FAIL: Unexpected data loss"
print(f"Bronze: {bronze_count}, Silver: {silver_count}, Loss: {loss_pct}%, Status: {status}")
Real-world pattern: Email validation transformation silently dropped 12% of customer records. Audit table showed "Invalid email format: 1,000 rows removed." The investigation revealed that the regex pattern changed during the library dependency upgrade. Caught in 5 minutes via audit trail instead of 5 days of incorrect customer analytics.
DQ Check 3: Gold Reconciliation
What it validates: Aggregations in Gold reconcile to Silver. If Silver shows $1M but Gold shows $950K, something's broken.
from pyspark.sql.functions import sum as spark_sum, count, col, abs, current_date
from pyspark.sql import functions as F

# Read Silver transactions
silver_df = spark.read.table("silver.transactions").filter(col("transaction_date") >= current_date() - 7)

# Silver totals
silver_totals = (silver_df
    .groupBy("transaction_date", "region_id")
    .agg(
        spark_sum("transaction_amount").alias("silver_revenue"),
        count("*").alias("silver_records"),
        countDistinct("customer_id").alias("silver_customers")))

# Read Gold aggregations
gold_df = spark.read.table("gold.daily_revenue").filter(col("report_date") >= current_date() - 7)

gold_totals = (gold_df
    .select(
        col("report_date").alias("transaction_date"),
        "region_id",
        col("total_revenue").alias("gold_revenue"),
        col("transaction_count").alias("gold_records"),
        col("unique_customers").alias("gold_customers")))

# Reconcile
reconciliation = (silver_totals
    .join(gold_totals, ["transaction_date", "region_id"], "full")
    .withColumn("revenue_variance", abs(col("silver_revenue") - col("gold_revenue")))
    .withColumn("variance_pct",
                (col("revenue_variance") / col("silver_revenue") * 100))
    .withColumn("status",
        when(col("gold_revenue").isNull(), "FAIL: Missing in Gold")
        .when(col("variance_pct") > 1, "FAIL: Revenue variance > 1%")
        .when(col("silver_records") != col("gold_records"), "FAIL: Record count mismatch")
        .otherwise("PASS")))

# Show failures only
failures = reconciliation.filter(col("status") != "PASS")
failures.show()

# Write to monitoring table
reconciliation.write.mode("append").option("mergeSchema", "true").saveAsTable("monitoring.dq_check_3")
Real-world pattern: The credit risk dashboard showed a 2% variance between Silver transaction totals and Gold metrics. Reconciliation check flagged immediately.
Root cause: LEFT JOIN excluding records with null counterparty IDs, silently underreporting portfolio exposure.
Fix: FULL OUTER JOIN with explicit NULL handling. Prevented incorrect risk metrics from reaching stakeholders.
Statistical Monitoring: Catching Silent Issues
from pyspark.sql.functions import col, avg, stddev_pop, abs as spark_abs, lag, current_date
from pyspark.sql.window import Window

# Read Gold revenue data
gold_df = spark.read.table("gold.daily_revenue").filter(col("report_date") >= current_date() - 90)

# Define window for 30-day statistics
window_30d = Window.orderBy("report_date").rangeBetween(-30*24*3600, 0)

# Calculate statistical anomalies
monitoring = (gold_df
    .withColumn("avg_30d", avg("total_revenue").over(window_30d))
    .withColumn("stddev_30d", stddev_pop("total_revenue").over(window_30d))
    .withColumn("std_devs_from_avg",
                spark_abs(col("total_revenue") - col("avg_30d")) / col("stddev_30d"))
    .withColumn("anomaly_flag",
        when(col("std_devs_from_avg") > 3, "ANOMALY: 3+ std devs")
        .when(col("total_revenue") < col("avg_30d") * 0.85, "WARNING: 15% below average")
        .otherwise("NORMAL")))

# Show anomalies
anomalies = monitoring.filter(col("anomaly_flag") != "NORMAL")
anomalies.show()

# Write monitoring results
monitoring.write.mode("append").option("mergeSchema", "true").saveAsTable("monitoring.statistical_checks")
This catches silent failures: data that passes threshold checks but is statistically wrong. The join silently, excluding 8% of records, passes row count checks but fails statistical monitoring.
Implementation Roadmap
- Week 1: Set up Bronze monitoring table, implement DQ Check 1 with PySpark.
- Week 2: Implement DQ Check 2 (transformation audit) with removal tracking.
- Week 3: Implement DQ Check 3 (reconciliation), comparing Silver to Gold.
- Week 4: Deploy to production with conservative thresholds (>10% variance).
Quick Reference
| Checkpoint | Pre-Production Threshold | Production Threshold |
|---|---|---|
| Bronze (Row count) | >1% variance | >10% variance |
| Silver (Data loss) | >5% unexplained | >15% unexplained |
| Gold (Reconciliation) | >0.5% variance | >1% variance |
Conclusion
Bad data problems often appear quietly and are usually found too late when dashboards show incorrect figures. When this happens, the error has already moved through different steps, making it tough to figure out what went wrong and causing problems for important business decisions.
To fix this, the medallion architecture (which uses layers called Bronze, Silver, and Gold) is a good way to build reliable data systems. This design sets up important checkpoints to check the data quality. These checkpoints help teams catch problems quickly, explain changes clearly, and keep bad data from going any further.
The main checks include completeness checks in the Bronze layer, checks to ensure data changes are applied correctly in the Silver layer, and reconciliation tests in the Gold layer.
The simple goal is to build systems where data issues "fail fast," meaning they stop quickly and never reach the people making decisions. By making data quality a basic part of the system's structure, organisations make sure they are running on trustworthy data.
Opinions expressed by DZone contributors are their own.
Comments