Gatling Tests Monitoring with Grafana and InfluxDB
Learn how to integrate the very powerful monitoring tool Gatling with Grafana and InfluxDB. Check out the full tutorial here!
Join the DZone community and get the full member experience.
Join For FreeGatling is a very powerful performance testing tool that provides you with a number of ways to monitor and analyze your script's execution. By default, Gatling provides real-time console monitoring, where you can track different script execution metrics. In addition to that, Gatling creates wonderful static HTML reports that can be used for performance analyses after tests execution.
In most situations, real-time console reporting is enough to get a clear picture of script behavior. But I guess everyone will agree that having very comprehensive, detailed and configurable real-time dashboards is always better rather than relying on limited console information. That's why the Gatling team implemented a functionality that allows us to easily integrate Gatling with one of the most powerful tools for comprehensive system monitoring—Grafana (for detailed dashboards) and InfluxDB (for performance metrics storage).
Gatling integration with Grafana is very straightforward in comparison with other performance tools like Apache JMeter™ (where you need to configure a separate plugin) or Locust (where you need to implement metric reporting yourself). All you need is to setup an environment with a Grafana web application (with a time series database under it like InfluxDB) and to configure Gatling tests implementation. The rest is a matter of configuration.
In one of our last articles, we prepared a guide you can use to setup Grafana + InfluxDB monitoring in just a few minutes. Briefly, all you need is to:
1. Install Docker and Docker Compose (if you don't have them yet)
2. Checkout the preconfigured monitoring environment:
git clone https://github.com/BushnevYuri/DockerGrafanaInfluxKit
3. Go inside the imported folder:
cd DockerGrafanaInfluxKit4. Run the Docker Compose in a background mode:
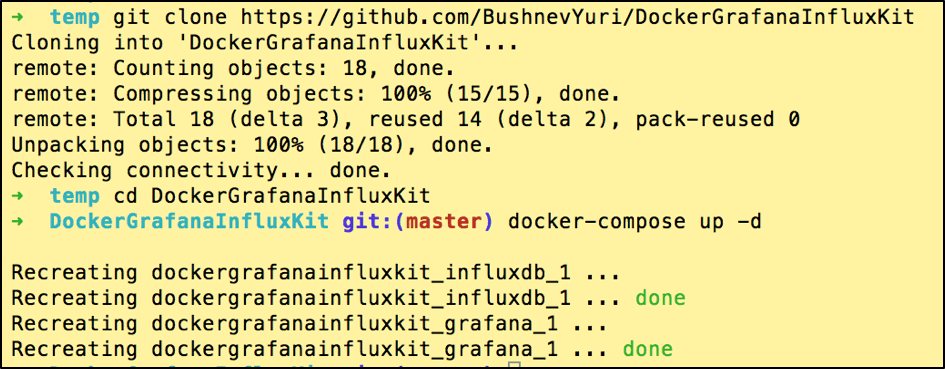
After that your monitoring environment will be ready.
In addition to that, you should have a Gatling test's implementation environment. You can read this blog post to learn how to create your own. But as you are already reading this article, I assume that you have one. If not, just go through the article.
Now that we have Gatling tests implementation and monitoring environments up and ready to use, we can finally proceed to the actual implementation of the metrics reporting.
Gatling provides you with an inbuilt Graphite data writer that you can use for metrics publishing. Graphite is an open-source tool for collection, storage and display of graphs about collected data in real-time. Official Gatling documentation has some reference about how you can implement Gatling -> Graphite -> InfluxDB monitoring, but we are not giving you the link to this tutorial on purpose.
The reason is that some time ago you had to have the complete pipeline in place (including a separately installed Graphite application) to feed your metrics into InfluxDB. But a tools stack containing Graphite, InfluxDB, and Grafana together sounds a bit overwhelming. Graphite goes with its own web application, which seems to be redundant when you have very powerful Grafana dashboards. That's why, at some point, InfluxDB provided a functionality to accept the metrics based on the Graphite protocol directly without having Graphite itself between the metrics source and InfluxDB itself. This is quite nice because it eliminates an additional tools layer, which means you don't need to support redundant tools to have the whole metrics monitoring pipeline running.
We will proceed with the configuration based on our "Grafana InfluxDB" monitoring stack, but you can easily apply the same configuration if you run the InfluxDB and Grafana using another way.
By default, InfluxDB has the Graphite protocol turned off, so you need to change the configuration to make it actually work. It is pretty straightforward to change the configuration if you are running InfluxDB as a locally installed service, but applying configuration on top of Docker might be tricky unless you've done it before.
The main reason why it might be tricky is that if you go inside Docker and change the configuration manually, it will not persist if you rerun the container. In addition to this, it will not be there if you run the same container somewhere else, which just kills the main benefits provided to you by Docker, which by design should give you a portable solution. That's why we will show you how to make the new configuration stay persistent with your Dockerized infrastructure.
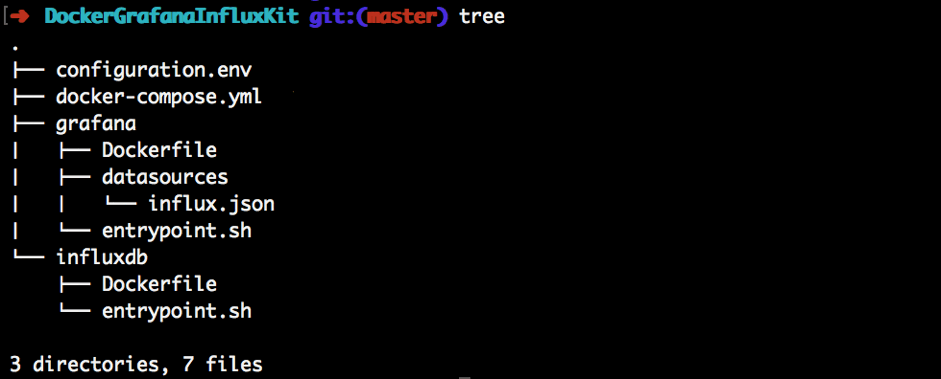
This is the default structure of our basic lightweight monitoring environment based on Grafana and InfluxDB.
Now, we need to create a custom configuration file for our InfluxDB, which we will be using during database startup. Let's create this configuration file in the same folder as the InfluxDB related files, based on this basic configuration template:
vim influxdb/influxdb.conf # use the content in the link above to fulfill the configuration fileTo turn the Graphite protocol on, we need to uncomment the graphite section and specify params in this way:
[[graphite]]
  enabled = true
  bind-address = ":2003"
  database = "graphite"
  retention-policy = ""
  protocol = "tcp"
  batch-size = 5000
  batch-pending = 10
  batch-timeout = "1s"
  consistency-level = "one"
  separator = "."
  udp-read-buffer = 0
We are not going to dive deep into each of the configuration params, as you might want stick to defaults. The main params that you really need to care about are:
- 'enabled = true' - means that you turned the Graphite protocol on (the default value is "enabled = false")
- 'bind-address = ":2003"' - tells you which port should be used for sending the metrics
- 'database = "graphite"' - name of the InfluxDB database that will be used for metrics storage coming from the Graphite protocol (keep in mind you don't need to create the database manually as it will be auto created as soon as you push some metrics inside)
So, now we have created the configuration file that we want to use during InfluxDB startup. But we didn't address the fact that currently this configuration file is located on our local machine and we didn't specify any workflow portraying how this configuration file will be pushed inside the Docker container. If you want to copy some of the files inside the container during startup, you can use the Docker COPY command that we should specify inside the InfluxDB docker file:
vim influxdb/Dockerfile

FROM influxdb:1.3.1-alpine

WORKDIR /app
COPY entrypoint.sh ./
RUN chmod u+x entrypoint.sh
COPY influxdb.conf /etc/influxdb/influxdb.conf

ENTRYPOINT ["/app/entrypoint.sh"]
In addition to that, we need to keep in mind that in order to access the InfluxDB graphite protocol port, we need to expose it outside the container. This is done in the docker-compose file in the section where you already have the "8086" port forwarding to access the InfluxDB metrics from Grafana:
➜  DockerGrafanaInfluxKit git:(graphite_on) ✗ vim docker-compose.yml

version: '3.2'

services:
  influxdb:
    build: influxdb
    env_file: configuration.env
    ports:
      - '8086:8086'
      - '2003:2003'
    volumes:
      - influxdb_data:/var/lib/influxdb
  grafana:
    build: grafana
    env_file: configuration.env
    links:
      - influxdb
    ports:
      - '3000:3000'
    volumes:
      - grafana_data:/var/lib/grafana

volumes:
  grafana_data: {}
  influxdb_data: {}
Last but not least, we need to configure the InfluxDB docker entrypoint script to run InfluxDB with the configuration file that we are going to copy inside the container:
➜  DockerGrafanaInfluxKit git:(graphite_on) ✗ vim influxdb/entrypoint.sh

#!/usr/bin/env sh

if [ ! -f "/var/lib/influxdb/.init" ]; then
    exec influxd -config /etc/influxdb/influxdb.conf $@ &


    until wget -q "http://localhost:8086/ping" 2> /dev/null; do
        sleep 1
    done

    influx -host=localhost -port=8086 -execute="CREATE USER ${INFLUX_USER} WITH PASSWORD '${INFLUX_PASSWORD}' WITH ALL PRIVILEGES"
    influx -host=localhost -port=8086 -execute="CREATE DATABASE ${INFLUX_DB}"

    touch "/var/lib/influxdb/.init"

    kill -s TERM %1
fi

exec influxd $@
To apply all the mentioned changes you need to stop the containers (if you are running them now) and run them again with the "--build" argument to rebuild the container before the run:
➜  DockerGrafanaInfluxKit git:(graphite_on) ✗ docker-compose down
➜  DockerGrafanaInfluxKit git:(graphite_on) ✗ docker-compose up -d --build
We are done! You are now running Grafana and InfluxDB, which has switched on the graphite protocol on the port "2003", which can be used to publish metrics inside.
As I mentioned before, Gatling has an inbuilt graphite protocol data writer, which basically means that as soon as your data source accepts this protocol, you don't need to create custom solutions for metrics reporting. All you need is to apply a small configuration on top of the default Gatling configuration files.
The main gatling configuration file ("gatling.conf") can be found in the "src/test/resources" Gatling folder. In order to turn the reporting on, you need to uncomment the "graphite" configuration section and specify the host ("localhost" in our case as we are running Grafana and InfluxDB locally in docker container) and port ("2003" as we have specified in docker compose file). The rest you can just uncomment and leave as is:
graphite {
 light = false              # only send the all* stats
 host = "localhost"         # The host where the Carbon server is located
 port = 2003                # The port to which the Carbon server listens to (2003 is default for plaintext, 2004 is default for pickle)
 protocol = "tcp"           # The protocol used to send data to Carbon (currently supported : "tcp", "udp")
 rootPathPrefix = "gatling" # The common prefix of all metrics sent to Graphite
 bufferSize = 8192          # GraphiteDataWriter's internal data buffer size, in bytes
 writeInterval = 1          # GraphiteDataWriter's write interval, in seconds
}
Now everything should be ready to go and you can run any Gatling test that you have nearby!
After we run our script, it's time to verify that all the data has been actually collected into the InfluxDB database.
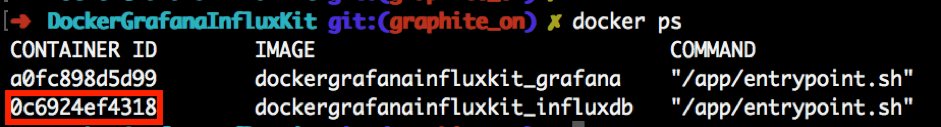
First, you need to open the InfluxDB console. In order to do that, you need to find the instance id of your InfluxDB container:
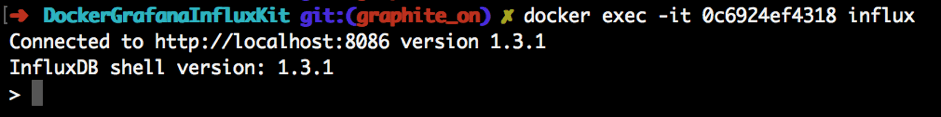
Next, you need to run the InfluxDB client providing the container id that you found in the previous step:
docker exec -it [YOUR_INFLUXDB_CONTAINER_ID] influx
To ensure that the test data has been collected into InfluxDB, you can run these commands inside the InfluxDB shell client:
SHOW databases
…..
USE graphite
…..
SHOW series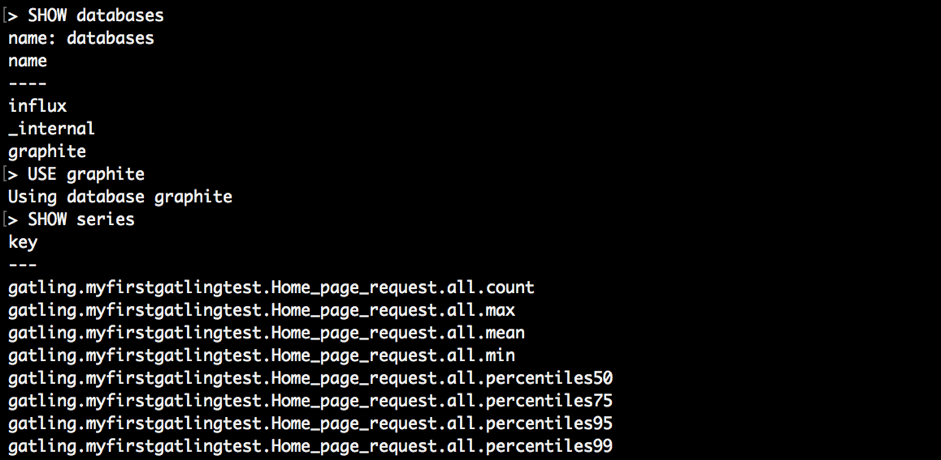
As you can see, the graphite database is full of different metrics. It indicates that we have done everything right and we can start the creation of Grafana dashboards!
Using the Grafana Dashboards
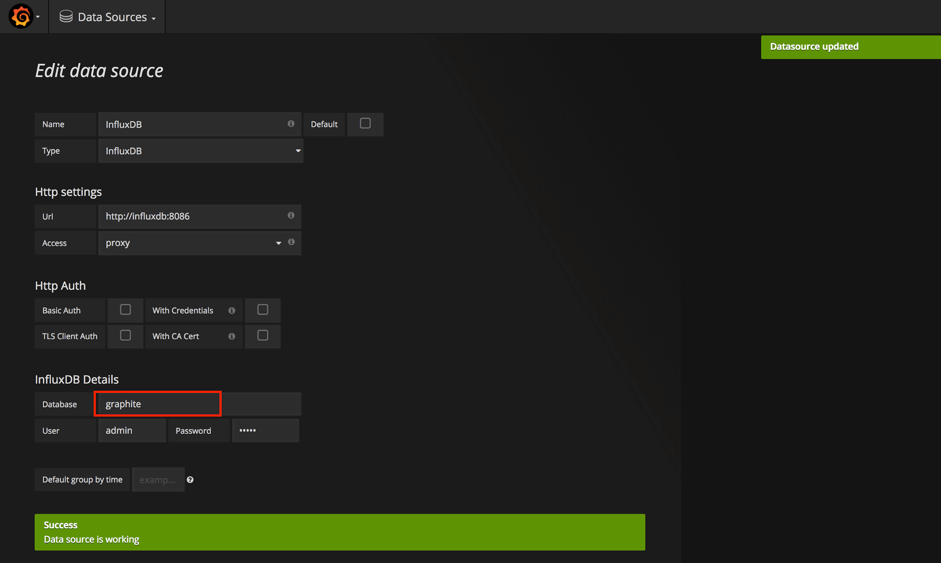
If you are running Grafana on your local machine, you should be able to open it using the 'http://localhost:3000' address. If you are following our steps, you should already have InfluxDB and its related Grafana data source in your Grafana configuration, but it has a different database name specified inside compared to the one we have created for keeping Gatling metrics.
To change the database or create a new data source if you don't have any, go to "Menu button -> Data Source" and choose an existing one or create an additional data source with a specified configuration:
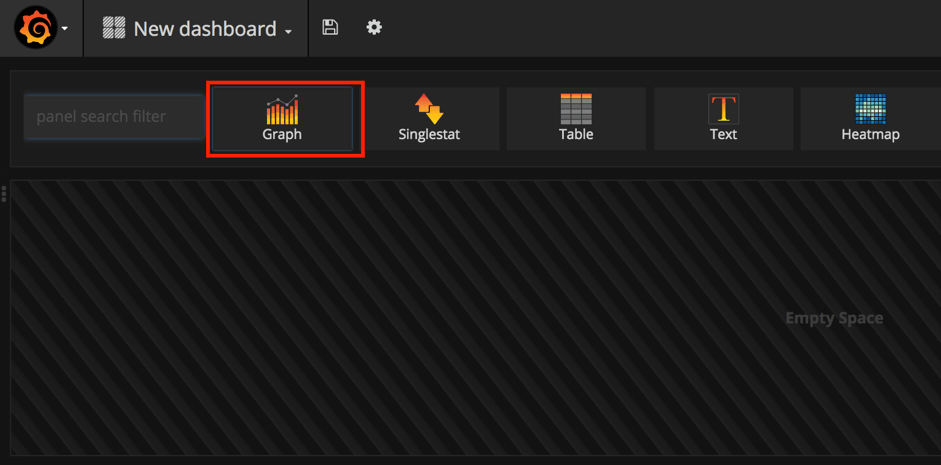
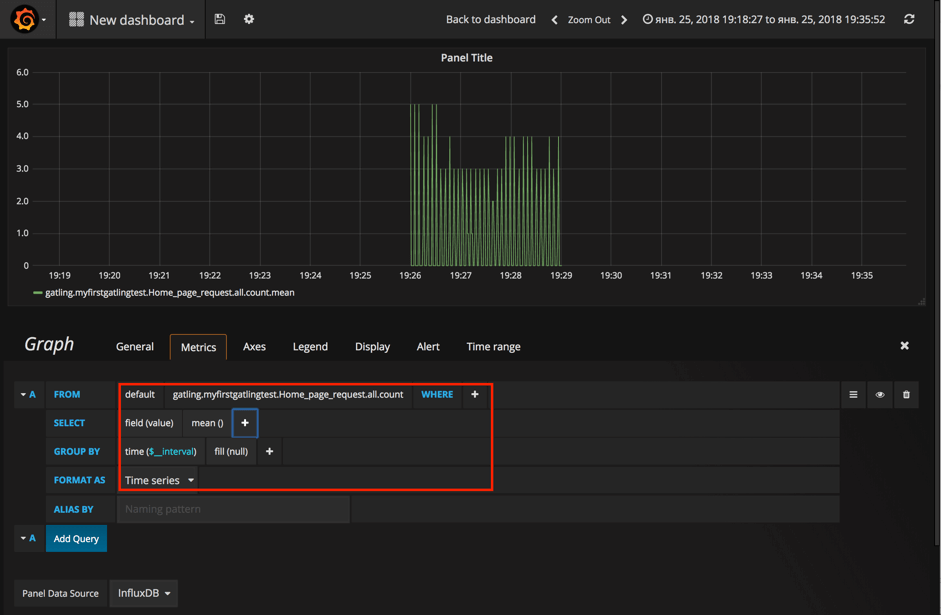
Once you are done, go to "Menu button -> Dashboards -> New" and you will be redirected to the dashboard constructor page where you will find lots of different panels that can be added for dashboard creation. Let's try something simple and choose the classic "Graph":
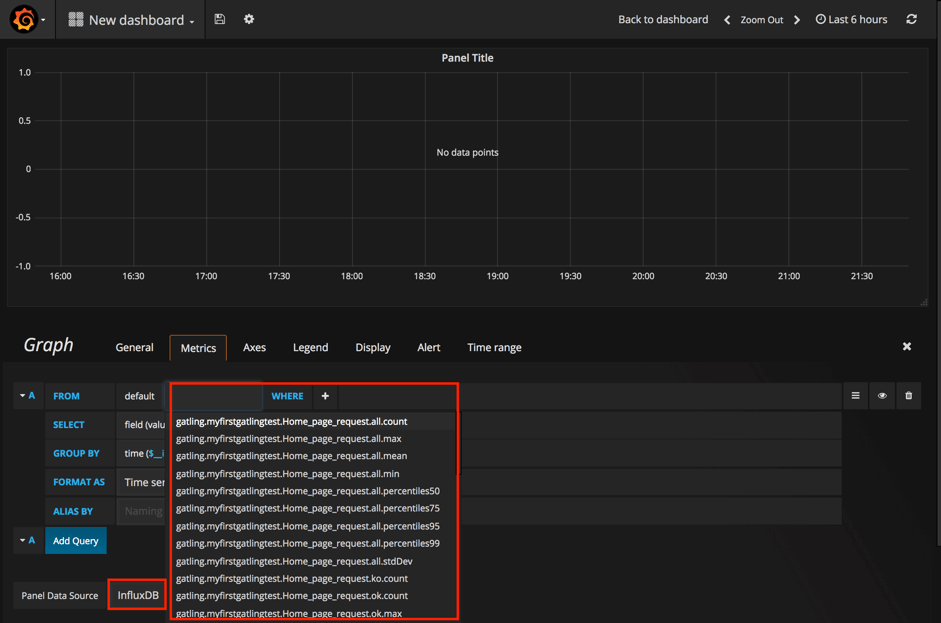
First of all, to get a nice autosuggestion during the dashboard creation, you need to specify the 'Panel Data Source' (you can find this field at the bottom of the panel). After that, your fields will have autosuggestions for all the metrics available in InfluxDB and the aggregation functions available in Grafana:
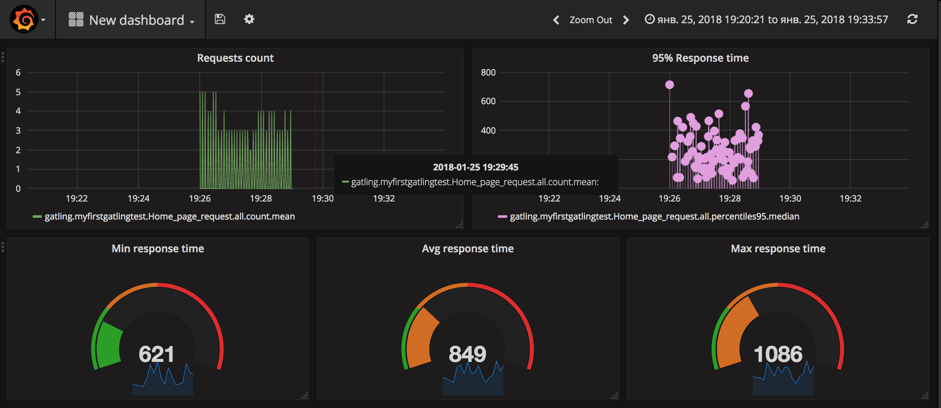
We are not going to cover all the options available in Grafana for making beautiful and meaningful dashboards as there are much better resources for that (for example, I would recommend to start from the official documentation which is actually quite informative). Go over it and you will find that Grafana dashboards creation is easy and fun!
That's it! In this article we showed you how to implement a powerful monitoring for the Gatling performance testing framework. We have installed the whole monitoring infrastructure using Docker and went over all steps required to implement metrics reporting from scratch.
You can also run your Gatling tests in the cloud and analyze the results with BlazeMeter. You will get:
- Simple Scalability - It's easy to create large-scale JMeter tests. You can run far larger loads far more easily with BlazeMeter than you could with an in-house lab.
- Rapid-Start Deployment - BlazeMeter's recorder helps you get started with JMeter right away, and BlazeMeter also provides complete tutorials and tips.
- Web-Based Interactive Reports - You can easily share results across distributed teams and overcome the limitations of JMeter's standalone UI.
- Built-In Intelligence - The BlazeMeter Cloud provides on-demand geographic distribution of load generation, including built-in CDN-aware testing.
Published at DZone with permission of Yuri Bushnev. See the original article here.
Opinions expressed by DZone contributors are their own.
Comments