Log Analysis 101 with Apache Flink, Spring Boot and ActiveMQ
Join the DZone community and get the full member experience.
Join For Free
Log analysis is very useful and allows organizations to get insights from log files.
In this post (which is a beginner's guide), I will share how we to configure a "message queue" in Spring Boot and then use it as a stream source using Flink. This pattern allows for highly decoupled systems, where one component delegates the responsibility for further processing to another component in an asynchronous way.
All the code in this example is available in GitHub.
The data pipeline used in this example is:
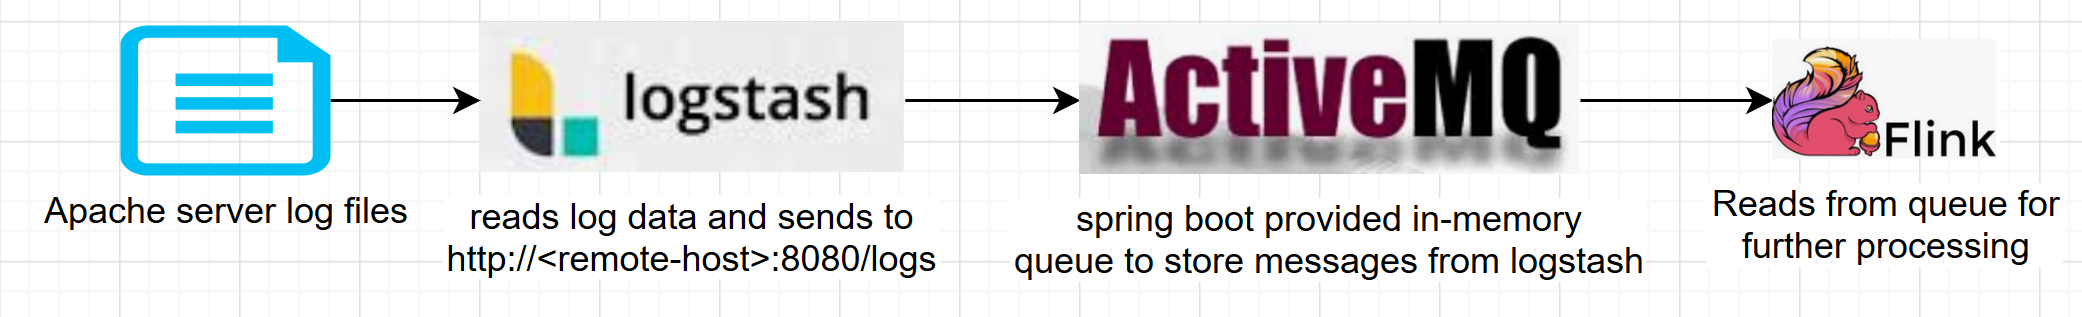
1. Configuring Apache Log File Simulator
For log files, I used a very handy fake apache log generator utility. After installing it, execute the following command to start the file generator in infinite mode
$ python apache-fake-log-gen.py -n 0 -o LOG
2. Logstash Setup
Now that we have the files being populated, we want an agent to read these log texts and send them to our Spring Boot application. Logstash is a purpose-made utility for such use cases. Just download and unzip it; use the following config text and save it as $LOGSTASH/config/apache-log.yml.
*<app-hostname> is the IP or hostname where you are running the spring boot application.
xxxxxxxxxx
input
file
path => "/root/Fake-Apache-Log-Generator/*.log"
filter
grok
match => "message" => "%{COMBINEDAPACHELOG}"
output
http
url => "http://<app-hostname>:8080/logs"
http_method => "post"
Then, execute the following command to start Logstash. The version I tested is 7.3.2.
x
$LOGSTASH/bin/logstash -f config/apache.yml
3. Spring Boot Application to Receive the Log Data From Logstash
As with other features, setting up JMS is very easy in Spring Boot. I followed this dzone article and spring boot documentation. I am using a default in-memory ActiveMQ message queue, as shown below, and exposing it as a bean.
xxxxxxxxxx
public class Application
{
private static final String LOCAL_ACTIVE_MQ_URL = "vm://localhost?broker.persistent=false";
public static void main(String[] args)
{
SpringApplication.run(Application.class, args);
}
public Session mySession() throws JMSException
{
ActiveMQConnectionFactory factory = new ActiveMQConnectionFactory(LOCAL_ACTIVE_MQ_URL);
factory.setTrustAllPackages( true );
Connection connection = factory.createConnection();
connection.start();
return connection.createSession(false, Session.AUTO_ACKNOWLEDGE);
}
}
Next, I expose a REST endpoint "http://hostname:8080/logs" to receive log messages from Logstash and send them to the queue. Note that the JSON payload from Logstash is converted to a POJO (ApacheLogMessage.java) before being sent to the queue.
xxxxxxxxxx
("/logs")
public class Controller
{
private JmsTemplate jmsTemplate;
public static final String QUEUE_NAME = "webserverlog";
public ResponseEntity<?> sendToQueue( ApacheLogMessage message)
{
jmsTemplate.convertAndSend(QUEUE_NAME, message );
return new ResponseEntity<>(HttpStatus.ACCEPTED);
}
}
4. Configure Flink to Use the Queue as a Source
AMQSource.java, under the org.pd.streaming.application.queue package, extends Flink's RichSourceFunction and acts as a source. It takes a consumer object of type MessageConsumer and listens for messages. Before sending it to Flink, I convert it back to my POJO for the Apache log message.
xxxxxxxxxx
public void run( SourceContext<ApacheLogMessage> ctx ) throws Exception
{
while( running )
{
Message m = consumer.receive();
ApacheLogMessage logMessage = (ApacheLogMessage)((ObjectMessage)m).getObject();
ctx.collect( logMessage );
}
}
Now that we have the source done, let us put them together and start a Flink execution environment. In the StreamProcess.java class, I first create a Flink DataStream from my source.
xxxxxxxxxx
Destination destination = mySession.createQueue(QUEUE_NAME);
MessageConsumer consumer = mySession.createConsumer( destination );
source = new AMQSource(consumer);
DataStream<ApacheLogMessage> dataStream = env.addSource( source );
Then, I build a Flink data pipeline, as shown below:
xxxxxxxxxx
dataStream
.keyBy((KeySelector<ApacheLogMessage, String>) ApacheLogMessage::getClientip)
.timeWindow( Time.seconds( 10 ) )
.apply( new WindowFunction<ApacheLogMessage,Tuple2<String, Long>, String,TimeWindow>()
{
public void apply( String key, TimeWindow window,Iterable<ApacheLogMessage> input, Collector<Tuple2<String,Long>> out ) throws Exception
{
long count = 0;
for( ApacheLogMessage msg : input)
{
if ( HttpStatus.valueOf( msg.getResponse() ).is4xxClientError() )
{
count++;
}
}
out.collect( new Tuple2<>(key, count) );
}
})
.filter( new FilterFunction<Tuple2<String,Long>>()
{
public boolean filter( Tuple2<String,Long> value ) throws Exception
{
return value.f1 > 0;
}
})
.print();
Let me explain in detail how the above code works.
- Line 2: Partition the log stream using client IP Address as a key.
- Line 3: Create a tumbling time window of 10 seconds.
- Line 4 -19: Check for messages where the server reported 4xx response code (client-side errors). Return a Flink Tuple containing the client-ip and the count.
- Line 20 - 27: Another Flink API to filter out those tuples that didn't have any 4xx errors.
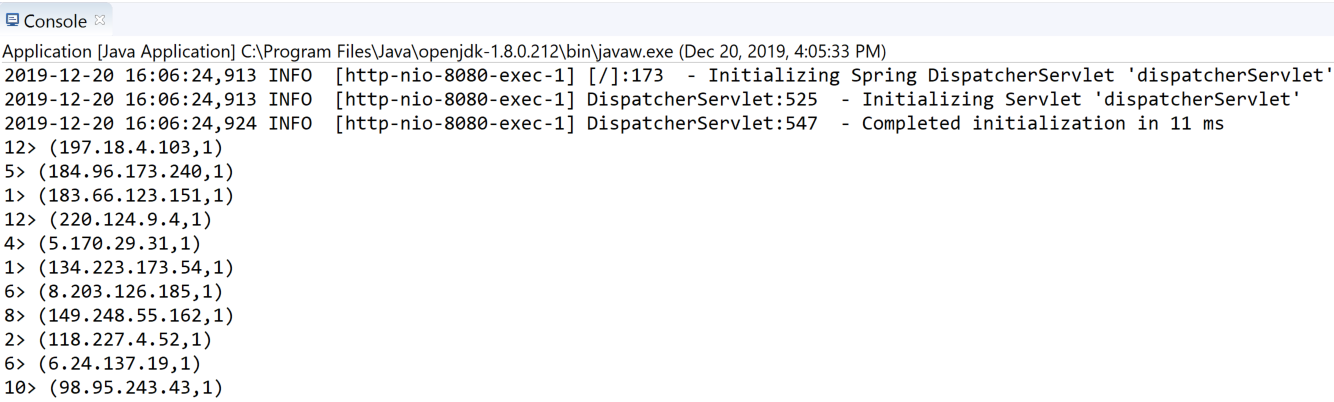
Finally, print these tuples (sample from eclipse console).
I hope this article helps you in getting started with log analysis using Flink. In upcoming posts, I will be adding a database as a sink and sharing some Grafana charts to better visualize our data.
Further Reading
Opinions expressed by DZone contributors are their own.
Comments