A Hands-On Guide to OpenTelemetry: Manual Instrumentation for Developers
This article continues the series by explaining how to manually instrument your application's telemetry data on your observability journey.
Join the DZone community and get the full member experience.
Join For FreeAre you ready to start your journey on the road to collecting telemetry data from your applications?
In this series, you'll explore how to adopt OpenTelemetry (OTel) and how to instrument an application to collect tracing telemetry. You'll learn how to leverage out-of-the-box automatic instrumentation tools and understand when it's necessary to explore more advanced manual instrumentation for your applications. By the end of this series, you'll have an understanding of how telemetry travels from your applications to the OpenTelemetry Collector, and be ready to bring OpenTelemetry to your future projects. Everything discussed here is supported by a hands-on, self-paced workshop authored by Paige Cruz.
The previous article zoomed into the usage of Jaeger to help developers when visually exploring their telemetry data. In this article, we'll help developers with manually instrumenting to add metadata specific to their application or business allowing them to derive better insights faster.
It is assumed that you followed the previous articles in setting up both OpenTelemetry and the example Python application project, but if not, go back and see the previous articles as it's not covered here.
Up to now in this series, we've used automatic and programmatic instrumentation to collect tracing data for our system interactions. It would be much more interesting to manually instrument our application, adding metadata specific to our business that helps derive better insights faster.
Adding Span Attributes
Adding span attributes means we are tracking key, value pairs containing metadata to annotate a span with information about the operation it is tracking. For example, to set this up for our Python application, we use the syntax:
span.set_attribute("KEY","VALUE")
To apply this to our application (that you installed and used in the previous articles from this series), we open the file manual/app.py, import the get_current_span from the API, and add an attribute tracking the count of homepage loads to the index() method as follows with the new code shown in bold:
...
  from opentelemetry import trace
  from opentelemetry.trace import set_tracer_provider, get_current_span
  from opentelemetry.sdk.trace import TracerProvider
  from opentelemetry.sdk.trace.export import SimpleSpanProcessor
  from opentelemetry.exporter.otlp.proto.http.trace_exporter import OTLPSpanExporter
...
@app.route('/')
def index():
  span = trace.get_current_span()
  global HITS
  HITS = HITS + 1
  span.set_attribute("hits", HITS)
  msg = f'This webpage has been viewed {HITS} times'
  return msg
...
We now can build a new container image and run the pod to verify as follows:
$ podman build -t hello-otel:manual -f manual/Buildfile-manual

$ podman play kube manual/app_pod.yaml
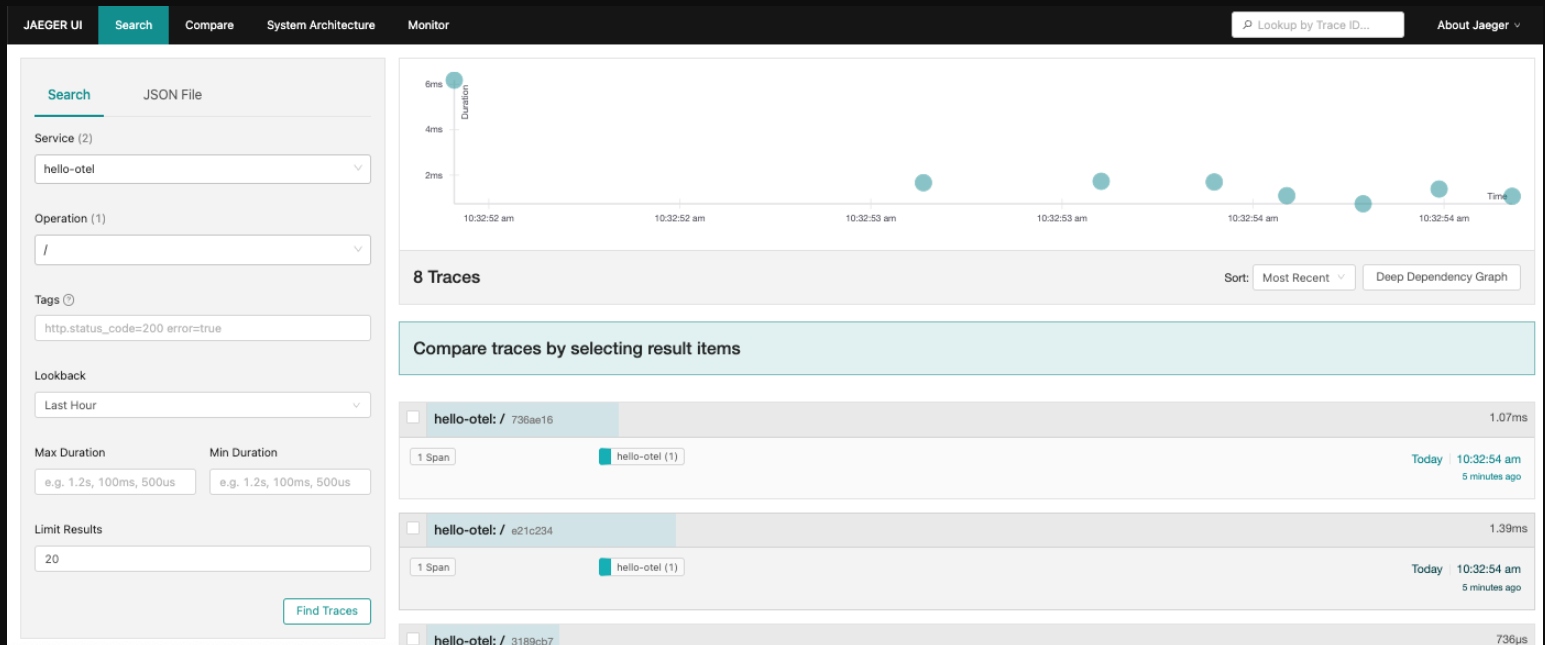
With the pod running open a browser to http://localhost:8080 and open the Jaeger UI at http://localhost:16686, searching for traces of the operation / which should look something like this:
Click on a trace and confirm the hits attribute which is in span details:

This verifies that the manual instrumentation with its attributes is working for tracing our application homepage. What about tracing nested spans?
Let's try manually instrumenting for nested spans. But first, we need to stop the running pod with the following:
$ podman play kube manual/app_pod.yaml --down
Now let's enhance our tracking of nested spans.
Enhancing Programmatic Instrumentation
The instrumented requests library provides data about requests to the Dog API in our application, but not custom methods get_breed() or validate_breed(). To capture that work in /doggo traces we can manually instrument nested spans to reflect their hierarchical relationship. The following creates a new span within the current trace context:
tracer.start_as_current_span()
To add this, open manual/app.py and get access to the global tracer. This is what actually creates and manages spans, shown below in bold for the new code:
...
app = Flask("hello-otel")

FlaskInstrumentor().instrument_app(app)
Jinja2Instrumentor().instrument()
RequestsInstrumentor().instrument()
tracer = provider.get_tracer(app.name)
...
Further down the file, we find the get_breed() method and create a nested span as follows:
...
def get_breed(url):
  with tracer.start_as_current_span("get_breed"):
    path = urllib3.util.parse_url(url).path
    match = re.search(r"/breeds/([^/]+)/", path)
    if match:
      result = match.group(1)
      return result
...
We now need to rebuild the container image and run the pod to verify as follows:
$ podman build -t hello-otel:manual -f manual/Buildfile-manual

$ podman play kube manual/app_pod.yaml
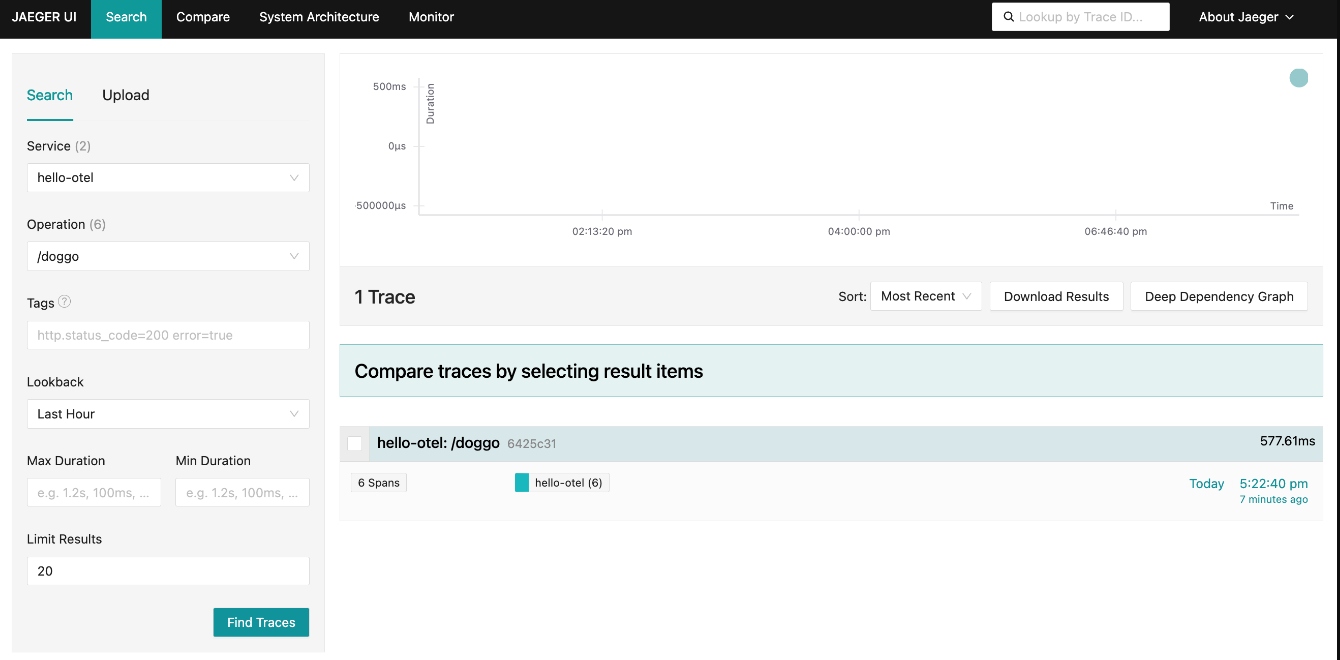
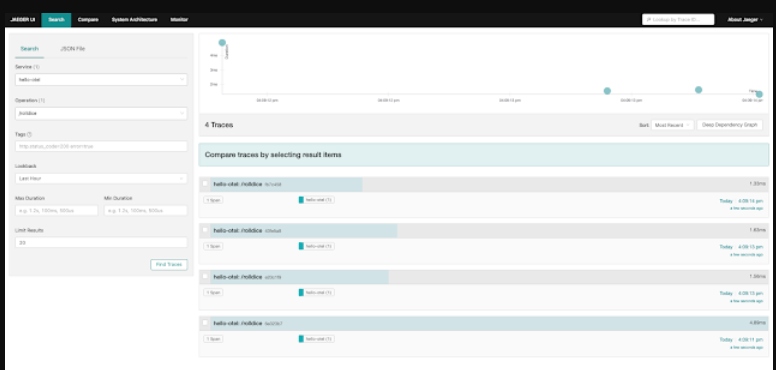
With the pod running open a browser to http://localhost:8080/doggo and make a few requests by refreshing the page. Open the Jaeger UI at http://localhost:16686, searching for traces for the operation /doggo. You should see that the span count has increased but to confirm, click on a trace:
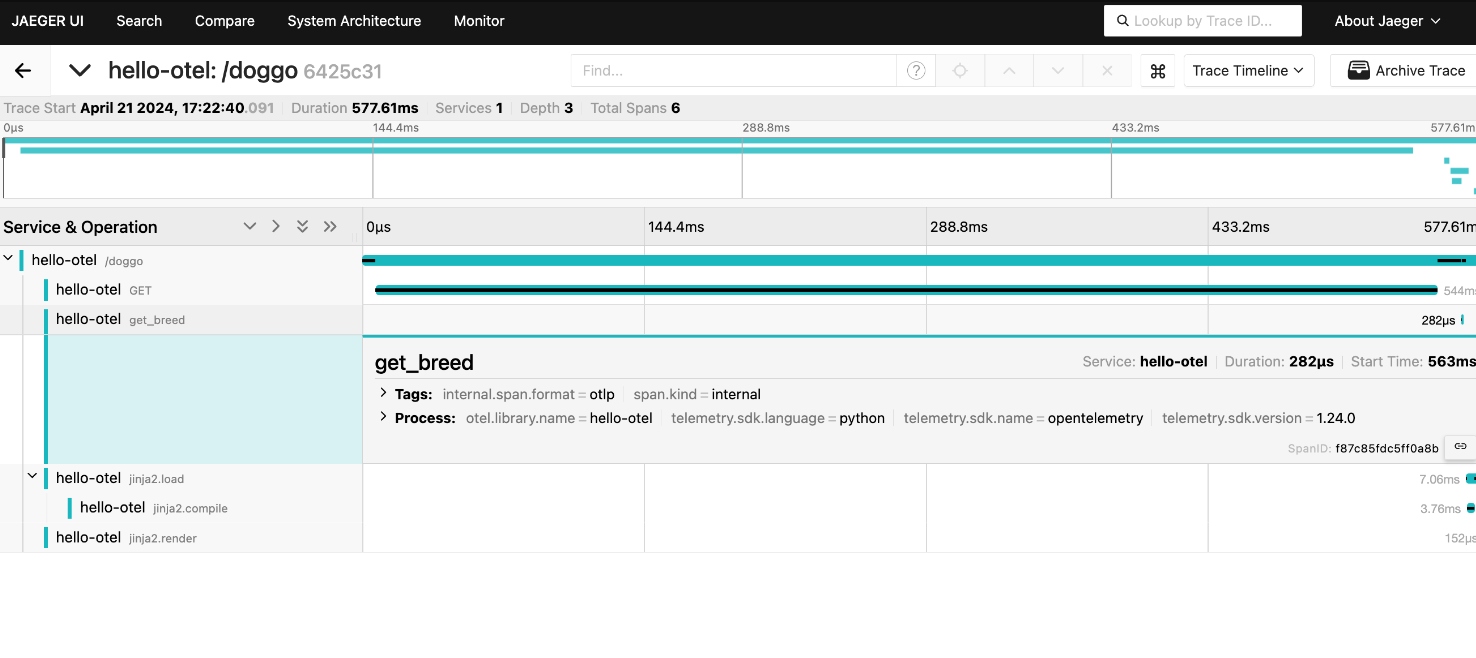
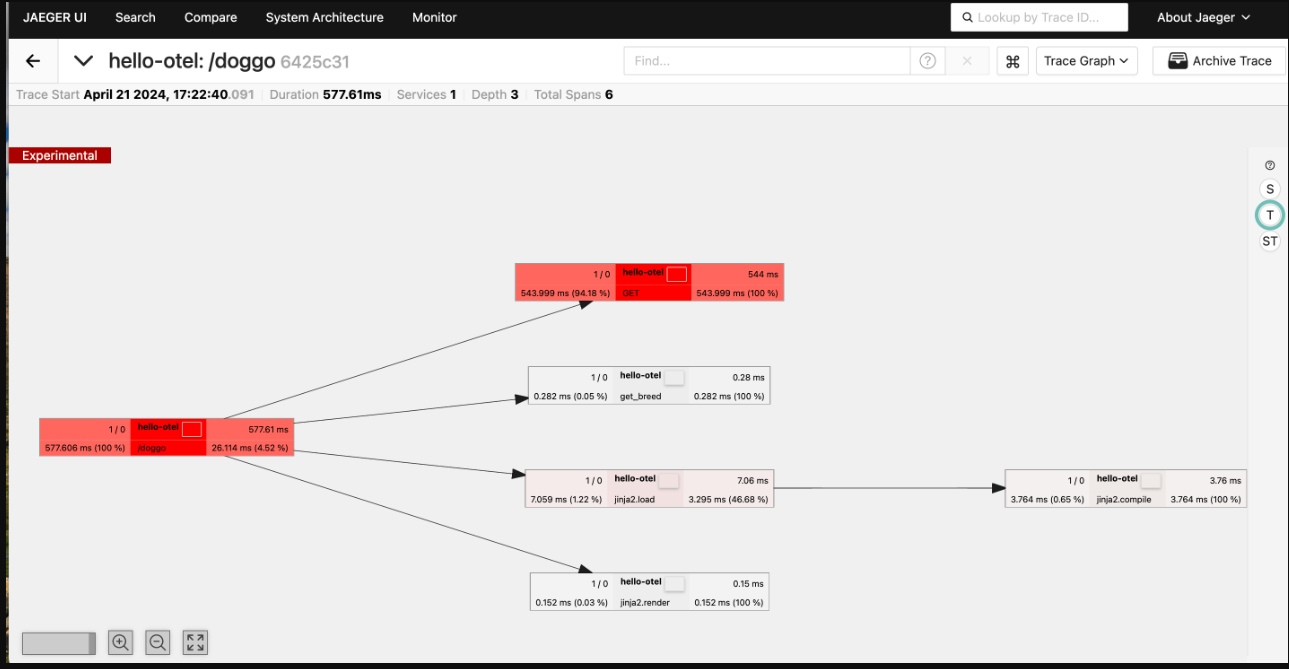
Now let's verify we are receiving tracing data from the nested spans. The trace waterfall should show one span for the overall request to /doggo, the GET request to the Dog API, and the operation get_breed() to give a fuller picture of where time is spent fulfilling requests to /doggo:
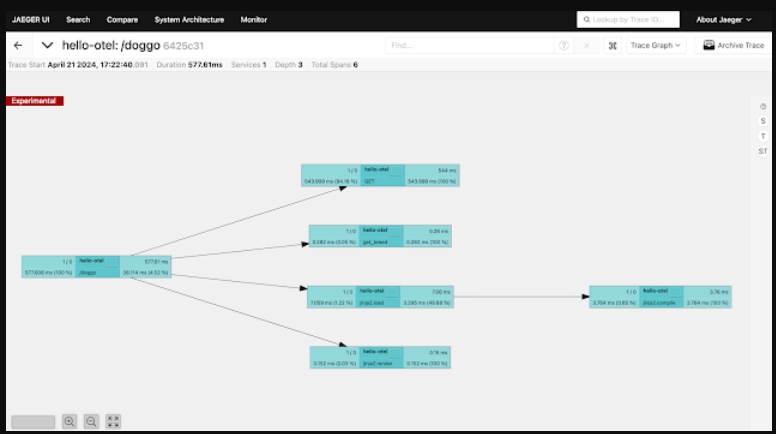
So far we've used the trace waterfall to visualize our traces. Let's try another option by clicking on the menu in the upper right corner and selecting Trace Graph:
By clicking on the T over on the right-hand vertical menu bar, we can color the critical path or the spans that directly contribute to the slowest path of processing this request. This is how we can view a trace graph by time:
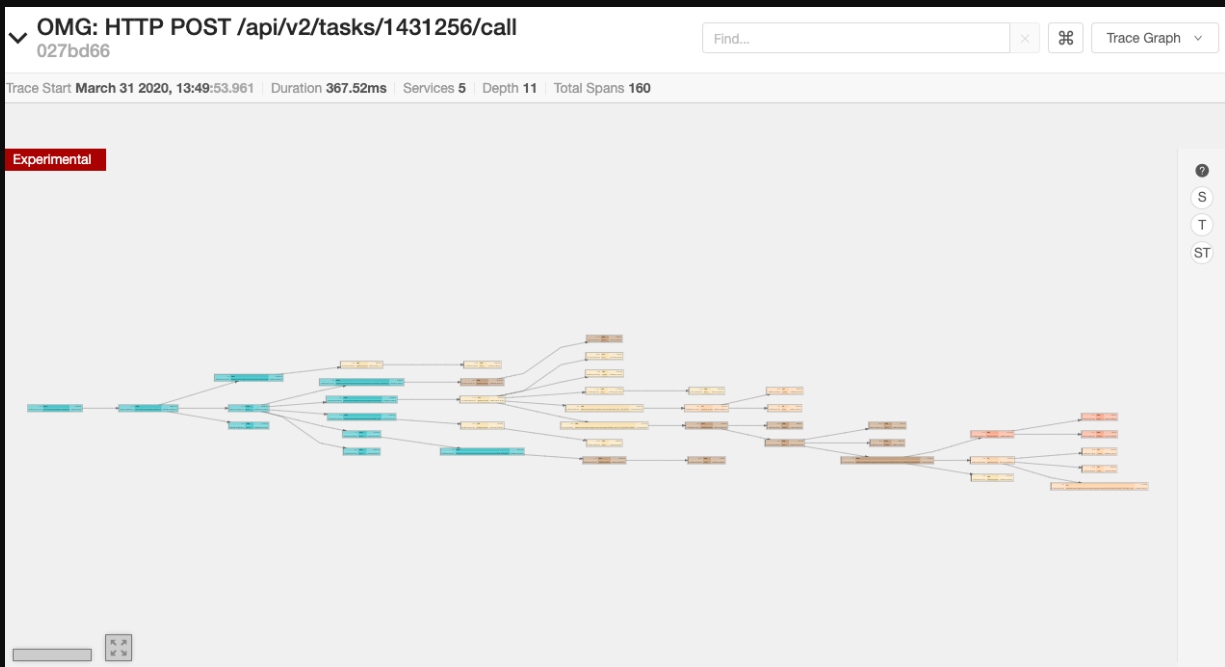
In this example, we're only working with small traces. You can imagine with larger trace samples, such as this example with 160 spans, a birds-eye view can be a very powerful tool when troubleshooting more complex traces:
Now let's try adding more span events to our application, but first, we need to stop the running pod so we can add more code to the application:
$ podman play kube manual/app_pod.yaml --down
Now let's add span events.
Adding Span Events
An event contains a structured log with a name, one or more attributes, and a timestamp. These are used to add structured annotations to a current span:
span.add_event(name, attributes)
To add one to our application, open the file manual/app.py and add a span event representing the result of the dice roll to the roll_dice() method as follows. Note the new code is in bold type:
...
@app.route("/rolldice")
def roll_dice():
  sp = trace.get_current_span()
  result = do_roll()
  sp.add_event("rolled dice",attributes={"result":result})
  return result
...
We now need to rebuild the container image and run the pod to verify as follows:
$ podman build -t hello-otel:manual -f manual/Buildfile-manual

$ podman play kube manual/app_pod.yaml
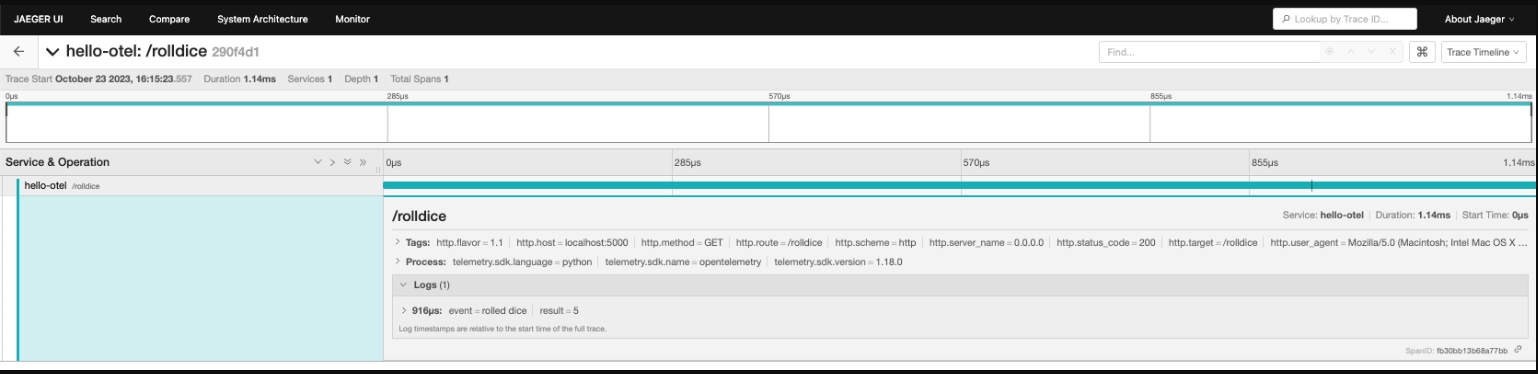
With the pod running, open a browser to http://localhost:8080/rolldice and make a few requests by refreshing the page. Open the Jaeger UI at http://localhost:16686, search for traces for the operation /rolldice, and click on a trace:
It is of note that the timestamp associated with this span event is relative to the start time of the trace itself:
Now let's try exploring span status, but first, we need to stop the running pod so we can add more code to the application:
$ podman play kube manual/app_pod.yaml --down
Now let's see what defines a span status.
Adding Span Status
A span status is typically used to identify spans that have not been completed successfully and can be set any time before the span is finished. Spans can have a status of Unset, OK, or Error.
span.set_status(status, description)
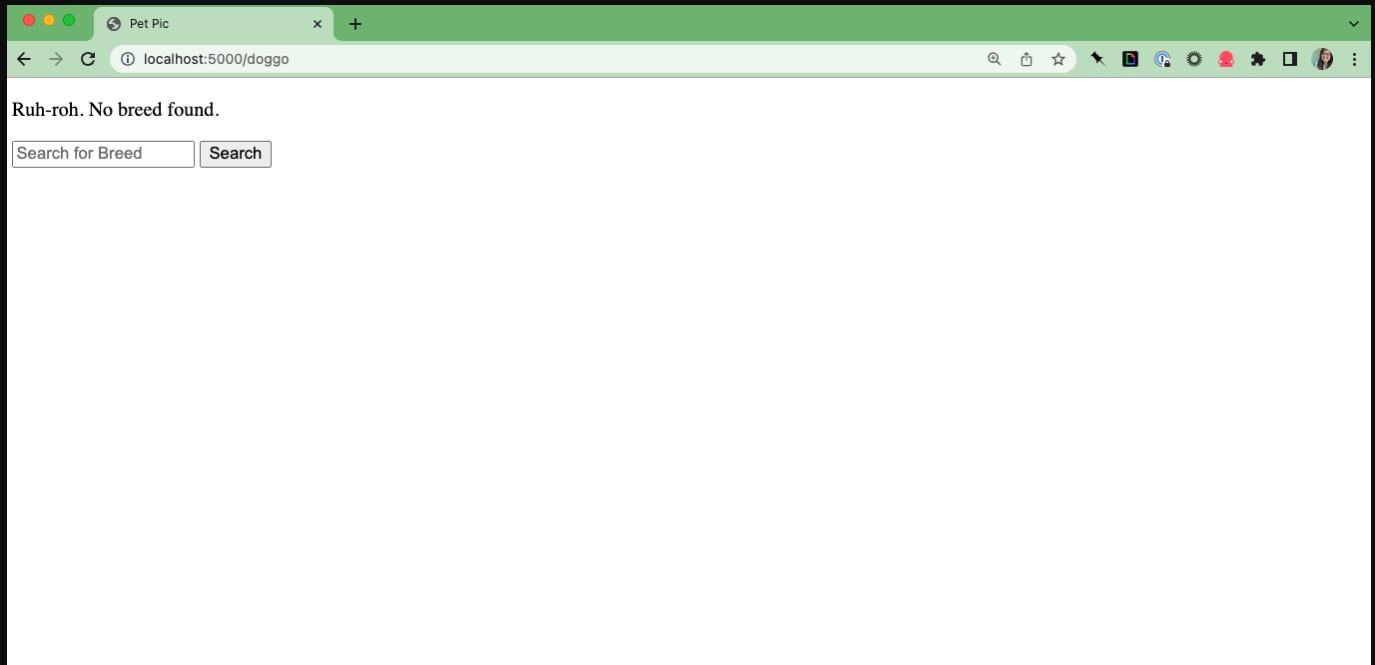
The /doggo page allows users to search for images of a specific dog breed. If the search term is invalid, an error message is returned to the user and the request successfully returns 200 OK. If we consider invalid searches to be errors, we need to instrument validate_breed() to trace this activity. This will not make the entire trace failed, but noting the error on a span will be helpful to our application visibility.
To add a span status, open the file manual/app.py and locate validate_breed(). Create a nested span and add an attribute for the breed to help us understand what the user was searching for as follows with bold type indicating our new code:
...
def validate_breed(breed):
  with tracer.start_as_current_span("validate_breed") as span:
    span.set_attribute("breed", breed)
      if breed not in breeds:
        raise ValueError("No breed found.")
      return
...
We now need to rebuild the container image and run the pod to verify as follows:
$ podman build -t hello-otel:manual -f manual/Buildfile-manual

$ podman play kube manual/app_pod.yaml
With the pod running, open a browser to http://localhost:8080/doggo and make a few requests by refreshing the page. Search for valid dog breeds like Doberman or Akita and nonsense terms like woof:
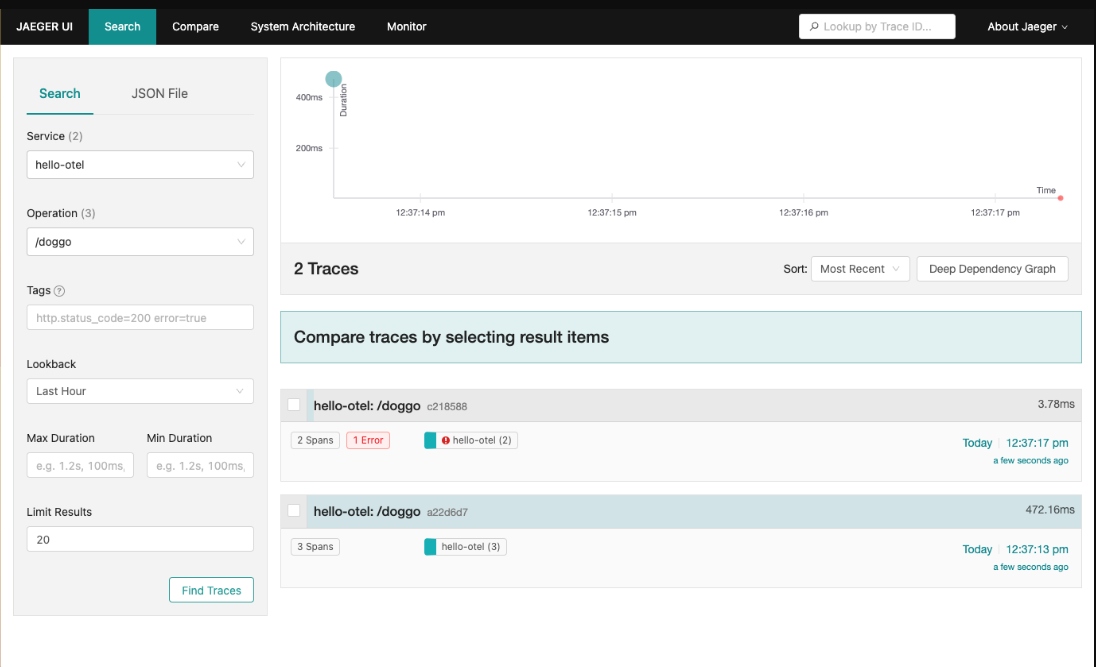
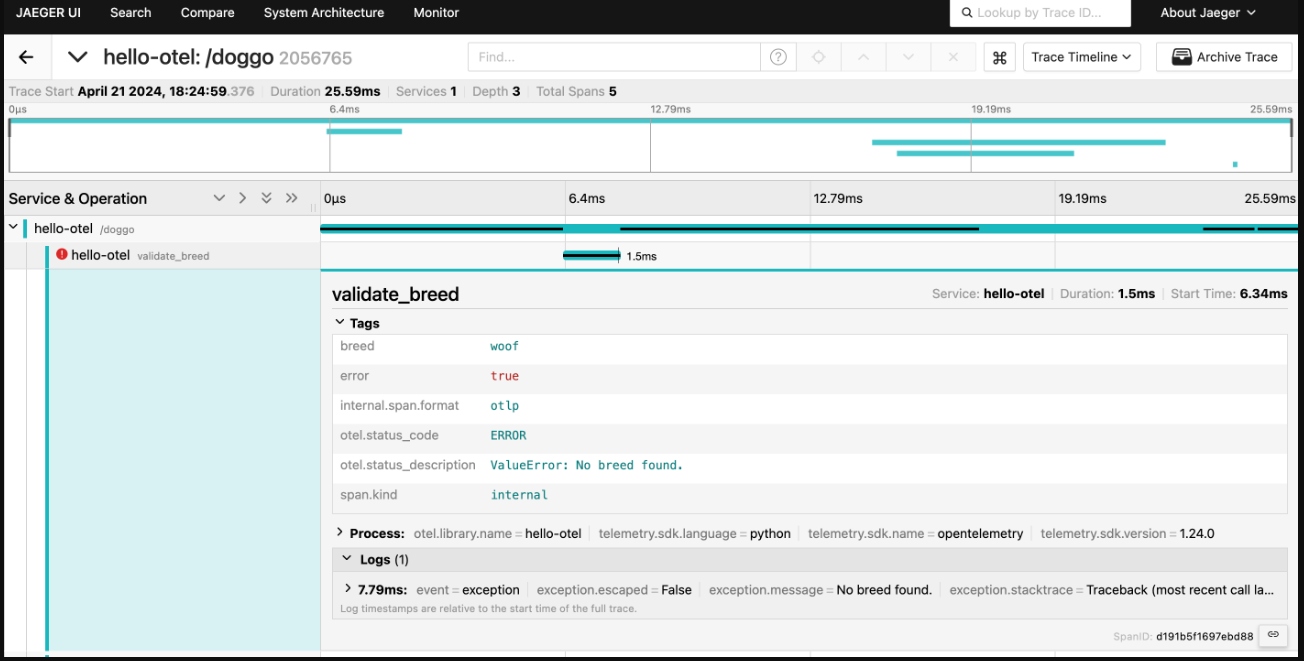
Now open the Jaeger UI at http://localhost:16686 and search for traces for the operation /doggo. We are verifying that there is at least one trace with a successful request marked with an error. Click that trace to see the detailed view:
Verify that the error message is recorded on the search_breed span and that the breed is recorded as a span attribute:
As we have seen, combining programmatic and manual instrumentation to enhance our application visibility provided by tracing data is another powerful addition to our toolbox. We've explored and added span attributes, enhanced our programmatic instrumentation, added span events, and explored tracing span status.
These examples use code from a Python application that you can explore in the provided hands-on workshop.
What's Next?
This article detailed manually instrumenting our application to add metadata specific to our business needs, allowing us to derive better insights faster.
In our next article, we will be turning to manually instrumenting metrics for our application.
Published at DZone with permission of Eric D. Schabell. See the original article here.
Opinions expressed by DZone contributors are their own.
Comments