Health Check Response Format for HTTP APIs
Continue a journey of getting more familiar with HTTP APIs and learn about a great initiative to standardize health checks across the industry.
Join the DZone community and get the full member experience.
Join For FreeI'm continuing my journey of getting more familiar with HTTP APIs by reading related RFCs. This time, I read the Health Check Response Format for HTTP APIs at the suggestion of Stefano Fago. In this post, I'd like to summarize my reading.
Note that it's a draft. Moreover, it has been dormant for nearly two years and, thus, has been automatically expired. However, it's the closest to a specification on health checks and thus deserves some love.
Sample Data Visualization
Even though it's not a long read, it's a bit "dry." Fortunately, the specification offers a JSON sample. I copy-pasted it in PlantUML, and presto, it shows a visual representation of it:
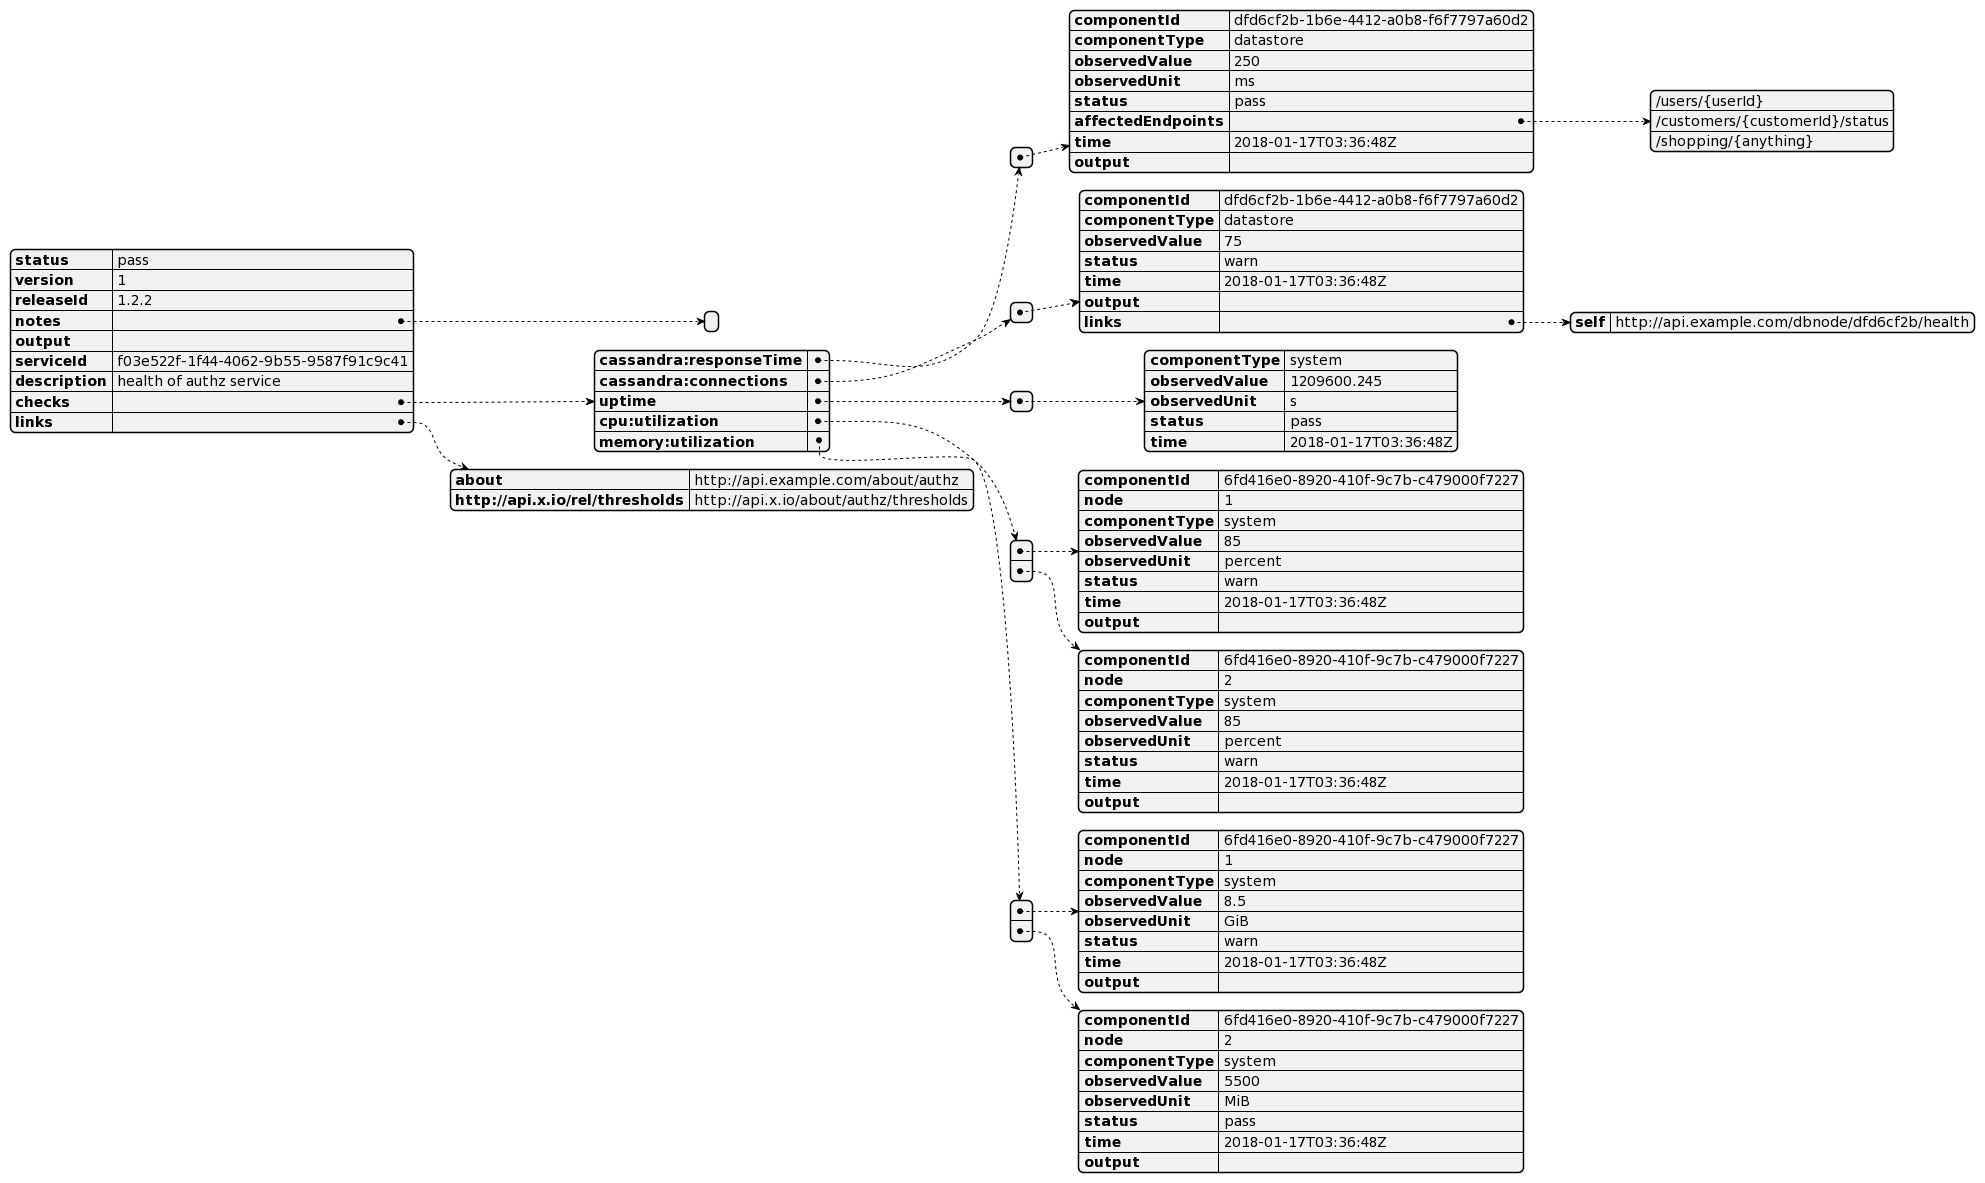
Let's have a look at the proposed structure element by element.
The Root Object
At its simplest, the response is a JSON object with a mandatory status property:

Values can be:
passfor healthy status: The value can also beok(for NodeJS) andup(for Spring Boot) to account for existing health check libraries. The HTTP status code must be in the range from 2xx to 3xx.warnfor healthy status but with concerns with the same HTTP status rangefailto indicate unhealthy status: possible alternative values includeerror(NodeJS) anddown(Spring Boot). The HTTP status code must be in the range from 4xx to 5xx.
One can add additional optional values:
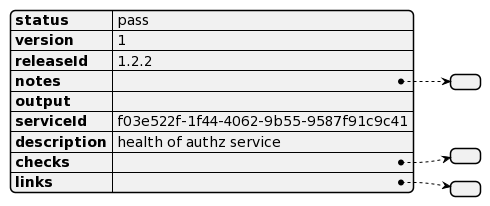
version: Public version of the servicereleaseId: Internal version of the service; for example, theversionwould be incremented for non-compatible change, while thereleaseIdcould be the commit hash or a semantic versionserviceId: The unique identifier of the servicedescription: self-explanatorynotes: Array of non-structured notesoutput: Plain error message in case ofpassorwarn.; the field should be left blank forpass
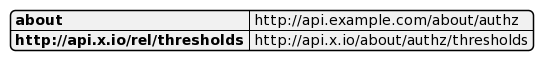
The links Objects
The links object consists of object pairs. Values are URIs, while keys can be URIs or common/registered ones: see RFC5988 for common values; e.g., self.
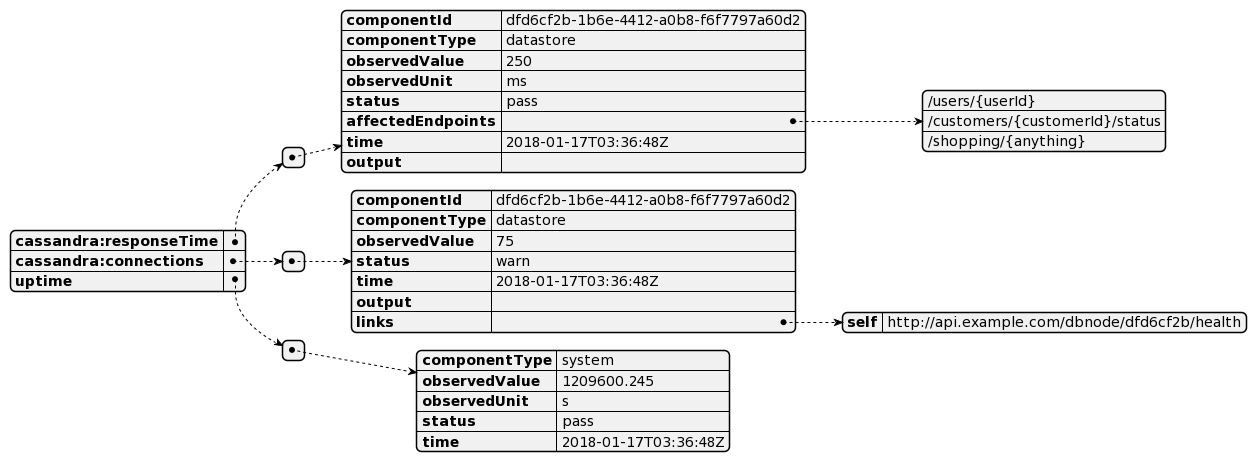
The checks Objects
Keys of checks objects consist of two terms separated by a colon, component name, and measurement name. The latter can be either:
- A pre-defined value:
utilization,responseTime,connections, oruptime - A standard term from a well-known source; e.g., IANA, microformat.org, etc.
- A URI
Values consist of one of the following keys:
componentId: unique id of this componentcomponentType:- A pre-defined value,
component,datastore, orsystem - A standard term from a well-known source; e.g., IANA, microformat.org, etc.
- A URI
- A pre-defined value,
observedValue: Any valid JSON valueobservedUnit: Unit of measurementstatus: As the parent object's status, but for this component, onlyaffectedEndpoints: If the component is notpass, lists all affected endpointstime: Date-time in ISO8601 format of the observationoutput: As the parent object's output, but for this component, onlylinks: See the previous section- Any other non-standard value
I tried implementing the above with Spring Boot using a custom HealthIndicator. Here's the best I could come up with:

The current structure of the JSON response needs to be (easily?) customizable. You'd need to create your endpoint. I hope the Spring Boot team provides the option to generate a compatible structure.
Conclusion
The Healthcheck IETF draft is a great initiative to standardize health checks across the industry. It would allow monitoring tools to rely on HTTP status and response body without ad-hoc configuration on each service.
Unfortunately, the draft is expired because of a lack of activity. I'd love to see it revived, though.
To Go Further:
Published at DZone with permission of Nicolas Fränkel. See the original article here.
Opinions expressed by DZone contributors are their own.
Comments