How to Adjust the RPS in Your JMeter Test via the Command Line
In this tutorial, you'll learn how to adjust the RPS through the command line for a one time run, and via Shell script for an automated run in JMeter.
Join the DZone community and get the full member experience.
Join For FreePerformance testing specifications usually state how many requests per second (RPS), or throughput, the application should hold to reach eligibility for production. Sometimes, RPS is numerically included in the requirement, e.g: for 1000 HTTP requests per second, the application response time should be less than 200 msec. Or, it can be identified as the goal of a series of tests, e.g: find the RPS that produces a response time of less than 250 ms, for 95% of the messages.
In this blog post, we will show how to adjust RPS in Apache JMeter™. First, we will use JMeter'sConstant Throughput Timer element and the command line. Then, we will show how to automate long run executions by splitting the RPS into different time slots through a Shell script.
Let's get started.
One of the most commonly used timers in JMeter, the Constant Throughput Timer enables you to decide how many samples should be executed per minute. The Constant Throughput Timer will add random pauses between requests during test execution to match the required throughput figure (samples per minute).
Let's create a simple scenario for using the Constant Throughput timer, and then adapt the jmx script to handle the input RPS from the command line.
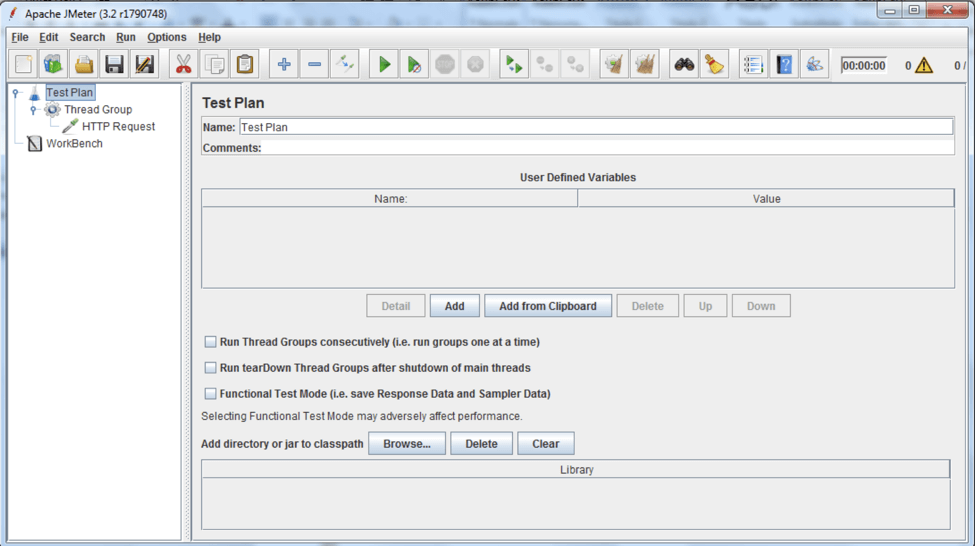
1. Add a Thread Group and a Sampler to your Test Plan.

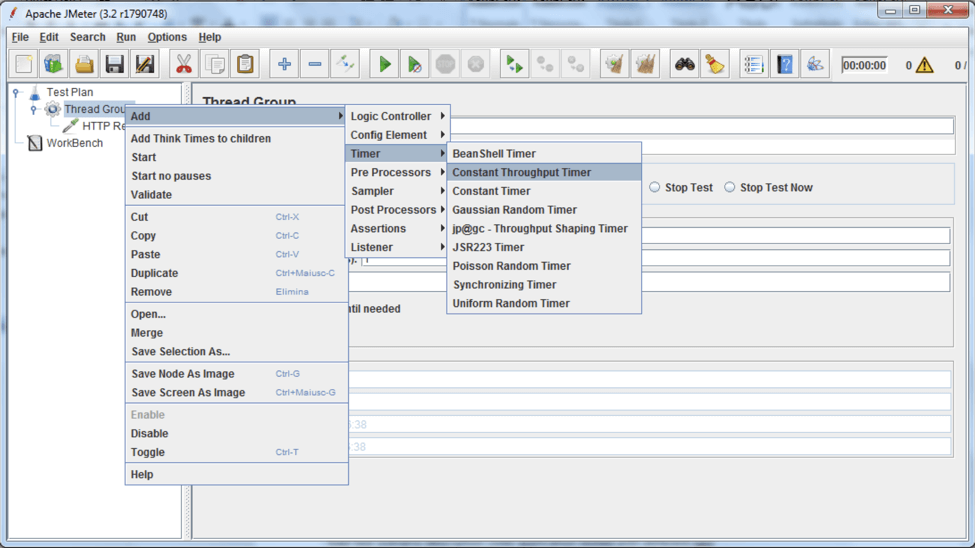
2. Now, add the Constant Throughput Timer.
Right click on Thread Group > Add > Timer > Constant Throughput Timer.
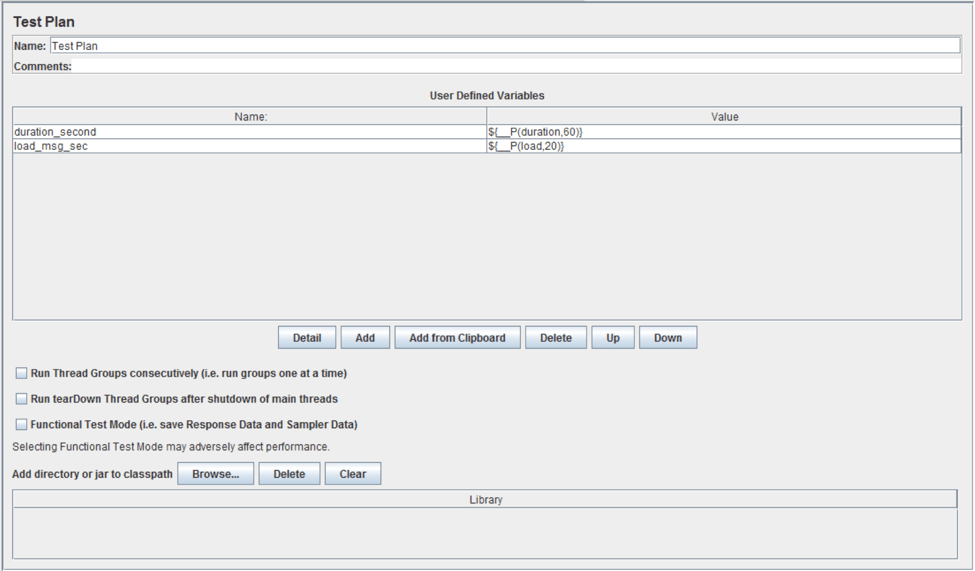
3. Go back to the "Test Plan" node. Add two entries to the "User Defined Variables" section:
- "duration_second", this variable will parametrize the duration of scenario execution. I set the value to 60, but this will be changed via the command line later.
- "load_msg_sec", this variable will parametrize the RPS load of the application under test. I set the value to 20, but this will be changed via the command line later.
The "__P" function includes the default value to be used if JMeter is missing any command line arguments at launch time.
These user-defined variables are fetched by command line arguments at launch time and resolved by them. In addition, variable values are constant for all threads during JMeter execution.

The "Constant Throughput Timer" requires that the target throughput is described as "sample per minute." Therefore, it's necessary to "translate" RPS to "sample per minute." To obtain that conversion without losing readability we can use the JEXL expression available in the JMeter function.

As visible in the screenshot above, the "sample per minute" value equals: ${__jexl2(${load_msg_sec}*60)}
Take into account that the "__jexl2" function is used here. For the newer JMeter 3.x versions use "__jexl3." For the purpose of this blog post, both functions are equivalent. To read a complete overview of JMeter functions, click here.
Now, the RPS value can be defined at runtime through the command line.
As described here, command line arguments can be used to modify variables defined in the JMeter script. These values are valid for one execution. For this current example, the complete command line invocation can be: <JMETER_PATH>/bin/jmeter -n -t <JMX_SCRIPT> -Jduration=600 -Jload=50
This is customized as:
- -n, no GUI mode.
- -t <JMX_SCRIPT>, which jmx script to use for execution.
- -Jduration=600, if the jmx script defines the "duration" label with the "__P" function, its value is replaced with 600.
- -Jload=50, if the jmx script defines the "load" label with the "__P" function, its value is replaced with 50.
This command line produces a non-GUI execution of our script, for a duration of ten minutes and request per second of 50 msg/s.
An example of standard output can look like this:
Creating summariser <summary>
Created the tree successfully using <JMX_SCRIPT>
Starting the test @ Mon Aug 21 16:06:17 CEST 2017 (1503324377534)
Waiting for possible Shutdown/StopTestNow/Heapdump message on port 4445
summary + 98 in 00:00:02 =   42.4/s Avg:   178 Min:    77 Max:   767 Err: 0 (0.00%) Active: 45 Started: 45 Finished: 0
summary +   1633 in 00:00:30 =   54.4/s Avg:   191 Min:    77 Max:   312 Err: 0 (0.00%) Active: 200 Started: 200 Finished: 0
summary =   1731 in 00:00:32 =   53.6/s Avg:   191 Min:    77 Max:   767 Err: 0 (0.00%)
……
……
……
summary =  56962 in 00:19:02 =   49.9/s Avg:   239 Min:    77 Max:  8011 Err:45 (0.08%)
summary +   1498 in 00:00:30 =   49.9/s Avg:   217 Min:   191 Max:  8008 Err: 1 (0.07%) Active: 200 Started: 200 Finished: 0
summary =  58460 in 00:19:32 =   49.9/s Avg:   238 Min:    77 Max:  8011 Err:46 (0.08%)
summary +   1660 in 00:00:39 =   42.2/s Avg:   208 Min:    77 Max:  8005 Err: 1 (0.06%) Active: 0 Started: 200 Finished: 200
summary =  60120 in 00:20:12 =   49.6/s Avg:   238 Min:    77 Max:  8011 Err:47 (0.08%)
Tidying up ...    @ Mon Jul 31 09:57:39 CEST 2017 (1501487859369)
... end of run
The execution is complete and the results can be analyzed (e.g. jtl file, graphs, etc...).
After completing the execution, you can relaunch the jmx script with a new set of mapped variables and force the just executed test to a new RPS value. Take into account that every jmx script execution makes use of an RPS value, so to obtain RPS modification it is necessary to chain more jmx script executions. To automate jmx script execution, you can use Shell scripting.
Now let's suppose our specification requires us to run a script for a long time, but with different RPSs. In such a situation, it's recommended to automate the run phase with a Shell script. A Shell script is a text file that contains a sequence of commands for an operating system.
Here are two execution script templates, in Bash and PowerShell, for Unix-like and Windows operating systems. Both scripts describe how to run command line arguments, to obtain a specific RPS load in JMeter. In these examples, the JMX script is executed twice, first with 50 rps and then with 100 rps.
#!/bin/bash

JMX_SCRIPT=<path to jmx script>
JMETER_APPL=<path to JMeter>
EXEC_TS=$(date +%Y%m%d%H%M%S)

loads=( 50 100 )

for rps in "${loads[@]}"
do
echo "Execute stress script with load $rps msg/sec"
    STDOUT_FILE="./stdout_${EXEC_TS}_${rps}.out"
    nohup $JMETER_APPL/bin/jmeter -n -t $JMX_SCRIPT -Jload=$rps -Jduration=600 &> $STDOUT_FILE&
    sleep 30
done
You can change these parameters in this part of the script: loads=( 50 100 )
$ExecTimestamp=(Get-Date).ToString('yyyyMMdd_HHMMss')

$JmxFile=<path to jmx script>
$RequestPerSeconds=(50, 100)

$jmeterbin = <path to jmeter>

foreach ($rps in $RequestPerSeconds) {

              "Request per second : $rps"

$jmeterargs =  ("-n",
                    "-t",
                    "`"$JmxFile`"",
              "-Jduration=600",
              "-Jload=$rps")

              try
              {
                                $stdOutLog = "$BaseScriptPath\stdout_$ExecTimestamp" + "_" + "$rps.out"
                                $process = Start-Process -NoNewWindow -FilePath "`"$jmeterbin\jmeter.bat`"" -ArgumentList $jmeterargs -Wait -WorkingDirectory $BaseScriptPath -RedirectStandardOutput $stdOutLog
              }
              catch [Exception]
              {
                                # Sometimes exception occur, this handler makes it silent
                            Write-Error "XXXXX Exception occurs during JMeter : $_.Exception.Message"
              }

              sleep 30
}
You can change these parameters in this part of the script: $RequestPerSeconds=(50, 100)
That's it! You now know how to adjust the RPS through the command line for a one time run, and via Shell script for an automated run.
You can learn more JMeter for free through our JMeter academy.
Published at DZone with permission of Vincenzo Marrazzo, DZone MVB. See the original article here.
Opinions expressed by DZone contributors are their own.

Comments