How to Build a Coronavirus Dashboard in Java
Join the DZone community and get the full member experience.
Join For FreeThis tutorial explains how to create a simple dashboard to track coronavirus data using the Java programming language. The dashboard is a web application implemented with Spring Boot 2.2.6 and Vaadin 14.1.25. It includes features of Progressive Web Applications (PWA), such as responsive design and the possibility to install the app onto the home screen of mobile phones and other devices.
The source code is available on GitHub.
Setting Up a New Project
To set up a new project:
Go to https://start.spring.io and generate a new Maven project with JAR packaging and the following dependencies:
OpenFeign: Declarative REST Client. OpenFeign creates a dynamic implementation of an interface decorated with JAX-RS or Spring MVC annotations.
Vaadin: Java framework for building rich client apps based on Web Components.
Import the Maven project into your favorite IDE. This tutorial uses IntelliJ IDEA.
Add the following dependencies to the
pom.xmlfile:
xxxxxxxxxx
<dependency>
<groupId>com.vaadin</groupId>
<artifactId>vaadin-board-flow</artifactId>
</dependency>
<dependency>
<groupId>com.vaadin</groupId>
<artifactId>vaadin-charts-flow</artifactId>
</dependency>
<dependency>
<groupId>com.vaadin</groupId>
<artifactId>vaadin-cookie-consent-flow</artifactId>
</dependency>
Connecting to a REST Web Service
The dashboard uses data from the REST web service available for free (at the time of writing this article) at https://corona-api.com.
Generating the Data Model
To create the data model (POJOs to store data from the web service):
Add the following Maven plugin into the
<plugins>section of the<build>section:
xxxxxxxxxx
<plugin>
<groupId>org.jsonschema2pojo</groupId>
<artifactId>jsonschema2pojo-maven-plugin</artifactId>
<version>1.0.2</version>
<configuration>
<sourcePaths>${basedir}/src/main/resources/timeline.json</sourcePaths>
<sourceType>json</sourceType>
<includeAdditionalProperties>false</includeAdditionalProperties>
<includeToString>false</includeToString>
<includeHashcodeAndEquals>false</includeHashcodeAndEquals>
<targetPackage>com.example</targetPackage>
</configuration>
<executions>
<execution>
<goals>
<goal>generate</goal>
</goals>
</execution>
</executions>
</plugin>
Create a new
timeline.jsonfile in thesrc/main/resources/directory with the following sample JSON content taken from the web service:
xxxxxxxxxx
{
"data": [
{
"updated_at": "2020-04-24T16:24:27.242Z",
"date": "2020-04-24",
"deaths": 193851,
"confirmed": 2759409,
"recovered": 764188,
"active": 1801370,
"new_confirmed": 52374,
"new_recovered": 26541,
"new_deaths": 3029,
"is_in_progress": true
},
{
"updated_at": "2020-04-23T08:58:50.000Z",
"date": "2020-04-23",
"deaths": 190822,
"confirmed": 2707035,
"recovered": 737647,
"new_confirmed": 85448,
"new_recovered": 28768,
"new_deaths": 7831,
"active": 1778566
}
],
"_cacheHit": true
}
To compile the application, you need to install Node.js. Once installed, execute
mvn packageand confirm that the POJOs are generated in thetarget/generated-sources/jsonschema2pojo/com/example/directory.Mark the
target/generated-sources/jsonschema2pojo/directory as source root in your IDE (on IntelliJ IDEA, right-click the directory, and select Mark Directory As > Sources Root).
Implementing the Web Service Client
To create a web service client:
Enable Feign clients as follows:
xxxxxxxxxx
public class CoronavirusDashboardApplication {
public static void main(String[] args) {
SpringApplication.run(CoronavirusDashboardApplication.class, args);
}
}
Create the following Java interface:
xxxxxxxxxx
(name = "corona-ip", url = "https://corona-api.com/")
public interface CoronavirusService {
(value = "/timeline")
Timeline timeline();
}
Implementing the UI
To implement the UI to show the data:
Implement a UI component to show a number as follows:
xxxxxxxxxx
public class DashboardNumber extends VerticalLayout {
public DashboardNumber(String description, Number number) {
Div descriptionDiv = new Div(new Text(description));
descriptionDiv.getStyle().set("font-size", "small");
Div numberDiv = new Div(new Text("" + number));
numberDiv.getStyle().set("font-size", "xx-large");
numberDiv.getStyle().set("font-weight", "bold");
numberDiv.getStyle().set("margin-top", "0");
add(descriptionDiv, numberDiv);
}
}
Implement a UI component to show a chart as follows:
xxxxxxxxxx
public class DashboardChart extends VerticalLayout {
public DashboardChart(List<Datum> data, ChartType type, String title,
Function<Datum, Number> getConfirmed, Function<Datum, Number>
getDeaths, Function<Datum, Number> getRecovered) {
Chart chart = new Chart(type);
Configuration configuration = chart.getConfiguration();
configuration.setTitle(title);
configuration.getTooltip().setEnabled(true);
configuration.getxAxis().setType(AxisType.DATETIME);
configuration.addSeries(getDataSeries(data.stream(), getConfirmed, "Confirmed"));
configuration.addSeries(getDataSeries(data.stream(), getDeaths, "Deaths"));
configuration.addSeries(getDataSeries(data.stream(), getRecovered, "Recovered"));
add(chart);
}
private DataSeries getDataSeries(Stream<Datum> data, Function<Datum,
Number> function, String name) {
DataSeries dataSeries = new DataSeries(data
.map(d -> new DataSeriesItem(
LocalDate.parse(d.getDate()).atStartOfDay().toInstant(ZoneOffset.UTC),
function.apply(d)
))
.collect(Collectors.toList()));
dataSeries.setName(name);
return dataSeries;
}
}
Implement a view by creating the following class:
x
("")
public class DashboardView extends VerticalLayout {
public DashboardView(CoronavirusService service) {
List<Datum> data = service.timeline().getData();
Datum latest = data.get(0);
add(
new H1("Coronavirus dashboard"),
new DashboardNumber("Confirmed", latest.getConfirmed()),
new DashboardNumber("Deaths", latest.getDeaths()),
new DashboardNumber("Recovered", latest.getRecovered()),
new DashboardChart(data, ChartType.SPLINE, "Cumulative",
Datum::getConfirmed, Datum::getDeaths,
Datum::getRecovered),
new DashboardChart(data.subList(0, 7), ChartType.COLUMN, "Daily",
Datum::getNewConfirmed, Datum::getNewDeaths,
Datum::getNewRecovered)
);
}
}
Adding PWA Features to the Application
At this point, the application is functional. However, there are two improvements that are easy to add.
Adding Responsiveness to the UI
To add responsive features to the application, replace the call to the add method in the DashboardView class with the following:
x
Board board = new Board();
board.addRow(
new DashboardNumber("Confirmed", latest.getConfirmed()),
new DashboardNumber("Deaths", latest.getDeaths()),
new DashboardNumber("Recovered", latest.getRecovered())
);
board.addRow(
new DashboardChart(data, ChartType.SPLINE, "Cumulative",
Datum::getConfirmed, Datum::getDeaths, Datum::getRecovered),
new DashboardChart(data.subList(0, 7), ChartType.COLUMN, "Daily",
Datum::getNewConfirmed, Datum::getNewDeaths,
Datum::getNewRecovered)
);
add(
new H1("Coronavirus dashboard"),
board
);
Making the Application Installable
To make the application installable on devices such as mobile phones, annotate the DashboardView class as follows:
xxxxxxxxxx
("")
(name = "Coronavirus Dashboard", shortName = "Coronavirus",
description = "A Coronavirus dashboard app")
public class DashboardView extends VerticalLayout {
...
}
Compiling and Running the Application
Note that you need to install Node.js to compile the application. Compile and run the application by running the following:
xxxxxxxxxx
mvn package
java -jar target/coronavirus-dashboard-0.0.1-SNAPSHOT.jar
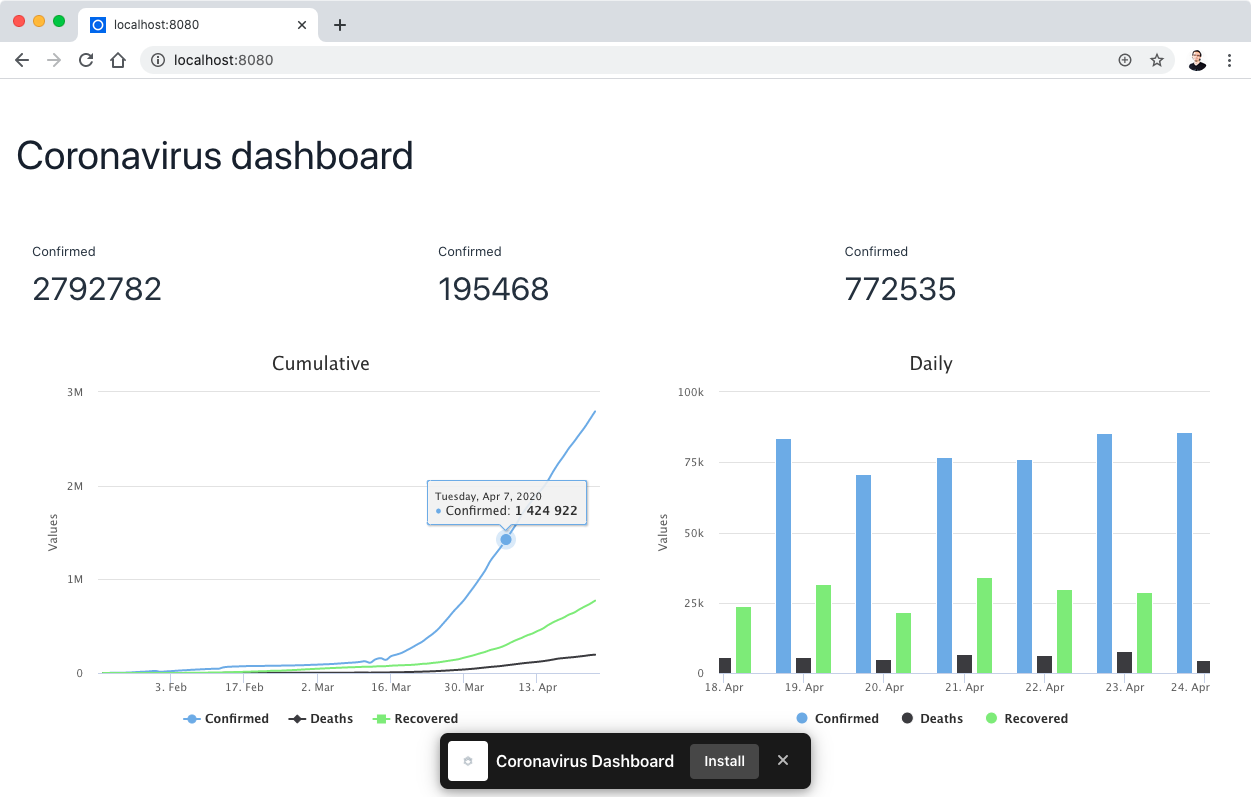
Here's a screenshot of the application:
What's Next?
Try installing the application on your phone. On Safari, you might have to use the share option and select Add to Home Screen. Keep in mind that unless deployed on localhost, you'll need to serve your app through HTTPS for this to work.
Try activating the dark theme of Vaadin by adding the following annotation to the DashboardView class:
xxxxxxxxxx
(value = Lumo.class, variant = Lumo.DARK)
See the web service documentation and all the available types of charts in Vaadin and try adding new charts to the dashboard or an option to show data by country.
Opinions expressed by DZone contributors are their own.
Comments