How To Build an Ethereum Gas Tracker With Infura
Let’s build your own gas tracker using Infura—a powerful suite of APIs and dev tools—that can help you become a successful Ethereum developer.
Join the DZone community and get the full member experience.
Join For FreeIntroduction
When you first start creating smart contracts on Ethereum, you quickly realize that understanding gas and gas prices is fundamental for successful projects. When done correctly, tracking gas prices can help you realize thousands of dollars in savings on deployments.
But what exactly are gas and gas prices, and how do you track them?
Let’s answer that question and then use Infura—a powerful suite of APIs and dev tools—to build your own gas tracker that can help you become a successful Ethereum developer.
What Are Gas and Gas Prices?
In short, if you want to execute an operation or transaction on Ethereum, you have to pay a fee just like you do at the bank. This fee is made of two parts: gas and gas price.
Gas is a unit that measures the amount of computational effort required to carry out a specific operation on the Ethereum network. In general, the more complex a program (or smart contract is), the more gas it consumes.
The gas price refers to the amount paid by the deployer (or sender) for each unit of gas. Gas prices tend to fluctuate wildly on public blockchains, especially Ethereum, and the way to compute it has also changed drastically since its inception.
How Are Gas Prices Computed?
Earlier in Ethereum’s lifecycle, gas prices were computed using a blind auction model. In this model, you would offer a gas price to execute your operation.
So what you paid to execute an operation on Ethereum was gas units * gas price.
A miner would then typically pick transactions that offered the highest prices and pocket the entire amount.
Additionally, a block could only hold 15 million gas worth of transactions, regardless of the volume of traffic experienced by the network.
The London Hard Fork, which implemented the EIP-1559 proposal, resulted in the following changes:
- The blind auction price has been replaced by two fees: a base fee and a priority fee.
- The network automatically computes the base fee for the upcoming block. It can increase or decrease by a maximum of 12.5%, depending on volume. This fee is burned by the network.
- The priority fee is a tip determined by the user and paid to the validator. In general, the higher the priority fee, the faster the operation is confirmed.
- The maximum block volume has been doubled to 30 million gas to handle sudden spikes in traffic. However, the expectation is that the average volume will hover around 50%.
So now what you pay = gas units * (base fee + priority fee). (for more details, see here).
In order to execute an operation on Ethereum and estimate the corresponding cost, you’ll need to monitor three things:
- The base fee
- The range of priority fees
- The volume or gas used by the latest block.
The Project
Now that we understand gas and gas prices, let’s build a fully-functional Ethereum gas tracker so that you can watch gas prices in real time. This tutorial is divided into two parts:
- In the first part, we’ll create a node script that extracts the gas price history of the last five blocks every time a new block is mined.
- In the second part, we’ll deploy a React app that builds on top of the script created in part one. This app will act as a live dashboard of the base fee and utilization experienced in the last five blocks.
Part 1: Gas Tracker Node Script
Step 1: Install NPM and Node
We will build our project using node and NPM. Click here to install these on your local machine.
To ensure everything is working correctly, run the following command: $ node -v
If all goes well, you should see a version number for the node.
Step 2: Sign Up for an Infura Account
In order to get the latest gas prices and price history, we’ll use Infura’s Ethereum API. We use Infura because it’s easy, fast, and reliable.
Infura allows us to get all the information we need using a single API call.
After creating your account, navigate to the dashboard and Create New Key.
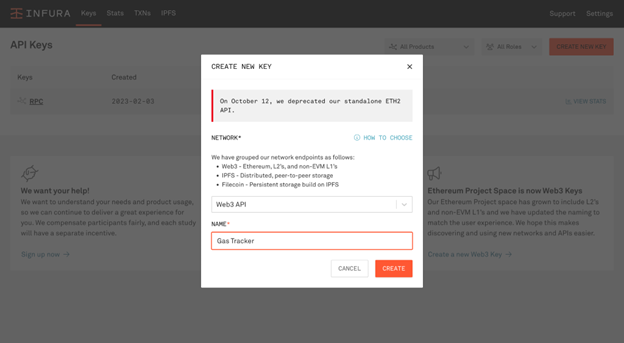
For the network, choose Web3 API and name it Gas Tracker.
Once you click on Create, Infura will generate an API key for you and automatically provide you with RPC endpoints to Ethereum, L2s, and non-EVM L1s.
For this tutorial, we are only interested in the Ethereum RPC endpoint. This URL is: https://mainnet.infura.io/v3/←API KEY→
Step 3: Create a Node Project
We now have everything we need to create our node script. Open a terminal and run the following commands to create a new node project:
$ mkdir gas-tracker && cd gas-tracker
$ npm init -y
$ npm install axios
$ touch main.js
Open the gas-tracker file in your favorite code editor. We will be writing all our code in the main.js file.
Step 4: Write the Gas Tracker Script
We’ll use Infura Ethereum API’s eth_feeHistory method to get access to the gas fees (both base and priority) and volumes of the last five blocks.
The eth_feeHistory method takes two required arguments: blockCount and newestBlock. We will set the former to five and the latter to the ‘latest.’
Open the main.js file and add the following code:
const axios = require('axios');

// Infura URl
const baseUrl = "https://mainnet.infura.io/v3/fbd1cd3ce9494434ac35c07bac0e4e74";

let data = JSON.stringify({
    "jsonrpc": "2.0",
    "method": "eth_feeHistory",
    "params": [
        "0x5",
        "latest",
        []
    ],
    "id": 1
});

var config = {
    method: 'post',
    url: baseUrl,
    headers: {
        'Content-Type': 'application/json'
    },
    data: data
};

axios(config)
    .then(function (response) {

        // Extract fee history
        let history = response['data']['result'];

        // Convert base fee to decimal Gwei
        history['baseFeePerGas'] = history['baseFeePerGas'].map(x => parseInt(x) / 10 ** 9);

        // Convert block numnber to decimal
        history['oldestBlock'] = parseInt(history['oldestBlock'])

        // Print formatted history
        console.log(history);
    })
    .catch(function (error) {
        console.log(error);
    });
Run this code using the following command: node main.js
If all goes well, you should see output that looks something like this:
{
  baseFeePerGas: [
    25.509376962,
    25.514591928,
    24.67088008,
    24.426258847,
    24.10987203,
    25.914394489
  ],
  gasUsedRatio: [
    0.5008177333333333,
    0.36772873333333334,
    0.46033846666666667,
    0.4481890666666667,
    0.7993831666666666
  ],
  oldestBlock: 16690595
}Running this script at any point in time will fetch you the latest gas prices and utilization. However, this isn’t very user-friendly. In the next section, let’s build a dashboard using React that updates every time a new block is mined into existence.
Part 2: Gas Tracker Dashboard App
Step 1: Download the Starter Repository
We’ve already created a starter repository for you with custom styles and hooks that will be useful for creating our gas tracker app.
Open your terminal and run the following commands:
$ git clone https://github.com/rounakbanik/infura-gas-tracker.git
$ npm install
This should install all the required dependencies for our app.
Step 2: Write the App Logic
Our gas tracker app will give us information on the base fee, the gas volume, and the block number of the latest five blocks on the Ethereum blockchain.
It will also refresh this data every 15 seconds by polling the Infura API using the useInterval custom hook.
The code to extract data from the API is almost identical to what we did in Part 1. We only have a few extra steps related to formatting.
Open the App.js file and replace its contents with the following:
import './App.css';
import axios from 'axios';
import { useState } from 'react';
import { useInterval } from './hooks/useInterval';

// Infura URl
const baseUrl = "https://mainnet.infura.io/v3/fbd1cd3ce9494434ac35c07bac0e4e74";

// Data and configuration required to make the API request
let data = JSON.stringify({
  "jsonrpc": "2.0",
  "method": "eth_feeHistory",
  "params": [
    "0x5",
    "latest",
    []
  ],
  "id": 1
});

let config = {
  method: 'post',
  url: baseUrl,
  headers: {
    'Content-Type': 'application/json'
  },
  data: data
};

function App() {

  // Variable that holds history of the last 5 blocks
  const [feeHistory, setFeeHistory] = useState(null);

  // useInterval is like useEffect, except that it is called after a certain interval
  // In our case, this is 15 seconds
  useInterval(() => {

    const getFeeHistory = async () => {

      // Extract fee history
      const response = await axios(config);
      let history = response['data']['result'];

      // Convert base fee to Gwei
      history['baseFeePerGas'] = history['baseFeePerGas'].map(x => (parseInt(x) / 10 ** 9).toFixed(2));

      // Convert block to decimal
      history['oldestBlock'] = parseInt(history['oldestBlock'])

      // Truncate decimals of gas used and convert to percentage
      history['gasUsedRatio'] = history['gasUsedRatio'].map(x => (x * 100).toFixed(2))

      // Get block range
      let blockRange = []
      for (let i = 0; i < 5; i++) blockRange.push(history['oldestBlock'] + i);

      // Create a 2D array consisting of all the information received from the API
      let formattedHistory = [
        blockRange,
        history['baseFeePerGas'].slice(0, 5),
        history['gasUsedRatio']
      ];

      // Transpose the array
      // This is done so we can populate HTML tables more easily
      const transpose = m => m[0].map((x, i) => m.map(x => x[i]))
      formattedHistory = transpose(formattedHistory);

      setFeeHistory(formattedHistory);
      console.log(formattedHistory);
    }

    // Call function every 15 seconds
    getFeeHistory();

  }, 1000 * 15)

  return (
    <div className="App">
      <h1>Ethereum Gas Tracker</h1>
      {feeHistory && <table>
        <thead>
          <tr>
            <th>Block Number</th>
            <th>Base Fee (in Gwei)</th>
            <th>Gas Used</th>
          </tr>
        </thead>
        <tbody>
          {feeHistory.map(row => {
            return (
              <tr key={row[0]}>
                <td>{row[0]}</td>
                <td>{row[1]}</td>
                <td>{row[2]}%</td>
              </tr>
            )
          })}
        </tbody>
      </table>}
    </div>
  );
}

export default App;npm start
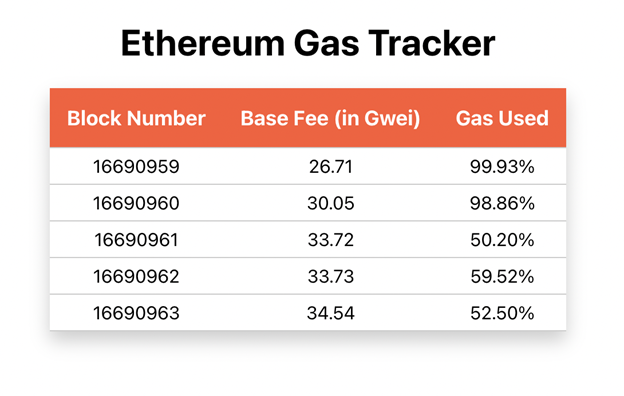 You’ll also notice that the table updates every 15 seconds to reflect blocks being added to the Ethereum chain.
Conclusion
Congratulations! You now understand what gas and gas prices are on Ethereum. You also know how to build a gas tracker from scratch using the Infura API.
Using your tracker, you can not only track the latest prices and volumes but can also assess short-term trends. Try increasing the number of blocks from 5 to 20, and you should be able to clearly see prices increasing or dropping during certain times of the day. Hope you find it useful!
Published at DZone with permission of Michael Bogan. See the original article here.
Opinions expressed by DZone contributors are their own.
Comments