How to Install the ELK Stack on Google Cloud Platform
In this article, I will guide you through the process of installing the ELK Stack (Elasticsearch 2.2.x, Logstash 2.2.x and Kibana 4.4.x) on Google Cloud Platform (GCP).
Join the DZone community and get the full member experience.
Join For Free

in this article, i will guide you through the process of installing the elk stack (elasticsearch 2.2.x, logstash 2.2.x and kibana 4.4.x) on google cloud platform (gcp).
while still lagging far behind amazon web services, gcp is slowly gaining popularity, especially among early adopters and developers — but also among a number of enterprises. among the reasons for this trend are the full ability to customize virtual machines before provisioning them, positive performance benchmarking compared to other cloud providers, and overall reduced cost.
these reasons caused me to test the installation of the world’s most popular open source log analysis platform, the elk stack , on this cloud offering. the steps below describe how to install the stack on a vanilla ubuntu 14.04 virtual machine and establish an initial pipeline of system logs. don’t worry about the costs of testing this workflow — gcp offers a nice sum of $300 for a trial (but don’t forget to delete the vm once you’re done!).
setting up your environment
for the purposes of this article, i launched an ubuntu 14.04 virtual machine instance in gcp’s compute engine. i enabled http/https traffic to the instance and changed the default machine type to 7.5 gb.
also, i created firewall rules within the networking console to allow incoming tcp traffic to elasticsearch and kibana ports 9200 and 5601 respectively.

installing java
all of the packages we are going to install require java, so this is the first step we’re going to describe (skip to the next step if you’ve already got java installed).
use this command to install java:
$ sudo apt-get install default-jre
verify that java is installed:
$ java -version
if the output of the previous command is similar to this, you’ll know that you’re on track:
java version "1.7.0_101"openjdk runtime environment (icedtea 2.6.6) (7u101-2.6.6-0ubuntu0.14.04.1)openjdk 64-bit server vm (build 24.95-b01, mixed mode)
installing elasticsearch
elasticsearch is in charge of indexing and storing the data shipped from the various data sources, and can be called the “heart” of the elk stack.
to begin the process of installing elasticsearch, add the following repository key:
$ wget -qo - https://packages.elastic.co/gpg-key-elasticsearch | sudo apt-key add -
add the following elasticsearch list to the key:
$ echo "deb http://packages.elastic.co/elasticsearch/1.7/debian stable main" | sudo tee -a /etc/apt/sources.list.d/elasticsearch-1.7.list

$ sudo apt-get update
and finally, install:
$ sudo apt-get install elasticsearch
before we start the service, we’re going to open the elasticsearch configuration file and define the host on our network:
$ sudo vi /etc/elasticsearch/elasticsearch.yml
in the network section of the file, locate the line that specifies the ‘ network.host ’, uncomment it, and replace its value with “0.0.0.0”:
network.host: 0.0.0.0
last but not least, restart the service:
$ sudo service elasticsearch restart
to make sure that elasticsearch is running as expected, issue the following curl:
$ curl localhost:9200
if the output is similar to the output below, you will know that elasticsearch is running properly:
{
   "name" : "hannah levy",
   "cluster_name" : "elasticsearch",
   "version" :
      {     "number" : "2.3.4",
             "build_hash" : "e455fd0c13dceca8dbbdbb1665d068ae55dabe3f",
             "build_timestamp" : "2016-06-30t11:24:31z",
             "build_snapshot" : false,
             "lucene_version" : "5.5.0"
         },
   "tagline" : "you know, for search"
}
production tip : do not open any other ports, like 9200, to the world! there are bots that search for 9200 and execute groovy scripts to overtake machines.
logstash installation
moving on, it’s time to install logstash — the stack’s log shipper.
using logstash to parse and forward your logs into elasticsearch is, of course, optional. there are other log shippers that can output to elasticsearch directly, such as filebeat and fluentd, so i would recommend some research before you opt for using logstash.
since logstash is available from the same repository as elasticsearch and we have already installed that public key in the previous section, we’re going to start by creating the logstash source list:
$ echo 'deb http://packages.elastic.co/logstash/2.2/debian stable main' | sudo tee /etc/apt/sources.list.d/logstash-2.2.x.list
next, we’re going to update the package database:
$ sudo apt-get update
finally — we’re going to install logstash:
$ sudo apt-get install logstash
to start logstash, execute:
$ sudo service logstash start
and to make sure logstash is running, use:
$ sudo service logstash status
the output should be:
logstash is running
we’ll get back to logstash later to configure log shipping into elasticsearch.
kibana installation
the process for installing kibana, elk’s pretty user interface, is identical to that of installing logstash.
create the kibana source list:
$ echo "deb http://packages.elastic.co/kibana/4.4/debian stable main" | sudo tee -a /etc/apt/sources.list.d/kibana-4.4.x.list
update the apt package database:
$ sudo apt-get update
then, install kibana with this command:
$ sudo apt-get -y install kibana
kibana is now installed.
we now need to configure the kibana configuration file at /opt/kibana/config/kibana.yml :
$ sudo vi /opt/kibana/config/kibana.yml
uncomment the following lines:
server.port: 5601
server.host: “0.0.0.0”
last but not least, start kibana:
$ sudo service kibana start
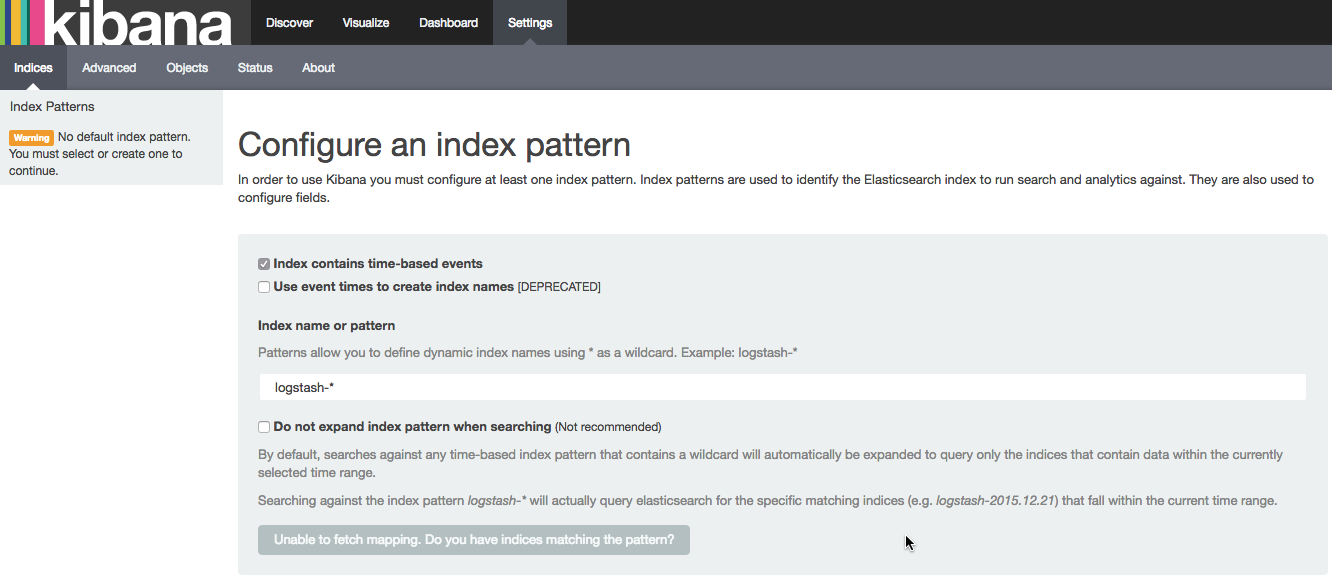
you should be able to access kibana in your browser at http://<serverip>:5601/ like this:

by default, kibana connects to the elasticsearch instance running on localhost, but you can connect to a different elasticsearch instance instead. simply modify the elasticsearch url in the kibana configuration file that we had edited earlier ( /opt/kibana/config/kibana.yml ) and then restart kibana.
if you cannot see kibana, there is most likely an issue with gcp networking or firewalls. please verify the firewall rules that you defined in gcp’s networking console .
establishing a pipeline
to start analyzing logs in kibana, at least one elasticsearch index pattern needs to be defined (you can read more about elasticsearch concepts ) — and you will notice that since we have not yet shipped any logs, kibana is unable to fetch mapping (as indicated by the grey button at the bottom of the page).
our last and final step in this tutorial is to establish a pipeline of logs, system logs in this case, from syslog to elasticsearch via logstash.
first, create a new logstash configuration file:
$ sudo vim /etc/logstash/conf.d/10-syslog.conf
use the following configuration:
input {
   file {
      type => “syslog”
      path => [  “/var/log/messages”, “/var/log/*.log”]
   }
}
filter {}
output {
   stdout {
      codec => rubydebug
   }
   elasticsearch {
      hosts => “localhost”
   }
}
a few words on this configuration.
put simply, we’re telling logstash to store the local syslog file ‘ /var/log/syslog ’ and all the files under ‘ /var/log*.log ’ on elasticsearch.
the input section specifies which files to collect (path) and what format to expect (syslog). the output section uses two outputs — stdout and elasticsearch.
i left the filter section empty in this case, but usually this is where you would define rules to beautify the log messages using logstash plugins such as grok. learn more about logstash grokking .
the stdout output is used to debug logstash, and the result is nicely-formatted log messages under ‘ /var/log/logstash/logstash.stdout ’. the elasticsearch output is what actually stores the logs in elasticsearch.
please note that in this example i am using ‘ localhost ’ as the elasticsearch hostname. in a real production setup, however, it is recommended to have elasticsearch and logstash installed on separate machines so the hostname would be different.
next, run logstash with this configuration:
$ /opt/logstash/bin/logstash -f /etc/logstash/conf.d/10-syslog.conf
you should see json output in your terminal indicating logstash is performing as expected.
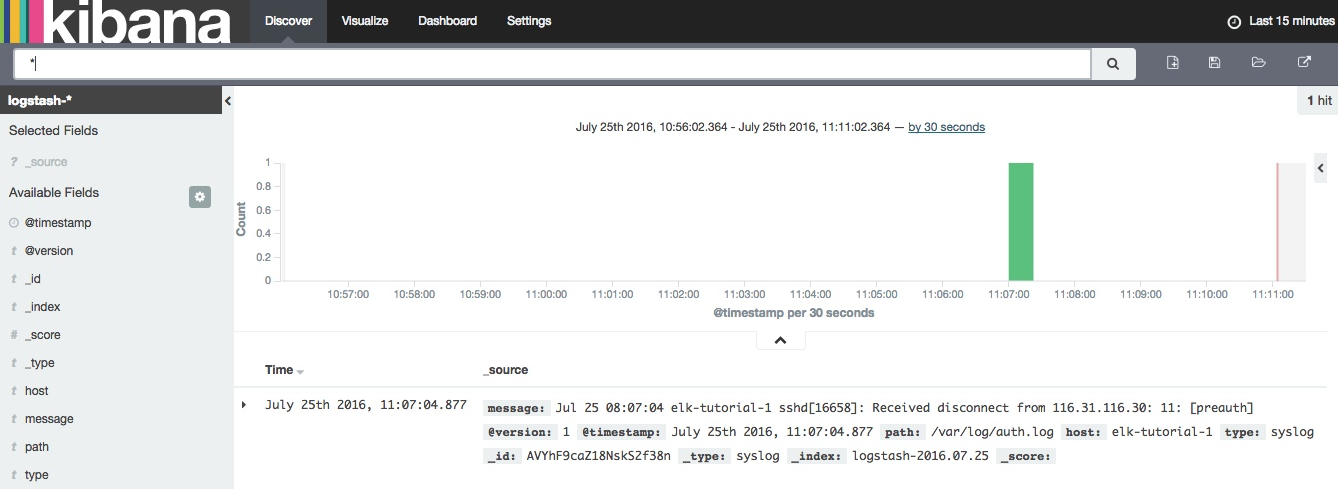
refresh kibana in your browser, and you’ll notice that the create button is now green, meaning kibana has found an elasticsearch index. click it to create the index and select the discover tab.
your logs will now begin to appear in kibana:

last, but not least
installing elk on gcp was smooth going — even easy — compared to aws. of course, as my goal was only to test installation and establish an initial pipeline. i didn’t stretch the stack to its limits. logstash and elasticsearch can cave under heavy loads, and the challenge, of course, is scaling and maintaining the stack on the long run. in a future post, i will compare the performance of elk on gcp versus aws.
Published at DZone with permission of Daniel Berman, DZone MVB. See the original article here.
Opinions expressed by DZone contributors are their own.

Comments