How to Monitor Server Resource Utilization With JMeter's SSHMon Listener
Learn all about using JMeter's SSHMon listener to gather metrics that are essential for performance testing websites, mobile apps, and more.
Join the DZone community and get the full member experience.
Join For FreeWhen performance testing, you should always get KPIs and metrics from two sources. Firstly, from the service you are testing (website, mobile application or other). These KPIs include the number of requests per second, the speed of data transfer, the amount of transferred data, etc.
Secondly, you need to collect the internal metrics of the server that your tested service is on. These include anything from the CPU load to the number of files that are opened by a particular process. These metrics will help you with your product planning. They can help you predict your peak load, help you find the cause of low throughput or request errors, and more.
Usually, Apache JMeter™ users use PerfMon Metrics Collector to collect similar metrics. But this requires running a server agent on that server. The usage of the agent affects the performance of the system, though slightly, but still. In addition, this method is inconvenient: you need to download the agent, run it as a service or as a process and then run it later when you need to run performance test again.
This blog post will offer a different solution for collecting the server metrics, based on standard or almost standard JMeter's system utilities.
This solution is the SSHMon plugin, which allows you to connect to the server via SSH and execute the necessary command to retrieve the data. You can install this plugin through the JMeter Plugins Manager.
To add the SSHMon Listener to your test scenario:
Right-click on Test Plan or Thread group -> Add -> Listeners -> SSHMon Samples Collector.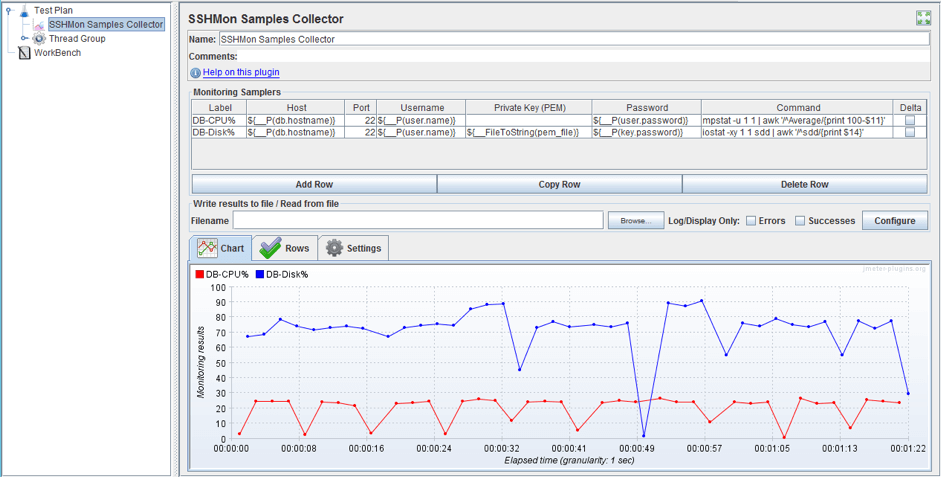
The screenshot above shows the SSHMon interface. If you have used the Perfmon Metrics Collector before, you may notice that the interfaces of these two plugins look very similar.
The main difference between the two is the server metrics configuration table.
The table consists of the following columns:
- Label - the name of the metric that will be displayed on the chart
- Host/Port - the address/port of the tested server
- Username/Password - the credentials for the ssh login
- Private Key (PEM) - the path to the pem file. This field is used if the ssh server supports Public Key Authentication
- Command - the executed command-line command. The command must return a decimal number or the execution will fail
- Delta - if this checkbox is checked, then the returned value is the resulting difference from the previous value.
The rest of the interface is similar to the Perfmon Metrics Collectors interface.
Now, we need to get metrics. Unfortunately, SSHMon makes it a bit complicated. To collect standard metrics like Network, CPU and Disk Usage in Perfmon, you don't need to know anything because Perfmon does it for you. But with SSHMon, you need to know which command to execute to get the right value, the command syntax and a few more details.
Let's look at the commands for the Windows and Linux systems.
Usually, the ssh server is included in Linux distributions and you do not need to install it. Rather, you only need to configure. Linux distributions contain many utilities to perform monitoring, like vmstat, iostat, mpstat, and sar. The choice of metrics depends on your imagination (or your load testing requirements).
For instance, let's look at the work of SSHMon using the sar utility for getting metrics. By using this utility you can get performance information about the processor, memory, Disk I/O and network in real time.
The command sar -u 1 1 shows one sample of the CPU usage, one second after the command is executed. In the screenshot below, you can see the result of the command.

But for SSHMon, we need to get a decimal number. To extract this value, we need to filter the current result. Using grep, awk, or similar utilities that are designed to process the data stream, we can filter the result of the previous command.
For example, now we will use the awk utility which has the following syntax: 'condition {action}'. In our case, the condition is the regular expression / ^ Average: /. Thus, we specify that we work with the line that contains 'Average:' substring, because this line contains the necessary value. The action is 'print 100- $8' and it prints the result of the expression '100 - (value from the 8th column)'. We need this expression to get information about the used CPU, because the 8th column contains information about the free CPU.
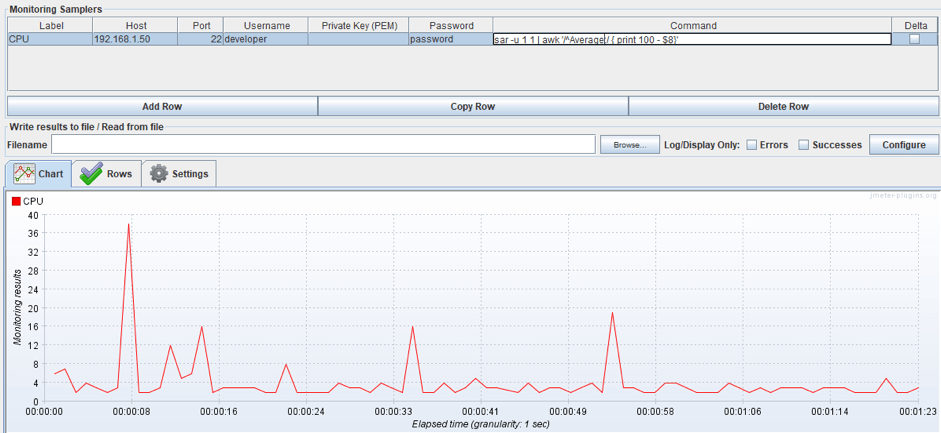
Now our command gets an average value of the free CPU and calculates the CPU used, as a result, it looks as follows:

Now we can add this command to SSHMon Listener and run the script. As you can see in the image below, the chart is being built.
To get more metrics using sar, you need to change the first argument and replace the body of the awk script. For instance, you can get information about I/O activities by using the following command:
sar -b 1 1 | awk '/^Average:/ {$2}'The principle of all the commands is the following: you call the utility that provides a required metric, and then you need to filter the output.
The syntax of the other commands looks very similar. For example, we can get info about CPU by using the mpstat command:
mpstat -P all 1 1As you can see, the mpstat syntax is very similar to the sar command syntax. '-P all' is like -b and is needed to get the info about all processors on the server. The first digit refers to the time that passed after execution of the command: 1 second, and the second digit stands for the number of times: one. You can get an overview of the basic Linux commands from this link.
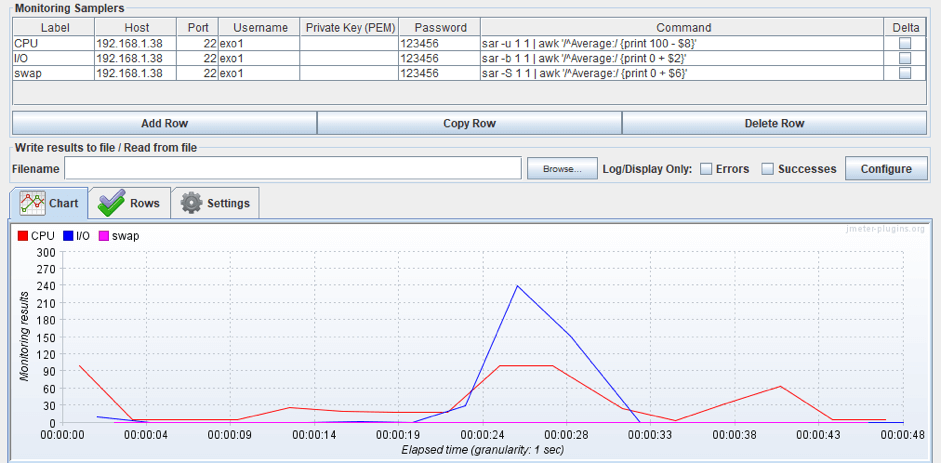
Now let's add the commands to the Listener and run the script. As you can see, all the metrics we specified in the table, are put together.
Unlike Linux, Windows requires ssh server installation, for example, OpenSSH. Besides, Windows does not have a lot of ways to get performance metrics in the console. In our case, to extract the metrics, we will use the Get-counter command. It is a PowerShell command, that provides information about the system like sar, and has similar syntax.
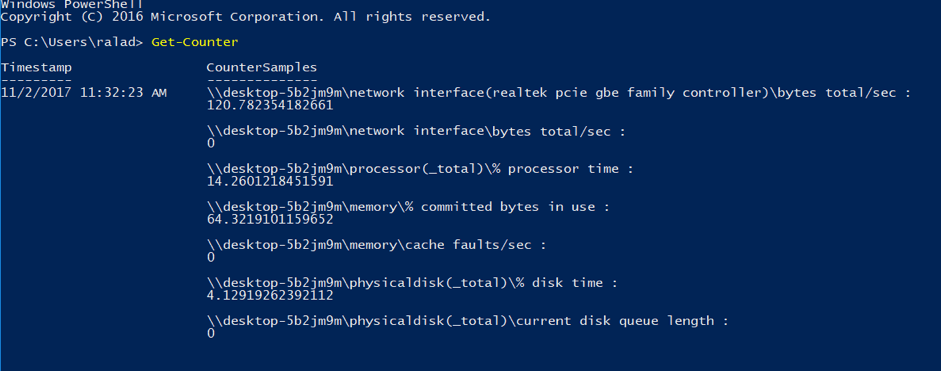
In the screenshot below you can see the syntax and the result of the command. SampleInterval and MaxSamples are like the integer parameters in the sar command and the argument in quotes is like the -u flag in sar.

As you can see, the result of the command is not a decimal number, therefore, we need to filter the output.
We will use the same peculiarity of the returned data as in Linux for that. CounterSamples column is an array and the desired value is in the first item of the array. To get the value, we will use the Foreach-Object command that provides a way to loop through and perform an action on each item in an array.
The final PowerShell command looks as follows:
Get-Counter -Counter "\processor(_total)\% processor time" -SampleInterval 1 -MaxSamples 1 | Foreach-Object {$_.CounterSamples[0].CookedValue}And now the command returns only a decimal number.

This command works only in PowerShell, therefore, we need to call the PowerShell from the cmd console before calling the command. Therefore, we will put the PowerShell command in the .ps1 file and pass the file to PowerShell using cmd.
The cmd command looks as follows:
powershell ""pathToFile\cpu.ps1""To get additional metrics, you just need to change the name that is given in the inverted commas. You will see all the names if you call the Get-Counter command without parameters in PowerShell.
Now we can add cmd commands to PerfMon Listener and look at the result. Remember that the Windows server must contain .ps1 files, which we will refer to via ssh.
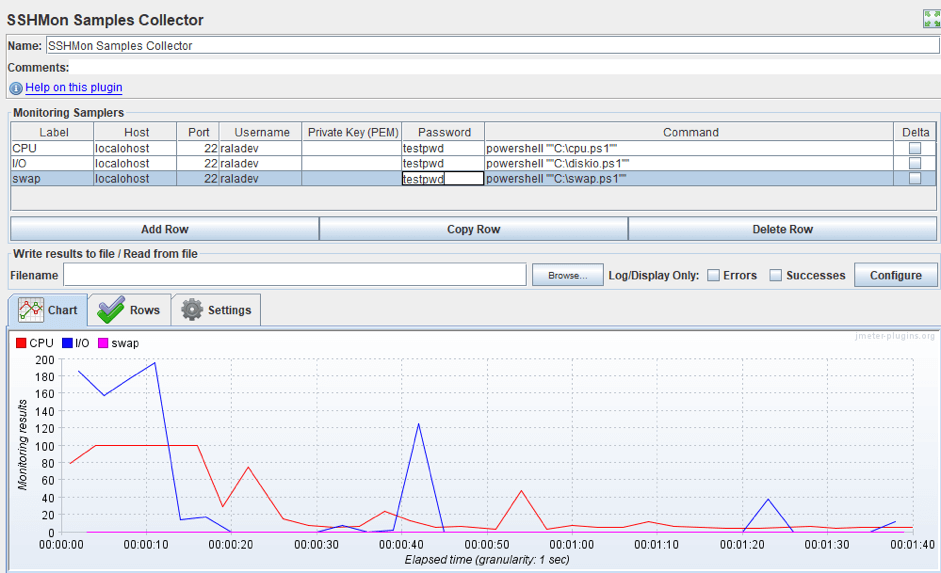
Small addition: If you do not want to upload the files to the server, then you can use a server that will grant access to the PowerShell console, for example, PoshSSH. Then, in the sampler, you need to specify only the PowerShell command.
You can also edit properties in jmeter.properties to control the plugin behavior:
- jmeter.sshmon.knownHosts is a filename of a known_hosts file containing public keys of trusted remote servers (in OpenSSH format). If it is not set, no validation will be performed.
- jmeter.sshmon.interval defines the metrics collection interval in milliseconds (default=1 second).
- jmeter.sshmon.forceOutputFile - (true/false) makes sure JMeter writes metrics to CSV file in the current directory if no filename is specified (default=false).
In this article, we looked at one of the ways to collect agentless data, i.e without installing an agent to the tested server. You can get different metrics you want to analyze as well as configure different settings like the frequency of data retrieval. This ability is more flexible if the server uses Linux OS, because Linux has more monitoring utilities than Windows. But, it can also be used on Windows OS with a few difficulties like a SSH server installing and executing PowerShell scripts from CMD.
Learn more advanced JMeter from our free JMeter Academy.
Published at DZone with permission of , DZone MVB. See the original article here.
Opinions expressed by DZone contributors are their own.

Comments