How to Solve Context Propagation Challenges in Distributed Tracing
How can you unlock the magic of distributed tracing across all kinds of interactions between microservices?
Join the DZone community and get the full member experience.
Join For FreeDistributed tracing allows tracking of a specific flow as it progresses throughout microservices systems. With distributed tracing, developers can connect the dots and gain visibility and understanding of a certain flow. This saves time when building and operating modern applications.
However, not all workflows and architectures support distributed tracing mechanisms. This is the case especially when these mechanisms were built as creative and customized solutions to unique situations. In such cases, it can be challenging to implement the context propagation mechanism, which is responsible for gathering the metadata that enables building the distributed tracing flow.
OpenTelemetry can be leveraged to solve these issues. Here are two use cases where it can be applied, based on real examples from our customers. For a more in-depth analysis of these use cases and context propagation, click here.
Use Case #1: A MongoDB-based Async Flow
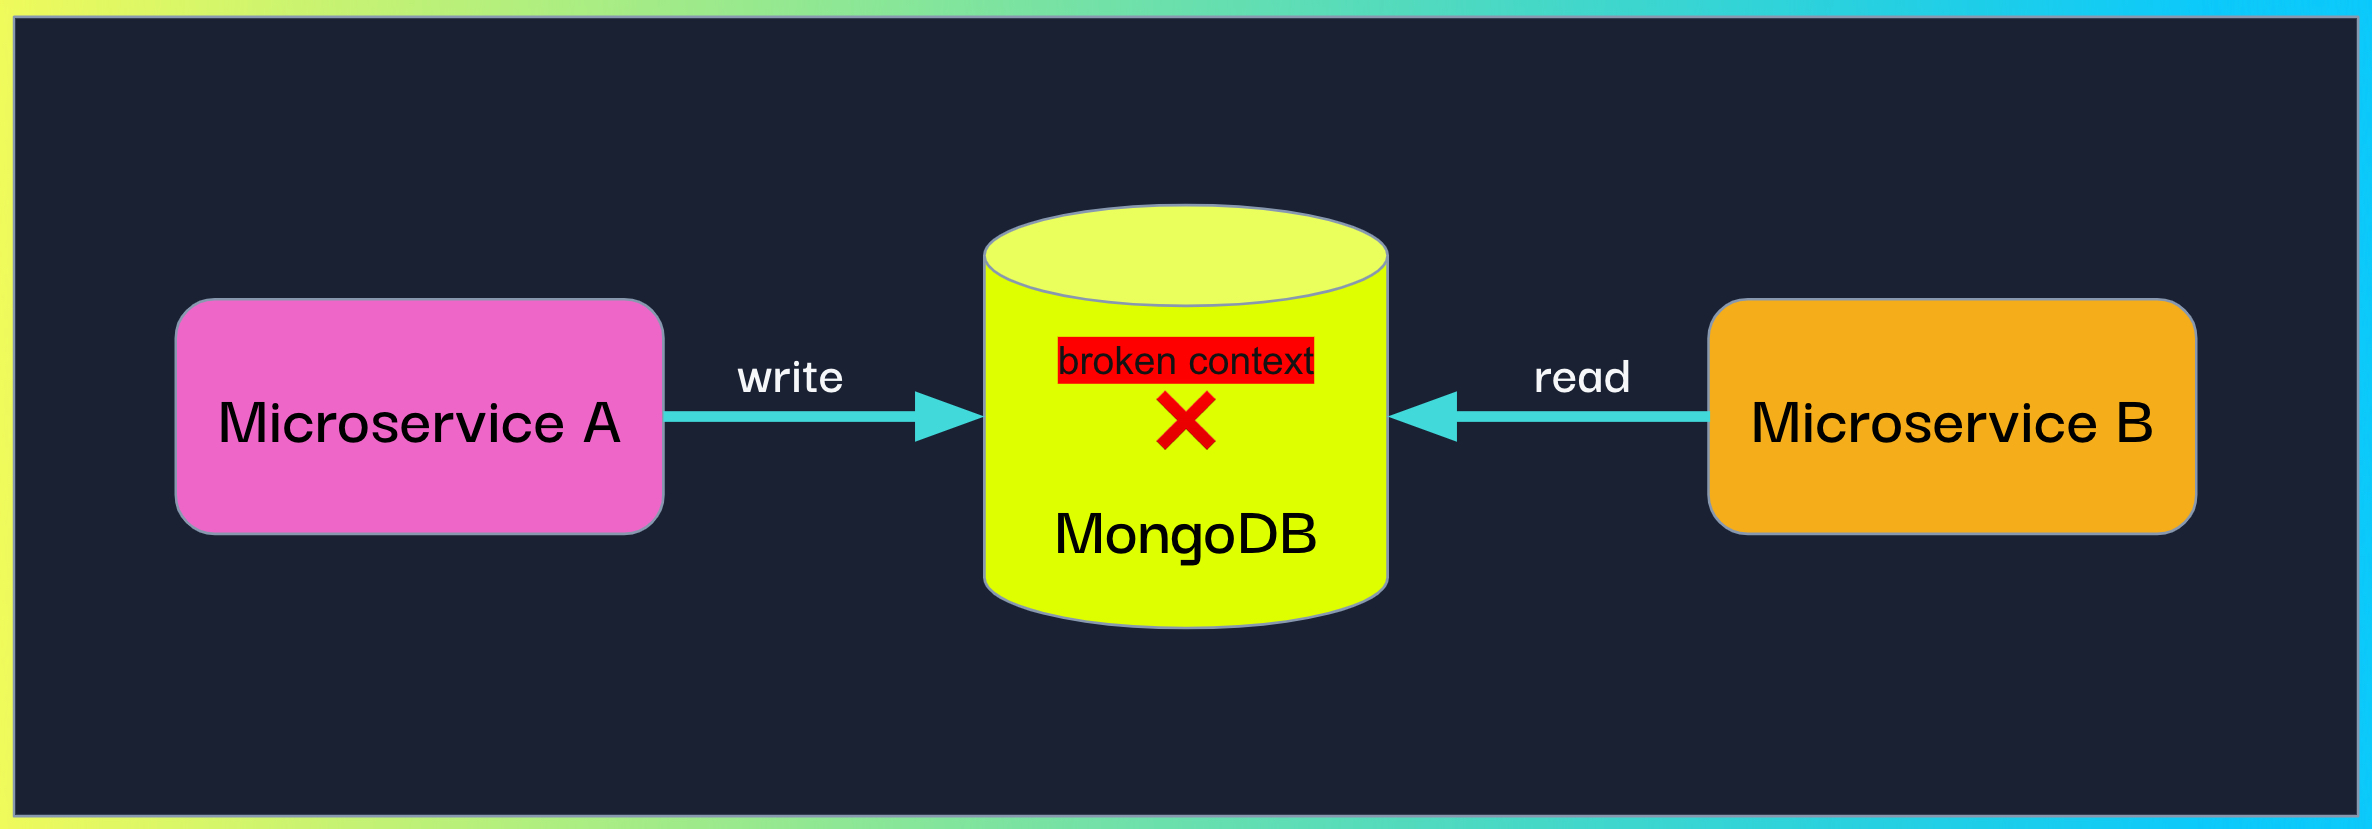
When using MongoDB as a pub-sub platform, our customer configured one microservice (A) to write a document containing information to MongoDB and another microservice (B) to periodically read from the same collection, fetch the written documents and perform some logic.
MongoDB is not the standard pub-sub solution, but it is not uncommon to see developers repurposing existing tools for different purposes.
 Propagating context in a MongoDB-based async flow
But how can we enable context propagation in this situation? We decided to let microservice A inject it into the document and have microservice B extract it.
To do so, we exposed OpenTelemetry’s inject method which accepts a “carrier” object (a dictionary by default) and injects the current active context into it. The customer could then write the injected carrier as part of the MongoDB document.
In addition, we exposed the complimentary extract method which accepts a “carrier” and returns the extracted context. The customer had to call both these methods, in microservice A and microservice B respectively, and then attach the context to the current run.
Microservice A code:
from helios import inject_current_context
document = ...
document['context'] = inject_current_context(dict())
mongo_client.db.collection.insert_one(document)
Microservice B code:
from helios import extract_context
from opentelemetry.context import attach

doc = mongo_client.db.collection.find_one({"_id": id})
extracted_ctx = extract_context(doc.get('context'))
attach(extracted_ctx)
Use Case #2: A Programmatically-Created Kubernetes Job
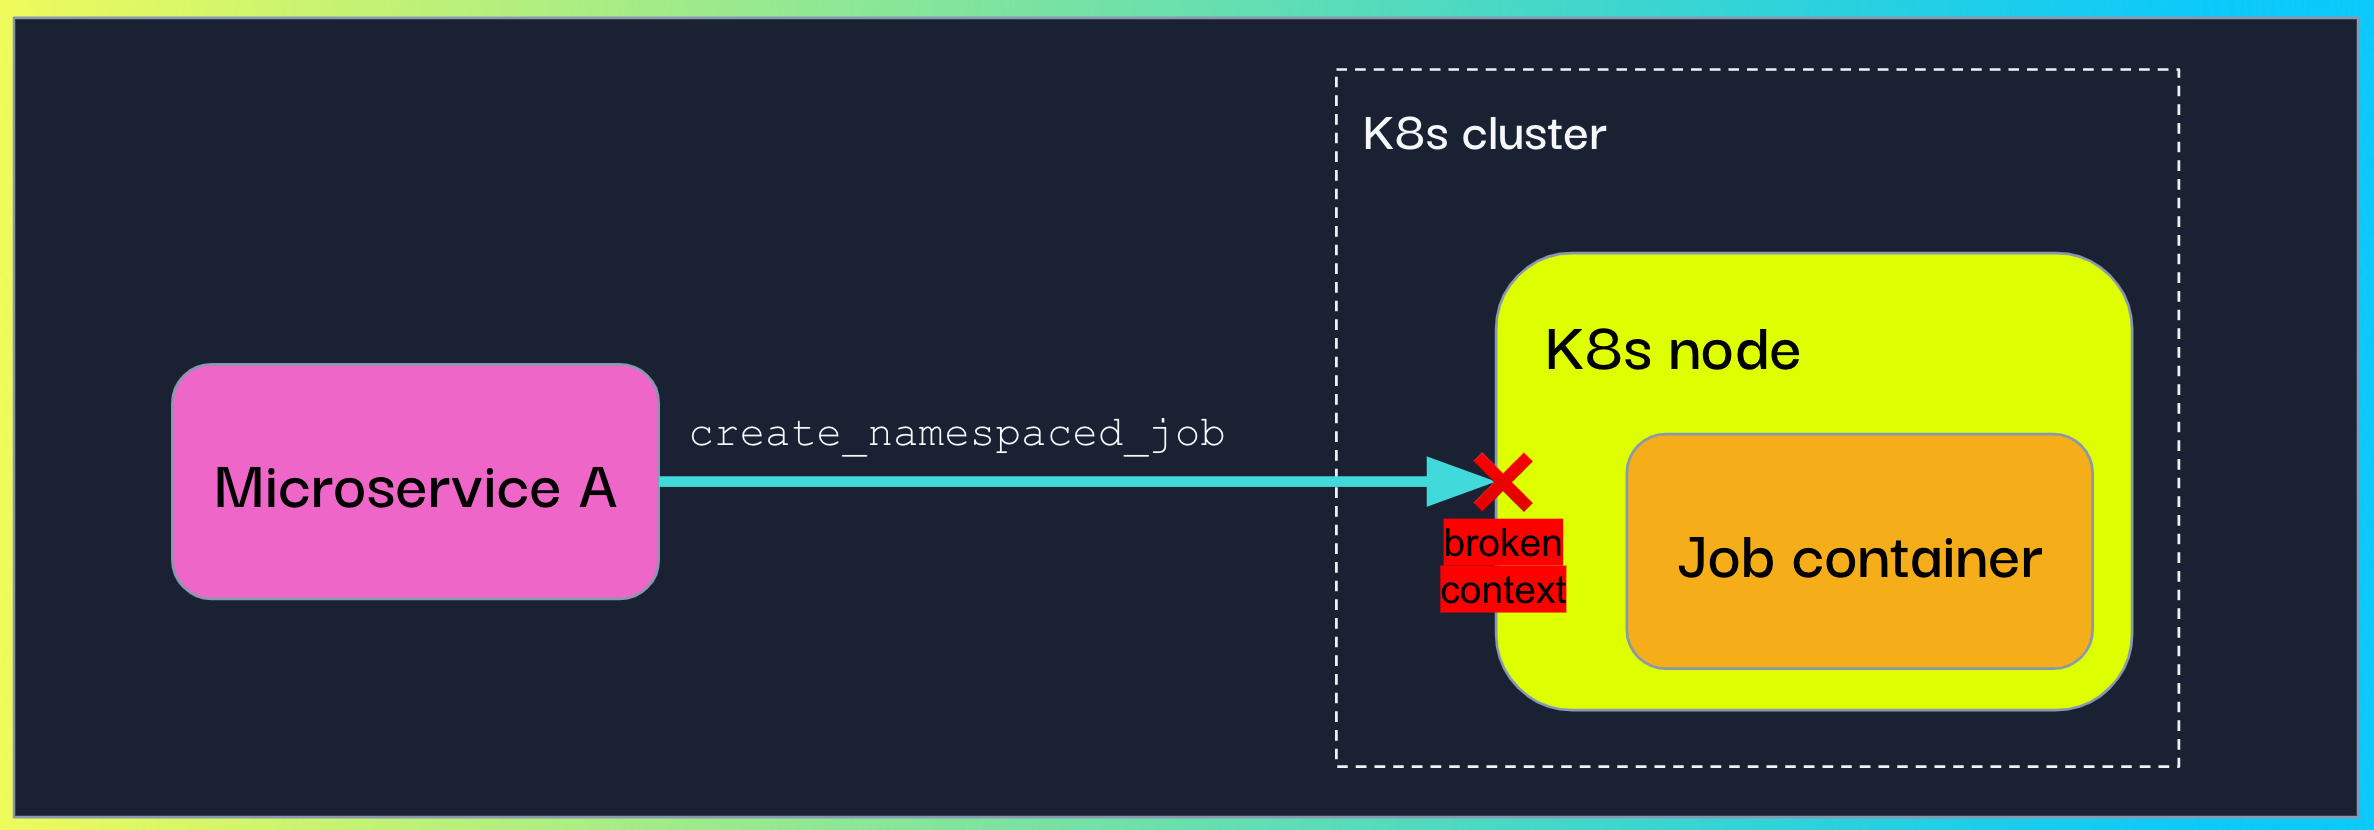
In this case, our customer was creating and running K8s jobs programmatically. They wanted to trace the flow up to the actual logic the K8s job was running.

Propagating context to a programmatically-created Kubernetes job
This was a more challenging edge case. After exploring the K8s API, we decided to harness the environment variables.To do so, we called the inject method with the K8s API custom object for environment variables (V1EnvVar). Since a custom Setter is an additional parameter the OpenTelemetry inject method accepts, we instructed our customer to use it in order to inject the context.
Microservice A code:
from helios import inject_current_context

class K8sEnvSetter:
    def set(self, carrier, key: str, value: str) -> None:
        carrier.append(client.V1EnvVar(name=key, value=value))

env = [ client.V1EnvVar(...), client.V1EnvVar(...), ... ]

inject_current_context(env, K8sEnvSetter())

# Create the container section that will go into the spec section
container = client.V1Container(..., env=env)

# Create and configurate a spec section
template = client.V1PodTemplateSpec(..., spec=client.V1PodSpec(...,containers=[container]))

# Create the specification of deployment
spec = client.V1JobSpec(template=template, ...)

# Instantiate the job object
job = client.V1Job(..., spec=spec)

api_instance.create_namespaced_job(body=job, ...)
Similar to the previous use case, the context also needed to be extracted and attached in the job’s logic. This could be done by writing a custom Getter. We decided to make this step implicit for our customers and implemented an automatic extraction when identifying that the code is running in a K8s job.

Once the context is propagated properly, the unified trace of the end-to-end flow shows up in Helios’s trace visualization.
Next Steps for Developer Teams
Today, distributed tracing is the best way to gain visibility into the darkness that is microservices architectures and troubleshoot issues. But not all architectures can be so easily adapted to distributed tracing flows. Based on the examples above, we can see that by being creative, engineering teams can implement context propagation and gain a full picture of their architecture. We hope you find it useful for your own distributed tracing needs.
Published at DZone with permission of Natasha Chernyavsky. See the original article here.
Opinions expressed by DZone contributors are their own.

Comments