How I Visualize My Spreadsheet Formula Dependencies in a Chart
When bringing Excel files online we can do more. This article shares how I leverage common web components to visualize formula dependencies in a custom way.
Join the DZone community and get the full member experience.
Join For FreeOverview
The formula is the heart of an Excel file. And of course, we all want to do correct calculations and deliver accurate results. When there is something wrong, we want to trace back to those referenced cells to find the root cause. Excel natively has a built-in convenient formula dependent/precedent trace feature, it highlights the dependent/precedent cells and displays arrows to indicate the relationships. This helps users to trace back and find any error formulas easily.
Now, when bringing the spreadsheet online, we can do more. We can display the relationships in a custom way that is most useful according to the application context, or bring them to a different service or application for doing the validation programmatically.
In this article, I am taking the Keikai spreadsheet, ZK Listbox, and ZK Charts components to demonstrate how you can display formula precedent/dependent relationships in a table or in a chart.
What to Build
My goal is to list the precedent and dependent cells of a target cell and show them in 2 different forms: a list and a network graph. Here's a short demo:
Click an item in the list and it will jump to the corresponding cell:
Let me explain how I build this application.
Design the UI
Keikai is a spreadsheet component based on the ZK framework, a Java EE UI framework, by which I can build UI by composing various existing components. To start I just need to create a zul file, written in XML format. When a user visits this zul file, ZK will translate this zul into an HTML page with CSS and javascript widgets.
First, I put Keikai on the page. Each tag represents a component and its attributes determine its functions and appearance. Please check Developer Reference for details.
xxxxxxxxxx
<spreadsheet id="spreadsheet" src="/WEB-INF/books/demo_sample.xlsx"
showSheetbar="true" showSheetTabContextMenu="true"
showToolbar="true" showFormulabar="true"
maxVisibleRows="200" maxVisibleColumns="40"
hflex="2" vflex="1"/>
- Line 1: extracted from displayTrace.zul.
Then add a block to show the cell to trace its formula. ZK allows you to mix HTML tags with ZK tags by declaring a namespace xmlns:h="native". For a UI that doesn't need to change dynamically, I can just use HTML to save memory.
x
<zk ...
xmlns:h="native">
...
<h:div style="display: flex; align-items: center">
<h:h3 style="margin: 10px 0; flex:1">Formula Tracking</h:h3>
<button id="trace" label="trace" />
</h:div>
<separator bar="true" height="20px"/>
<h:div>
Trace cell: [<label id="cellAddress" style="font-weight: bold"/>]
</h:div>
Next, put 2 listboxes to show precedents and dependents respectively.
xxxxxxxxxx
<window id="rangeWin" title="List" vflex="1" border="normal" contentStyle="overflow-y: auto">
Select an item below to focus the cell:
<listbox width="100%" emptyMessage="no data" rows="3" sclass="precedentBox">
<listhead>
<listheader label="Precedents"/>
</listhead>
<template name="model">
<listitem label="${each}"/>
</template>
</listbox>
<listbox width="100%" emptyMessage="no data" rows="3" sclass="dependentBox">
<listhead>
<listheader label="Dependents"/>
</listhead>
<template name="model">
<listitem label="${each}"/>
</template>
</listbox>
</window>
- Line 1:
<window>is a container to group components in a window-style box. (See demo.) - Line 3:
<listbox>is used to show a list of items. It accepts a data model and renders the data model with a template. (See demo.) - Line 7: You can design a template to render each object in the data model.
To show precedents and dependents in a network graph, I need to add a chart component:
xxxxxxxxxx
<window title="Chart" vflex="1" border="normal">
<charts hflex="1"/>
</window>
Finally, arrange them in the horizontal layout:
xxxxxxxxxx
<hlayout height="100%" width="100%" apply="io.keikai.devref.usecase.DisplayFormulaTraceComposer">
<spreadsheet .../>
<div>
<!-- 2 listboxes and a chart -->
</div>
</hlayout>
ZK provides various layout components, I just go with the one that's most suitable here.
How to Implement Application Logic
After building the UI, I need to add application logic. For example, when clicking the 'trace' button, I wish to show precedents and dependents in listboxes. To do this I need to create a controller.
MVC Pattern
ZK supports MVC pattern: Model-View-Controller. The zul plays 'View.' It provides a SelectorComposer to play 'Controller.' Hence, I need to create a class that extends SelectorComposer and associate the zul with the controller with apply attribute:
xxxxxxxxxx
<hlayout apply="io.keikai.devref.usecase.DisplayFormulaTraceComposer">
Control Components by Java
In the ZK MVC pattern, I can control a component by calling its API. When a user visits a zul page, ZK will create each component's Java object on the zul, and the controller can get component references with @Wire and selector syntax. Therefore, I don't need to instantiate each component like new Spreadsheet() by myself. Here are some examples:
xxxxxxxxxx
public class DisplayFormulaTraceComposer extends SelectorComposer<Component> {
private Spreadsheet spreadsheet;
("window .precedentBox")
private Listbox precedentBox;
- Line 3: The default case, wire by component ID as the variable name,
spreadsheet. In the zul, there should be<spreadsheet id="spreadsheet"/>. - Line 6: Wire a component that is a child of
windowand has a CSS classprecedentBox.
For complete syntax, please refer to JavaDoc.
Initialize Components
After components are created, sometimes we want to initialize them, e.g., configure chart options, then I have to override a lifecycle method doAfterCompose() and implement my initializing logic:
public class DisplayFormulaTraceComposer extends SelectorComposer<Component> {
...
("window charts")
private Charts charts;
...
private DefaultFromToModel fromToModel = new DefaultFromToModel();
public void doAfterCompose(Component comp) throws Exception {
super.doAfterCompose(comp);
...
charts.setType(Charts.NETWOKRGRAPH);
charts.setModel(fromToModel);
NetworkGraphLayoutAlgorithm algorithm = charts.getPlotOptions().getNetworkGraph().getLayoutAlgorithm();
algorithm.setLinkLength(40);
algorithm.setEnableSimulation(true);
charts.getPlotOptions().getSeries().getDataLabels().setEnabled(true);
charts.getPlotOptions().getSeries().getDataLabels().setLinkFormat(""); //make link text empty
}
- Line 10: ZK will call this method after all components are created. (see JavaDoc.)
- Line 13~19: Initialize chart options.
Event-Driven Programming Model
ZK framework supports the event-driven programming model. Each component fires different events when users interact with them e.g. clicking a button or selecting an item. After applying a controller, I can register event listeners in a controller to listen to events triggered by user action and implement application logic in an event listener. To register an event listener method, I have to put @Listen on a method in a controller like:
x
public class DisplayFormulaTraceComposer extends SelectorComposer<Component> {
(Events.ON_CLICK+ " = #trace")
public void trace() {
...
}
- Line 2: It registers a listener for
ON_CLICKevent on the component whose ID istrace. Please read Wire Event Listeners for details.
Get Precedents/Dependents
To know what precedent and dependent are, please read the Microsoft Office doc. Keikai provides methods to get them:
xxxxxxxxxx
Set<Range> precedents = Ranges.range(spreadsheet.getSelectedSheet(), spreadsheet.getSelection()).getDirectPrecedents();
Set<Range> dependents = Ranges.range(spreadsheet.getSelectedSheet(), spreadsheet.getSelection()).getDirectDependents();
These 2 methods return a set of Range , so that I can display them in 2 different forms: a list and a network chart.
Trace in a List
Because Listbox supports model-driven rendering which is also in MVC architecture:
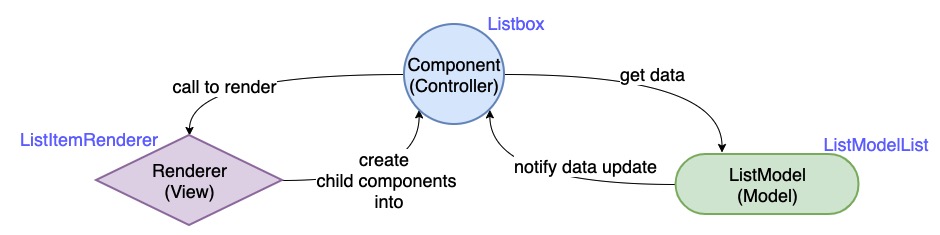
To show precedents/dependents in a Listbox, I put them into a ListModelList and pass it to Listbox.setModel(). Then ListModelList will automatically notify a Listbox to render items in a browser when I add remove Range.
xxxxxxxxxx
private ListModelList<Range> precedentList = new ListModelList<>();
private ListModelList<Range> dependentList = new ListModelList<>();
...
public void doAfterCompose(Component comp) throws Exception {
super.doAfterCompose(comp);
precedentBox.setModel(precedentList);
dependentBox.setModel(dependentList);
...
}
(Events.ON_CLICK + " = #trace")
public void trace() {
...
precedentList.clear();
dependentList.clear();
Set<Range> precedents = Ranges.range(spreadsheet.getSelectedSheet(), spreadsheet.getSelection()).getDirectPrecedents();
Set<Range> dependents = Ranges.range(spreadsheet.getSelectedSheet(), spreadsheet.getSelection()).getDirectDependents();
precedentList.addAll(precedents);
dependentList.addAll(dependents);
...
}
- Line 7~8: I can assign an empty
ListModelListtoListboxfirst and add items later. - Line 19~20: put precedents and dependents into a
ListModelList, this will automatically notify a Listbox to render them into browsers.
Trace in a Network Graph
A ZK chart also supports model-driven rendering, what I need to do is similar: add data points into a chart, and the chart will render points into a browser.
xxxxxxxxxx
private void addDependent(int maxLevel) {
List<Point> points = traceCells(Ranges.range(spreadsheet.getSelectedSheet(), spreadsheet.getSelection())
, maxLevel, DisplayFormulaTraceComposer::getDirectDependents);
String selectedCellRef = spreadsheet.getCellFocus().asString();
charts.getSeries().setName(selectedCellRef);
charts.getSeries().setColor(DEPENDENT_COLOR);
points.stream().forEach(p -> { charts.getSeries().addPoint(p); });
}
private void addPrecedent(int maxLevel) {
List<Point> points = traceCells(Ranges.range(spreadsheet.getSelectedSheet(), spreadsheet.getSelection())
, maxLevel, DisplayFormulaTraceComposer::getDirectPrecedents);
String selectedCellRef = spreadsheet.getCellFocus().asString();
charts.getSeries(1).setName(selectedCellRef);
charts.getSeries(1).setColor(PRECEDENT_COLOR);
points.stream().forEach(p -> { charts.getSeries(1).addPoint(p); });
}
- Line 6, 16:
getSeries()andgetSeries(1)returns 2 series respectively, so I can give them different colors.
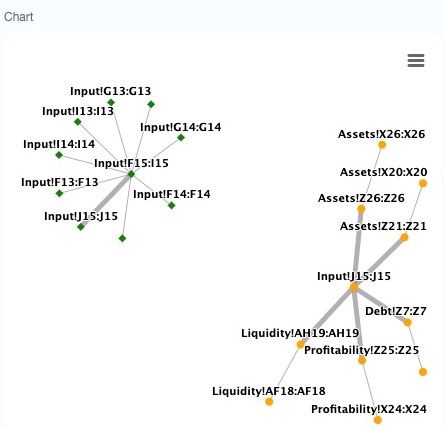
I can trace to 2nd level of precedents and dependents:
Here is an example for Input!J15.
Jump to a Precedent/Dependent
When tracing a formula's precedent, it's quite convenient to jump to the precedent cell and keep inspecting the next precedents and repeat until we find where is wrong. The same rule applies to dependents. Therefore, I implement a feature: click an item (cell) in Listbox and jump to the cell.
Forward an Event
Because a Listbox is empty and doesn't have any Listitem when the page is loaded, a controller can't register a listener on a non-existing component. So I have to forward onClick event to an existed component, Window and register a listener on it.
xxxxxxxxxx
<window id="rangeWin" title="List" vflex="1" border="normal" contentStyle="overflow-y: auto">
...
<listbox width="100%" emptyMessage="no data" rows="3" sclass="precedentBox">
...
<template name="model">
<listitem label="${each}" forward="rangeWin.onFocusCell"/>
</template>
</listbox>
- Line 6: forward
onClickto its ancestor Window whose ID israngeWinwith a custom event nameonFocusCell(see Doc).
Focus a Cell
xxxxxxxxxx
("onFocusCell = #rangeWin")
public void focus(ForwardEvent e){
Range range = (Range)((Listitem)e.getOrigin().getTarget()).getValue();
if (!isInCurrentSheet(range)){
spreadsheet.setSelectedSheet(range.getSheet().getSheetName());
}
spreadsheet.focusTo(range.getRow(), range.getColumn());
}
- Line 1: Listen to the custom event
onFocusCellspecified in a zul (see the previous section). - Line 7:
focusTo()will scroll a sheet and focus on the specified cell.
Conclusion
Spreadsheets are no doubts one of the most popular business applications in the world. When spreadsheets are brought online, we can do more than just duplicating Excel's functionality. This example combines the modern web UI components with the classic spreadsheet to demonstrate how you can display formula dependencies in a modern and custom way. The complete source code can be found at Github.
Opinions expressed by DZone contributors are their own.
Comments