Use Open-Source Kubecost to Understand (and Control) Kubernetes Spending
Kubernetes-related cloud spending is on a tear; open-source Kubecost is a path forward to more granular visibility into where those dollars are going.
Join the DZone community and get the full member experience.
Join For FreeMany organizations deploying and quickly scaling Kubernetes struggle to understand how their cloud spend is actually, well, being spent. Precise visibility into which teams, projects, or applications are spending what amount on which infrastructure services is difficult to achieve. This black box of understanding has bigger implications, of course, as Kubernetes environments grow.
(For more data on this problem, check out the Cloud Native Computing Foundation’s recent – and first-ever – report into FinOps for Kubernetes.)
Built on open-source tooling, Kubecost is a Kubernetes cost management platform designed to provide cost metrics for each microservice and application running in your cluster. By deploying Kubecost (something I’ve been doing and will dig into step-by-step below), development teams can understand the hows and whys of their spending responsibilities, track overruns, and properly manage capacity to optimize spending efficiency.

Kubecost enables the following process to bring Kubernetes spending under control:
- Introduce spending visibility and insights into team spending by workload.
- Based on those insights, implement infrastructure optimization and application performance improvements.
- Practice governance to maintain an ideal balance between cost spending and performance.
Exploring Kubecost Architecture

Kubecost’s architecture includes these main components:
- Kubecost Pod: Takes Kubernetes API metrics and billing data to generate metrics then scraped for use by Prometheus.
- Prometheus – The metrics data store.
- Kube-state metrics (ksm): Kubernetes API metrics, e.g. resource requests.
- node-exporter: Node-level utilization metrics.
- cadvisor: For utilization metrics (CPU/Memory for containers).
- network-metric: Daemonset for collecting metrics.
A Kubecost Example, Running on a Kubernetes Cluster
This tutorial will demonstrate installing Kubecost on your Kubernetes cluster. Kubecost can also be installed on any distribution of Kubernetes.
Create A Cluster
Here we’ll create a civo cluster using the CLI but you can also create a cluster using the UI. This code creates a three-node cluster named kubecost-demo.
$ civo k3s create kubecost-demo
The cluster kubecost-demo (9fe52857-f03e-451a-9c69-7125b06dcbbd) has been created
Next, we’ll get the cluster’s Kubeconfig and save it in the location of our choice. It saves to ~/.kube/config if no path is specified.
$ civo k3s config kubecost-demo --save --local-path /Users/saiyampathak/civo/test/kubecost-demo.config
Access your cluster with:
KUBECONFIG=/Users/saiyampathak/civo/test/kubecost-demo.config kubectl get node
Now we’ll tell kubectl to use our cluster’s configuration file:
$ export KUBECONFIG=/Users/saiyampathak/civo/test/kubecost-demo.config


$ kubectl get nodes

NAME                                        STATUS  ROLES    AGE    VERSION

k3s-kubecost-demo-0edfef9e-node-pool-b3fe   Ready   <none>   39s   v1.20.2+k3s1

k3s-kubecost-demo-0edfef9e-node-pool-e43a   Ready   <none>   38s   v1.20.2+k3s1

k3s-kubecost-demo-0edfef9e-node-pool-9209   Ready   <none>   38s   v1.20.2+k3s1
Kubecost Installation
Now, we’ll install Kubecost using helm. You can also do so directly using a kubectl apply command.
helm repo add kubecost https://kubecost.github.io/cost-analyzer/
helm upgrade -i --create-namespace kubecost kubecost/cost-analyzer --namespace kubecost --set kubecostToken="aGVsbUBrdWJlY29zdC5jb20=xm343yadf98"

NAME: kubecost
LAST DEPLOYED: Mon Jul 19 23:01:32 2021
NAMESPACE: kubecost
STATUS: deployed
REVISION: 1
TEST SUITE: None
NOTES:
------------------------------------------------Kubecost has been successfully installed. When pods are Ready, you can enable port-forwarding with the
following command:

  kubectl port-forward --namespace kubecost deployment/kubecost-cost-analyzer 9090

Next, navigate to http://localhost:9090 in a web browser.
All Kubecost components are now deployed and running.
kubectl get pods -n kubecost
NAME                                           READY   STATUS   RESTARTS  AGE
kubecost-prometheus-node-exporter-7twvw        1/1     Running   0      2m40s
kubecost-prometheus-node-exporter-846qc        1/1     Running   0      2m40s
kubecost-prometheus-node-exporter-xcnt5        1/1     Running   0      2m40s
kubecost-kube-state-metrics-6c4df87fb6-bwbkd   1/1     Running   0      2m39s
kubecost-grafana-779599f58d-qlbll              3/3     Running   0      2m39s
kubecost-prometheus-server-6b5884f9d5-qjvzw    2/2     Running   0      2m39s
kubecost-cost-analyzer-69f485d5bd-d2rvn        3/3     Running   0      2m39s
Setting the Right Parameters
With Kubecost deployed, use this command to forward the port from the cluster and access the Kubecost UI at http://localhost:9090:
kubectl port-forward --namespace kubecost deployment/kubecost-cost-analyzer 9090
In the UI, you’ll see the available clusters:

Kubecost has default cost values set for CPU, memory, and other items. In the settings section, we’ll adjust those costs to represent our Kubernetes cluster. First, enable custom pricing:

Matching the size of our Kubernetes cluster we’ve deployed with civo pricing, we can enter the correct costs (in this case Storage per GB = $0.10 and RAM per GB = $4).

Remember to save these settings!
Kubecost Features
With Kubecost deployed, overall costs for workloads, namespaces and more are available. Let’s look at these cost visualization features.
Cost Overview

This default overview page presents high-level insights into cluster spend, efficiency, and key cost drivers (calculated using our custom pricing inputs).
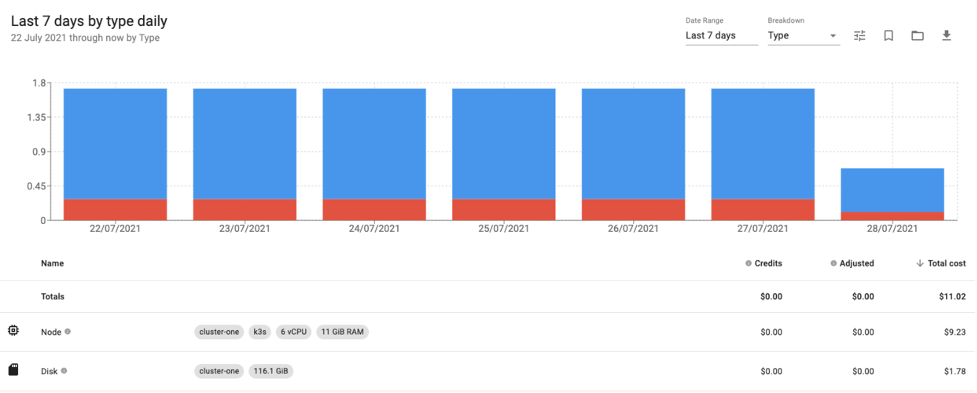
Cost Allocation
The cost allocation view displays costs per namespace, with the first six columns showing actual costs. Kubecost is capable of displaying costs based on any Kubernetes concept, such as label, annotation, service, etc.

Shared costs can be defined using the following settings. Use cases include scenarios where costs are shared in multiple namespaces with a specific label, or where costs are evenly distributed across all teams for a particular product/service.

You can define external costs of the Kubernetes cluster as well. Drill down to a particular namespace to see running pods and their associated costs.


Assets
If you define any cost discounts in the settings, Assets offers a view of total costs accounting for those adjustments.
Reports
You can save all allocation views as reports, use filters to highlight certain criteria, and share these reports with teams to ensure their clear knowledge of spending activity.
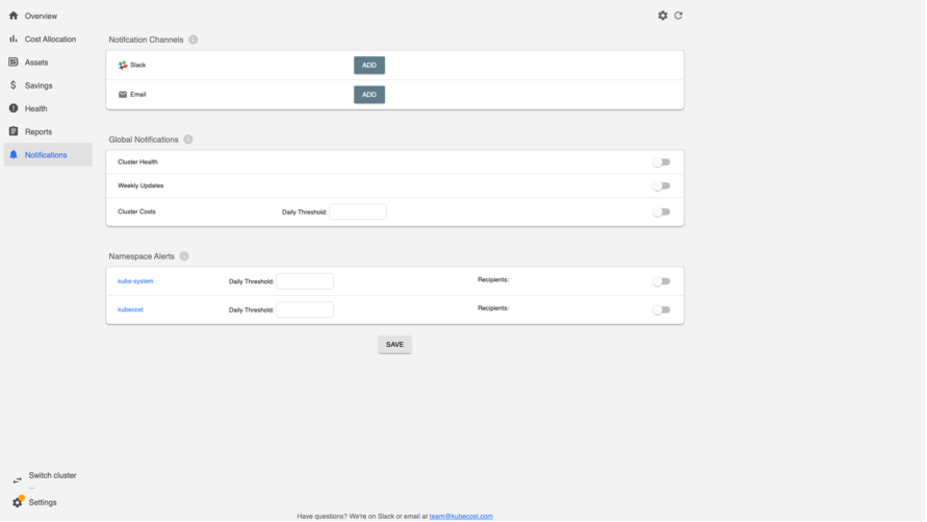
Alerts
You can opt to receive notifications such as weekly updates, or alerts when certain thresholds that you define are met.
Kubecost-kubectl Integration
Kubecost has a krew plugin, which (according to the repository), “…provides easy CLI access to Kubernetes cost allocation metrics via the kubecost APIs. It allows developers, DevOps teams, and others to quickly determine the cost and efficiency for any Kubernetes workload.”
To use it, install krew, and then install the cost plugin with this code:
kubectl krew install cost
Updated the local copy of plugin index.
Installing plugin: cost
Installed plugin: cost
\
 | Use this plugin:
 |   kubectl cost
 | Documentation:
 |   https://github.com/kubecost/kubectl-cost
 | Caveats:
 | \
 |  | Requires Kubecost (a cluster-side daemon) to be installed in your cluster.
 |  | See https://www.kubecost.com/install for installation instructions.
 | /
/
WARNING: You installed plugin "cost" from the krew-index plugin repository.

   These plugins are not audited for security by the Krew maintainers.

   Run them at your own risk.
With this plugin, you can use a kubectl command to find the cost of a namespace or a pod:
kubectl cost pod -n kubecost
+-----------+----------------------------------------------+--------------------+-----------------+
| NAMESPACE | POD                                          | MONTHLY RATE (ALL) | COST EFFICIENCY |
+-----------+----------------------------------------------+--------------------+-----------------+
| kubecost  | kubecost-cost-analyzer-69f485d5bd-d2rvn      |           3.844531 |        0.000000 |
|           | kubecost-prometheus-server-6b5884f9d5-qjvzw  |           3.200000 |        0.000000 |
|           | kubecost-grafana-779599f58d-qlbll            |           0.000000 |        0.000000 |
|           | kubecost-prometheus-node-exporter-846qc      |           0.000000 |        0.000000 |
|           | kubecost-prometheus-node-exporter-xcnt5      |           0.000000 |        0.000000 |
|           | kubecost-kube-state-metrics-6c4df87fb6-bwbkd |           0.000000 |        0.000000 |
|           | kubecost-prometheus-node-exporter-7twvw      |           0.000000 |        0.000000 |
+-----------+----------------------------------------------+--------------------+-----------------+
| SUMMED    |                                              |       USD 7.044531 |                 |
+-----------+----------------------------------------------+--------------------+-----------------+
In this way, CLI fans can get costs and include additional parameters directly and immediately.
An open source answer to Kubernetes cost transparency
I’ve found Kubecost to be a useful and easy to use open source tool for getting an in-depth understanding of Kubernetes costs. The tool’s configurable settings ensure that you can get accurate cost insights on any cluster, no matter where it’s running.
Opinions expressed by DZone contributors are their own.
Comments