How We Solved an OOM Issue in TiDB with GOMEMLIMIT
Learn how to use Golang's GOMEMLIMIT and TiDB's memory management features to mitigate OOM errors in a distributed database.
Join the DZone community and get the full member experience.
Join For FreeA database Out Of Memory (OOM) error can be challenging to deal with. It can have a number of different causes, and without a thorough analysis, it can be difficult to determine the root cause of the error. Some typical causes of an OOM error in a database include insufficient memory, memory leaks, poorly optimized queries, and large result sets.
To troubleshoot an OOM error in a database, it is important to monitor the database’s memory usage over time, profile the database to identify any potential bottlenecks or inefficiencies and optimize queries and indexes as needed.
This post describes how memory leaks caused an OOM error in TiDB, a distributed SQL database, and how we troubleshot the issue. We’ll also demonstrate how Golang 1.19 with GOMEMLIMIT, a soft limit that reduces the chance of OOM errors in Go applications, and TiDB’s built-in memory management features help to mitigate the OOM issue.
A Real-Life OOM Example
A social media company was using a legacy sharding solution with its database. However, this solution was expensive to maintain, and it didn’t meet the company’s needs for scalability. The company planned to migrate their infrastructure from MySQL sharding to TiDB. During the proof of concept trial, TIDB met their performance needs; however, when they tried to scale in some TiDB nodes, the remaining TiDB instances had OOM issues.
What Caused the OOM Errors?
At 10:00 AM, the scale-in operation started, and the memory usage of the remaining TiDB instances kept growing. At 10:55 AM, the memory usage surged, and all TiDB instances kept restarting due to OOM issues.
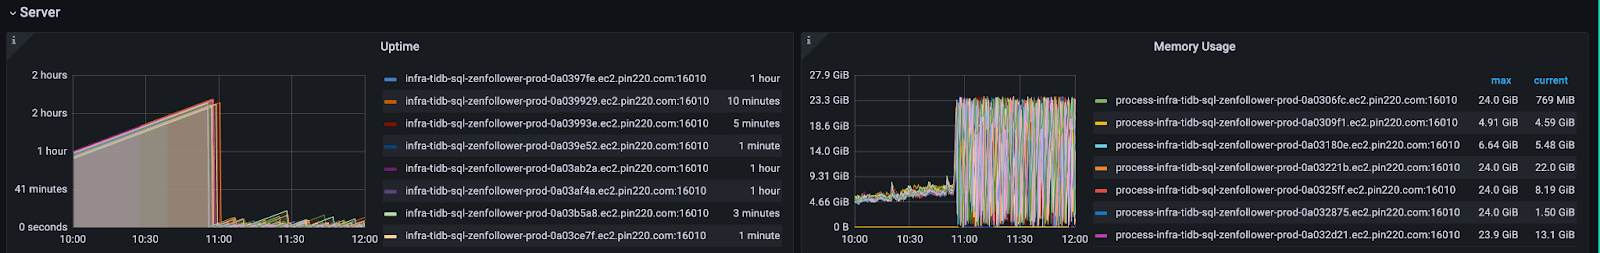
TiDB performance overview
As is shown above on the performance overview dashboard, the statement execution metric (StmtExecute) is 33.9 k/s, and the plan cache hits are only 336.8 per second. This means TiDB needed to reparse and recompile almost every statement.
More importantly, Statements Closed (StmtClose) is 475.3 per second, and Statements Prepared (StmtPrepare) per second is 9.5 k. This means the Java application kept opening prepared statements objects, most of which were not closed properly. The leaked prepared statements probably caused the OOM issue.
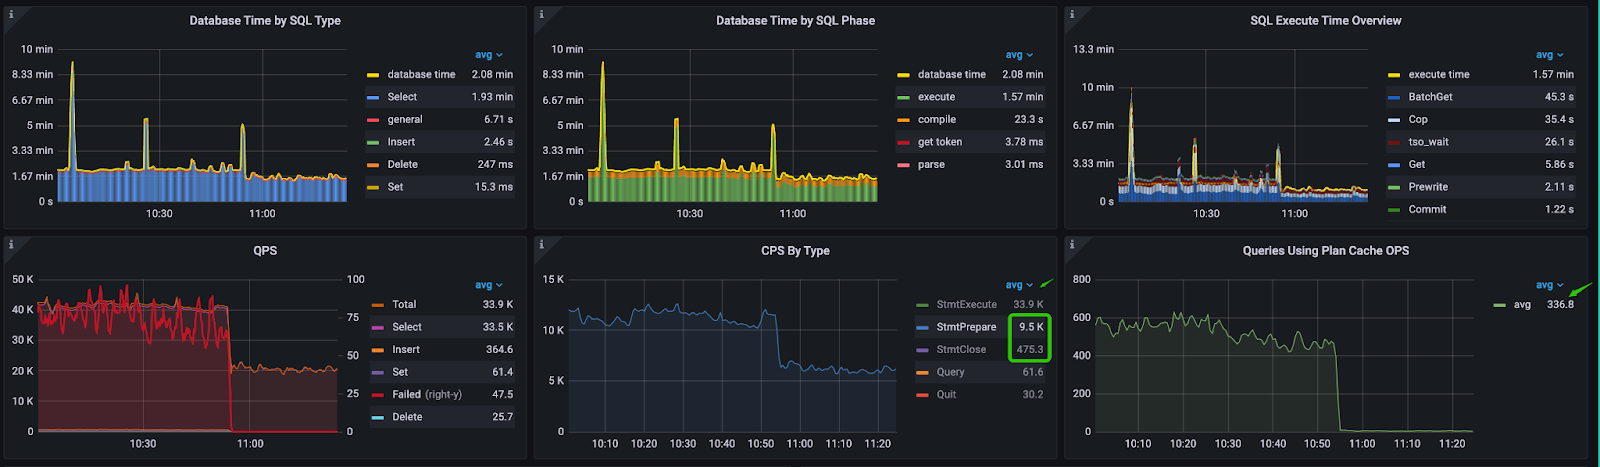
Commands per second (CPS) by type
The heap profile chart shows the memory allocation is from the parse and compile phases.
Suboptimal Query Patterns
The query pattern is mostly batch point query by primary key. For example:
SELECT
  `from_id`,
  `score`,
  TYPE,
  `to_id`,
  STATUS
FROM
  `relationship`
WHERE
  (
    `from_id` = ?
    AND `to_id` = ?
    AND TYPE = ?
  )
  OR (
    `from_id` = ?
    AND `to_id` = ?
    AND TYPE = ?
  )
…
After checking the application code with the user, we found that the application did not use a placeholder as expected. Therefore, the application kept sending literal query statements to TiDB. Because every statement is different, the plan cache hit ratio was low.
Therefore, we get the common query pattern:
SELECT * FROM relationship WHERE ( from_id = 101165050 AND to_id = 2247632895 AND type = 1) or ( from_id = 101185050 AND to_id = 2248632895 AND type = 1) or …… ;Simulating the Workload
To further analyze the OOM issue, we needed to simulate the workload. We used Jmeter, a pure Java-based, open-source software designed to load-test functional behaviors and measure performance, to simulate the workload. The simulation testing was conducted with a cluster configuration of twoTiDB (8c48g) instances and three TiKV (8c48g) instances
Memory leaks are typically caused by bad application designs, which could potentially lead to a database memory avalanche. We used specific monitoring metrics to identify such applications in the database. For instance, the CPS by Type panel in TiDB can reveal information about the application’s statement preparation, execution, and closing operations. If there is a gap between a statement’s beginning and closing, it suggests that the statement cannot be cached. This could cause a memory leak in the application. In our test, we simulated these memory leak situations.

Potential memory leak in TiDB
The from_id and to_id were randomly generated, and the SQL statements were different for each execution.
The workload configurations in Jmeter were as follows:

Workload configuration in Jmeter
- Jmeter-workload threads: 200
- JDBC URL: use ServerPrepStmts=true&prepStmtCacheSize=1000
- useServerPrepStmts=true: This parameter enables server-side prepared statements. When this parameter is set to "true," the MySQL server will prepare the SQL statements and cache them, so that they can be executed more efficiently for subsequent requests.
- prepStmtCacheSize=1000: This parameter sets the maximum number of prepared statements the server can cache. In this case, the maximum cache size is set to 1,000 statements.
- The total number of prepared statements for leaking is 200,000 (200 threads * 1,000 statements).
Reproducing the OOM Issue
After we prepared the simulated workload, we were ready to reproduce the OOM issue. The goal of the test was to verify if the GOMEMLIMIT feature, together with TiDB’s built-in memory management features, could mitigate the OOM issue. We simulated four different cases, using different TiDB versions compiled with different Go versions and with different memory limit settings.
Case 1: TiDB 6.1.2 Compiled With Go 1.18
For case 1, we used TiDB v6.1.2 compiled with Go 1.18, which does not support the GOMEMLIMIT feature. We used this case as a benchmark to compare against the other cases. The test was expected to run for 12 hours, during which an OOM error would happen.
Here are the observations:

Case 1: overall CPU and memory usage

Case 1: TiDB Garbage Collection (GC) memory usage
- With PrepStmtCacheSize set to 1000, TiDB ran into an OOM issue after five minutes. The application had no time to close the statements before the OOM happened.
- The maximum memory usage was as high as 46.1 GB. The Go runtime GC could not keep up with the fast memory allocation from prepared statement leakage.
- The application did not use the “?” placeholder, so the queries could not hit the plan cache.
Case 2: TiDB 6.1.3 With GOMEMLIMIT
For test case 2, we used TiDB 6.1.3 compiled with Go 1.19.3. GOMEMLIMIT feature was enabled and set to 40,000 MiB. The test was set to run for 12 hours, and was expected to not cause an OOM. The goal of this case was to verify whether GOMEMLIMIT could eliminate the OOM issue.
Here are the observations:
Case 2: CPS by Type status

Case 2: Overall CPU and memory usage

Case 2: TiDB GC memory usage
- No OOM occurred during the 12-hour test. The maximum memory usage was 39.1 GB. GOMEMLIMIT successfully limited the memory usage, so TiDB wouldn't be out of memory.
- The TiDB GC memory usage dashboard shows that the memory usage is relatively consistent, which also means no OOM was going to happen.
- The application did not use the “?” placeholder, so no queries hit the plan cache.
Case 3: TiDB 6.5.0 Without GOMEMLIMIT
For test case 3, we used TiDB 6.5.0 compiled in Go 1.19.3. The test was set to run for 12 hours, and it was expected to not cause an OOM error. Unlike the earlier versions, TiDB 6.5.0 has a global memory limit enabled by default. This release also introduced a system variable `tidb_server_memory_limit` to set the memory usage threshold of a tidb-server instance to avoid OOM. The goal of this case was to verify how TiDB’s built-in memory management features could effectively mitigate the OOM issue.
Here are the observations:

Case 3: Performance overview

Case 3: CPS by Type

Case 3: TiDB memory usage

Case 3: TiDB GC memory usage
- The TiDB memory usage dashboard shows that no OOM error occurred during the 12-hour test. The memory usage is relatively consistent, which also means TiDB would not going to be out of memory.
- The maximum memory was 46.9 GB. The built-in global memory limiter of TiDB 6.5 successfully limited memory usage.
- The application did not use the “?” as the placeholder, so no queries hit the plan cache.
Case 4: TiDB 6.1.2 With Placeholder
For test case 4, we used TiDB 6.1.2 compiled with Go 1.18. The application used the "?" placeholder so that queries could hit the plan cache. The test was expected to not cause an OOM. The goal of this case was to show how plan cache can improve performance and reduce the risk of OOM.
Here are the observations:

Case 4: Performance overview dashboard

Case 4: TiDB memory usage

Case 4: TiDB GC memory usage
- Both the TiDB memory usage and TiDB GC memory usage dashboards show that no OOM error occurred during the test. The maximum memory usage was 2.38 GB, which was 1/20th of that in case 3. Additionally, the QPS was 2.9 K, which is over 20 times more than that of case 3.
Conclusion
GOMEMLIMIT in combination with Go 1.19.3 can effectively mitigate OOM errors in TiDB. Upgrading to recommended versions of TiDB such as TiDB 6.5 and configuring memory quota variables could also help.
Root causes of OOM include suboptimal application query patterns, inability to hit the plan cache, and a lack of overall memory control in previous versions of Golang. Therefore, it is always important for developers to follow best practices to improve stability and performance. These practices include using optimal query patterns and fully utilizing the TiDB plan cache. Last but not the least, an optimized application design is always the ultimate solution to OOM.
If you have comments or questions about this article, or just want to learn more about TiDB, join our community on Slack and the TiDB Forum to share your thoughts and feedback.
Opinions expressed by DZone contributors are their own.
Comments