HTML5 Geolocation API to Measure Speed and Heading of Your Car
Join the DZone community and get the full member experience.
Join For Free
in this article we'll show you how you can use the
w3c geolocation api
to measure the speed and the heading of your car while driving. this
article further uses svg to render the speed gauge and heading compass.
what we'll create in this article is the following:
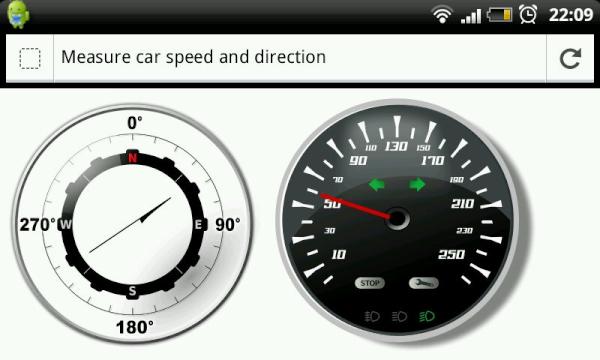
here you can see two gauges. one will show the heading you're driving to, and the other shows the speed in kilometers. you can test this out yourself by using the following link: open this in gps enable device . once opened the browser will probably ask you to allow access to your location. if you enable this and start moving, you'll see the two gauges move appropriately.
getting all this to work is actually very easy and consists of the following steps:
- alter the svg images so we can rotate the needle and add to page.
- use the geolocation api to determine the current speed and heading
- update the needle based on the current and previous value
we'll start with the svg part.
alter the svg images so we can rotate the needle and add to page
for the images i decided to use svg. svg has the advantage that it can scale without losing detail, and you can easily manipulate and animate the various parts of a svg image. both the svg images were copied from openclipart.org :
these are vector graphics, both created using illustrator. before we can rotate the needles in these images we need to make a couple of small changes to the svg code. with svg you can apply matrix transformations to each svg element, with this you can easily rotate, skew, scale or translate a component. besides the matrix transformation you can also apply the rotation and translation directly using the translate and rotate keywords. in this example i've used the translaten and rotate functions directly.
when working with these functions you have to take into account that the rotate function doesn't rotate around the center of the component, it rotates around point 0,0. so we need to make sure that for our needles the point we want to rotate around is set at 0,0. without diving into too much details, i removed the two needles from the image, and added them as a seperate group to the svg image. i then made sure the needles we're drawn relative to the 0,0 point i wanted to rotate around. for the speedometer the needle is now defined as this:
<g transform="translate(171,157) rotate(45)" id="speed">
   <rect
       y="0"
       x="-2.5"
       height="100"
       width="5"
       id="rect5532"
       style="fill:url(#lineargradient5547);fill-opacity:1;stroke:none"
       />
   </g>
and for the compass the needle is defined like this:
<path
         transform="translate(225,231) rotate(135)"
         sodipodi:nodetypes="ccccc"
         id="compass"
         d="m -4.21,88
            l -4.21,-88
            c -2.77,-72
              -1.93,-35
              4.21,-20
            l -4.21,-21
            l -4.21,88 z"
         style="fill:#000000;fill-rule:evenodd;stroke:#000000;stroke-width:2;stroke-linecap:round;stroke-linejoin:round;
                     stroke-miterlimit:4;stroke-dasharray:none;stroke-opacity:1" />
if you know how to read svg, you can see that these figures are now
drawn around their rotation point (the bottom center for the speedomoter
and the center for the compass). as you can see we also added a
specific id for both these elements. this way we can reference them
directly from our javascript later on and update the transform property
from a jquery animation.
next we just need to add these to the page. for this i used
d3.js
, which has all kinds of helper functions for svg and which you can use to load these elements like this:
function loadgraphics() {
    d3.xml("assets/compass.svg", "image/svg+xml", function(xml) {
        document.body.appendchild(xml.documentelement);
    });

    d3.xml("assets/speed.svg", "image/svg+xml", function(xml) {
        document.body.appendchild(xml.documentelement);
    });

}
and with this we've got our visualization components ready.
use the geolocation api to determine the current speed and heading
the next step is using the geolocation api to access the speed and heading properties. you can get this information from the position object that is provided to you by this api:
interface position {
    readonly attribute coordinates coords;
    readonly attribute domtimestamp timestamp;
  };
this object has a coordinate object that contains the information we're looking for:
interface coordinates {
    readonly attribute double latitude;
    readonly attribute double longitude;
    readonly attribute double? altitude;
    readonly attribute double accuracy;
    readonly attribute double? altitudeaccuracy;
    readonly attribute double? heading;
    readonly attribute double? speed;
  };
a lot of useful attributes, but we're only interested in these last
two. the heading (from 0 to 360) shows the direction we're moving in,
and the speed in meters per second is, as you've probably guessed, the
speed we're moving at.
there are two different options to get these values. we can poll
ourselves for these values (e.g. setinterval) or we can wait wacth our
position. in this second case you automatically recieve an update. in
this example we use the second approach:
function initgeo() {
    navigator.geolocation.watchposition(
        geosuccess,
        geofailure,
        {
            enablehighaccuracy:true,
            maximumage:30000,
            timeout:20000
        }
    );

    //movespeed(30);
    //movecompassneedle(56);
}

var count = 0;
function geosuccess(event) {

    $("#debugoutput").text("geosuccess: " + count++ + " : " + event.coords.heading + ":" + event.coords.speed);

    var heading = event.coords.heading;
    var speed = event.coords.speed;

    if (heading != null && speed !=null && speed > 0) {
       movecompassneedle(heading);
    }

    if (speed != null) {
        // update the speed
        movespeed(speed);
    }
}
with this piece of code, we register a callback function on the watchposition. we also add a couple of properties to the watchposition function. with these properties we tell the api to use gps (enablehighaccuracy) and set some timeout and caching values. whenever we receive an update from the api the geosuccess function is called. this function recieves a position object (shown earlier) that we use to access the speed and the heading. based on the value of the heading and the speed we update the compass and the speedomoter.
update the needle based on the current and previous value
to update the needles we use jquery animations for the easing. normally you use a jquery animation to animatie css properties of an object, but you can also use this to animate arbitrary properties. to animate the speedomoter we use the following:
var currentspeed = {property: 0};
function movespeed(speed) {

    // we use a svg transform to move to correct orientation and location
    var translatevalue  = "translate(171,157)";
    // to is in the range of 45 to 315, which is 0 to 260 km
    var to = {property: math.round((speed*3.6/250) *270) + 45};

    // stop the current animation and run to the new one
    $(currentspeed).stop().animate(to, {
        duration: 2000,
        step: function() {
            $("#speed").attr("transform", translatevalue
                + " rotate(" + this.property + ")")
        }
    });
}
we create a custom object, currentspeed, with a single property. this property is set to the rotate ratio that reflects the current speed. next, this property is used in a jquery animation. note that we stop any existing animations, should we get an update when the current animation is still running. in the step property of the animation we set the transfrom value of the svg element. this will rotate the needle, in two seconds, from the old value to the new value.
and to animate the compass we do pretty much the same thing:
var currentcompassposition =  {property: 0};
function movecompassneedle(heading) {

    // we use a svg transform to move to correct orientation and location
    var translatevalue = "translate(225,231)";
    var to = {property: heading};

    // stop the current animation and run to the new one
    $(currentcompassposition).stop().animate(to, {
        duration: 2000,
        step: function() {
            $("#compass").attr("transform", translatevalue
                + " rotate(" + this.property + ")")
        }
    });
}
there is a smal bug i ran into with this setup. sometimes my phone lost its gps signal (running firefox mobile), and that stopped the dials moving. refreshing the webpage was enough to get things started again however. i might change this to actively pull the information using the getcurrentlocation api call, to see whether that works better.
another issue is that there is no way, at least that i found, for you to disable the phone entering sleep mode from the browser. so unless you configure your phone to not go to sleep, the screen will go black.
Published at DZone with permission of Jos Dirksen. See the original article here.
Opinions expressed by DZone contributors are their own.
Comments