DZone
Thanks for visiting DZone today,
Edit Profile
  • Manage Email Subscriptions
  • How to Post to DZone
  • Article Submission Guidelines
Sign Out View Profile
  • Post an Article
  • Manage My Drafts
Over 2 million developers have joined DZone.
Log In / Join
Please enter at least three characters to search
Refcards Trend Reports
Events Video Library
Refcards
Trend Reports

Events

View Events Video Library

Zones

Culture and Methodologies Agile Career Development Methodologies Team Management
Data Engineering AI/ML Big Data Data Databases IoT
Software Design and Architecture Cloud Architecture Containers Integration Microservices Performance Security
Coding Frameworks Java JavaScript Languages Tools
Testing, Deployment, and Maintenance Deployment DevOps and CI/CD Maintenance Monitoring and Observability Testing, Tools, and Frameworks
Culture and Methodologies
Agile Career Development Methodologies Team Management
Data Engineering
AI/ML Big Data Data Databases IoT
Software Design and Architecture
Cloud Architecture Containers Integration Microservices Performance Security
Coding
Frameworks Java JavaScript Languages Tools
Testing, Deployment, and Maintenance
Deployment DevOps and CI/CD Maintenance Monitoring and Observability Testing, Tools, and Frameworks

Because the DevOps movement has redefined engineering responsibilities, SREs now have to become stewards of observability strategy.

Apache Cassandra combines the benefits of major NoSQL databases to support data management needs not covered by traditional RDBMS vendors.

The software you build is only as secure as the code that powers it. Learn how malicious code creeps into your software supply chain.

Generative AI has transformed nearly every industry. How can you leverage GenAI to improve your productivity and efficiency?

Related

  • Best Gantt Chart Libraries for React
  • Using Java Class Extension Library for Data-Oriented Programming - Part 2
  • Using Java Class Extension Library for Data-Oriented Programming
  • Java 23: What Developers Need to Know

Trending

  • The Role of AI in Identity and Access Management for Organizations
  • Developers Beware: Slopsquatting and Vibe Coding Can Increase Risk of AI-Powered Attacks
  • Implementing API Design First in .NET for Efficient Development, Testing, and CI/CD
  • Supervised Fine-Tuning (SFT) on VLMs: From Pre-trained Checkpoints To Tuned Models
  1. DZone
  2. Coding
  3. Java
  4. Integrating Chart JS Library With Java

Integrating Chart JS Library With Java

By 
Sandeep Patel user avatar
Sandeep Patel
·
Jun. 25, 13 · Interview
Likes (0)
Comment
Save
Tweet
Share
39.1K Views

Join the DZone community and get the full member experience.

Join For Free
  • "Chart JS Library" provides API for drawing different charts.
  • Drawing is based on HTML CANVAS Element.
  • Download Link:-
         http://www.chartjs.org/
  • In this Demo, "We will draw a Radar Chart .The Student  input data is JSON in nature.The Servlet returns the JSON data when called by Jquery Ajax method.The Student Java class object is converted to JSON representation using GSON Library".
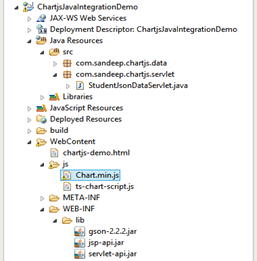
  • The Java web project structure,
 

  • The Student Servlet StudentJsonDataServlet.java ,

    package com.sandeep.chartjs.servlet;
     
    import java.io.IOException;
    import java.util.ArrayList;
    import java.util.List;
     
    import javax.servlet.ServletException;
    import javax.servlet.annotation.WebServlet;
    import javax.servlet.http.HttpServlet;
    import javax.servlet.http.HttpServletRequest;
    import javax.servlet.http.HttpServletResponse;
     
    import com.google.gson.Gson;
    import com.sandeep.chartjs.data.Student;
     
    @WebServlet("/StudentJsonDataServlet")
    public class StudentJsonDataServlet extends HttpServlet {
     
     private static final long serialVersionUID = 1L;
     
     public StudentJsonDataServlet() {
      super();
     }
     
     protected void doGet(HttpServletRequest request,
       HttpServletResponse response) throws ServletException, IOException {
     
      List<Student> listOfStudent = getStudentData();
     
      Gson gson = new Gson();
     
      String jsonString = gson.toJson(listOfStudent);
     
      response.setContentType("application/json");
     
      response.getWriter().write(jsonString);
     
     }
     
     private List<Student> getStudentData() {
     
      List<Student> listOfStudent = new ArrayList<Student>();
      Student s1 = new Student();
      s1.setName("Sandeep");
      s1.setComputerMark(75);
      s1.setMathematicsMark(26);
      s1.setGeographyMark(91);
      s1.setHistoryMark(55);
      s1.setLitratureMark(36);
      listOfStudent.add(s1);
     
      return listOfStudent;
     }
    }

  • The HTML markup chartjs-demo.html,

    <html>
     <head>
      <title>Chart JS Library Demo</title>
      <style>
       
      </style>
     </head>
     <body>
       
      <canvas id="canvas" height="500" width="500"></canvas>
       
      <script src="http://ajax.googleapis.com/ajax/libs/jquery/1.9.1/jquery.min.js"></script>
      <script type="text/javascript" src="./js/Chart.min.js"></script>
      <script type="text/javascript" src="./js/ts-chart-script.js"></script>
       
     </body>
    </html>
  • The java script file for radar chart ts-chart-script.js,

    var TUTORIAL_SAVVY ={
              
      /*Makes the AJAX calll (synchronous) to load a Student Data*/
      loadStudentData : function(){
       
       var formattedstudentListArray =[];
        
        $.ajax({
          
          async: false,
           
          url: "StudentJsonDataServlet",
           
          dataType:"json",
           
          success: function(studentJsonData) {
      
        console.log(studentJsonData);
          
         $.each(studentJsonData,function(index,aStudent){
            
          formattedstudentListArray.push([aStudent.mathematicsMark,aStudent.computerMark,aStudent.historyMark,aStudent.litratureMark,aStudent.geographyMark]);
         });
          }
        });
       return formattedstudentListArray;
      },
      /*Crate the custom Object with the data*/
      createChartData : function(jsonData){
        
      console.log(jsonData);
        
       
       return {
         
        labels : ["Mathematics", "Computers", "History","Literature", "Geography"],
         
        datasets : [
         {
          fillColor : "rgba(255,0,0,0.3)",
           
          strokeColor : "rgba(0,255,0,1)",
           
          pointColor : "rgba(0,0,255,1)",
           
          pointStrokeColor : "rgba(0,0,255,1)",
           
          /*As Ajax response data is a multidimensional array, we have 'student' data in 0th position*/
          data : jsonData[0]
         }
        ]
       };
      },
      /*Renders the Chart on a canvas and returns the reference to chart*/
      renderStudenrRadarChart:function(radarChartData){
      
       var context2D = document.getElementById("canvas").getContext("2d"),
        
        myRadar = new Chart(context2D).
         
                Radar(radarChartData,{
                  
                   scaleShowLabels : false,
                    
                   pointLabelFontSize : 10
            });
                 
             
        return myRadar;
      },
      /*Initalization Student render chart*/
      initRadarChart : function(){
         
       var studentData = TUTORIAL_SAVVY.loadStudentData();
        
        chartData = TUTORIAL_SAVVY.createChartData(studentData);
         
        radarChartObj = TUTORIAL_SAVVY.renderStudenrRadarChart(chartData);
         
      }
    };
     
     
    $(document).ready(function(){
       
     TUTORIAL_SAVVY.initRadarChart();
    });
    • The response Json data format for student,

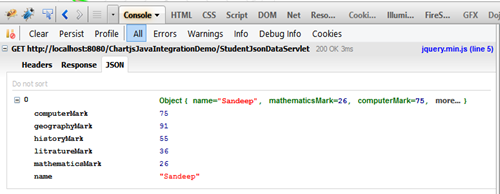
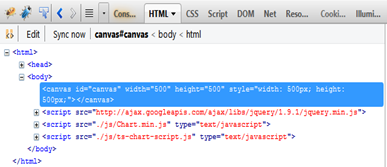
    • The Firebug console shows DOM Element,

    • The output in browser will look like,This radar chart shows the a student('sandeep') marks in different subject,


Chart Java (programming language) Library

Published at DZone with permission of Sandeep Patel, DZone MVB. See the original article here.

Opinions expressed by DZone contributors are their own.

Related

  • Best Gantt Chart Libraries for React
  • Using Java Class Extension Library for Data-Oriented Programming - Part 2
  • Using Java Class Extension Library for Data-Oriented Programming
  • Java 23: What Developers Need to Know

Partner Resources

×

Comments
Oops! Something Went Wrong

The likes didn't load as expected. Please refresh the page and try again.

ABOUT US

  • About DZone
  • Support and feedback
  • Community research
  • Sitemap

ADVERTISE

  • Advertise with DZone

CONTRIBUTE ON DZONE

  • Article Submission Guidelines
  • Become a Contributor
  • Core Program
  • Visit the Writers' Zone

LEGAL

  • Terms of Service
  • Privacy Policy

CONTACT US

  • 3343 Perimeter Hill Drive
  • Suite 100
  • Nashville, TN 37211
  • support@dzone.com

Let's be friends:

Likes
There are no likes...yet! 👀
Be the first to like this post!
It looks like you're not logged in.
Sign in to see who liked this post!