Why and How To Integrate Elastic APM in Apache JMeter
Explore how and why to integrate Elastic APM to add the notion of pages from JMeter in Kibana APM dashboards and how to use the jmeter-elastic-apm tool.
Join the DZone community and get the full member experience.
Join For FreeThe Advantages of Elastic APM for Observing the Tested Environment
My first use of the Elastic Application Performance Monitoring (Elastic APM) solution coincides with projects that were developed based on microservices in 2019 for the projects on which I was responsible for performance testing.
At that time (2019) the first versions of Elastic APM were released.
I was attracted by the easy installation of agents, the numerous protocols supported by the Java agent (see Elastic supported technologies) including the Apache HttpClient used in JMeter and other languages (Go, .NET, Node.js, PHP, Python, Ruby), and the quality of the dashboard in Kibana for the APM. I found the information displayed in the Kibana APM dashboards to be relevant and not too verbose. The Java agent monitoring is simple but displays essential information on the machine's OS and JVM. The open-source aspect and the free solution for the main functions of the tool were also decisive.
I generalize the use of the Elastic APM solution in performance environments for all projects. With Elastic APM, I have the timelines of the different calls and exchanges between web services, the SQL queries executed, the exchange of messages by JMS file, and monitoring. I also have quick access to errors or exceptions thrown in Java applications.
Why Integrate Elastic APM in Apache JMeter
By adding Java APM Agents to web applications, we find the services called timelines in the Kibana dashboards. However, we remain at a REST API call level mainly, because we do not have the notion of a page.
For example, page PAGE01 will make the following API calls:
/rest/service1
/rest/service2
/rest/service3
On another page, PAGE02 will make the following calls:
/rest/service2
/rest/service4
/rest/service5
/rest/service6
The third page, PAGE03, will make the following calls:
/rest/service1
/rest/service2
/rest/service4
In this example, service2 is called on 3 different pages and service4 in 2 pages.
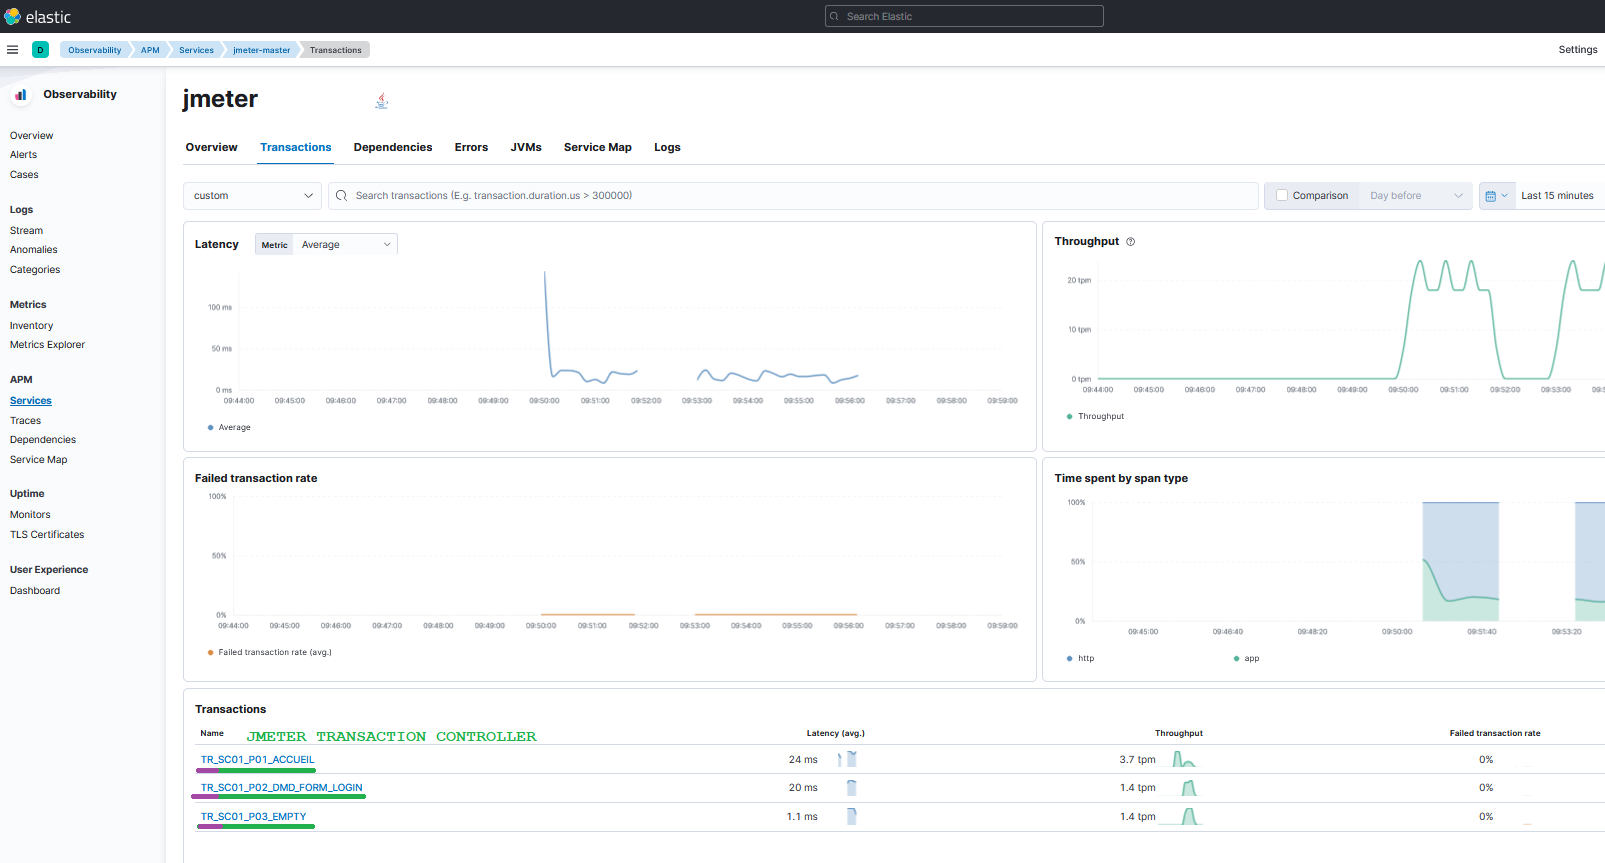
If we look in the Kibana dashboard for service2, we will find the union of the calls of the 3 calls corresponding to the 3 pages, but we don't have the notion of a page.
We cannot answer "In this page, what is the breakdown of time in the different REST calls," because for a user of the application, the notion of page response time is important.
The goal of the jmeter-elastic-apm tool is to add the notion of an existing page in JMeter in the Transaction Controller. This starts in JMeter by creating an APM transaction, and then propagating this transaction identifier (traceparent) with the Elastic agent to an HTTP REST request to web services because the APM Agent recognizes the Apache HttpClient library and can instrument it.
In the HTTP request, the APM Agent will add the identifier of the APM transaction to the header of the HTTP request. The headers added are traceparent and elastic-apm-traceparent.
We start from the notion of the page in JMeter (Transaction Controller) to go to the HTTP calls of the web application (gestdoc) hosted in Tomcat.
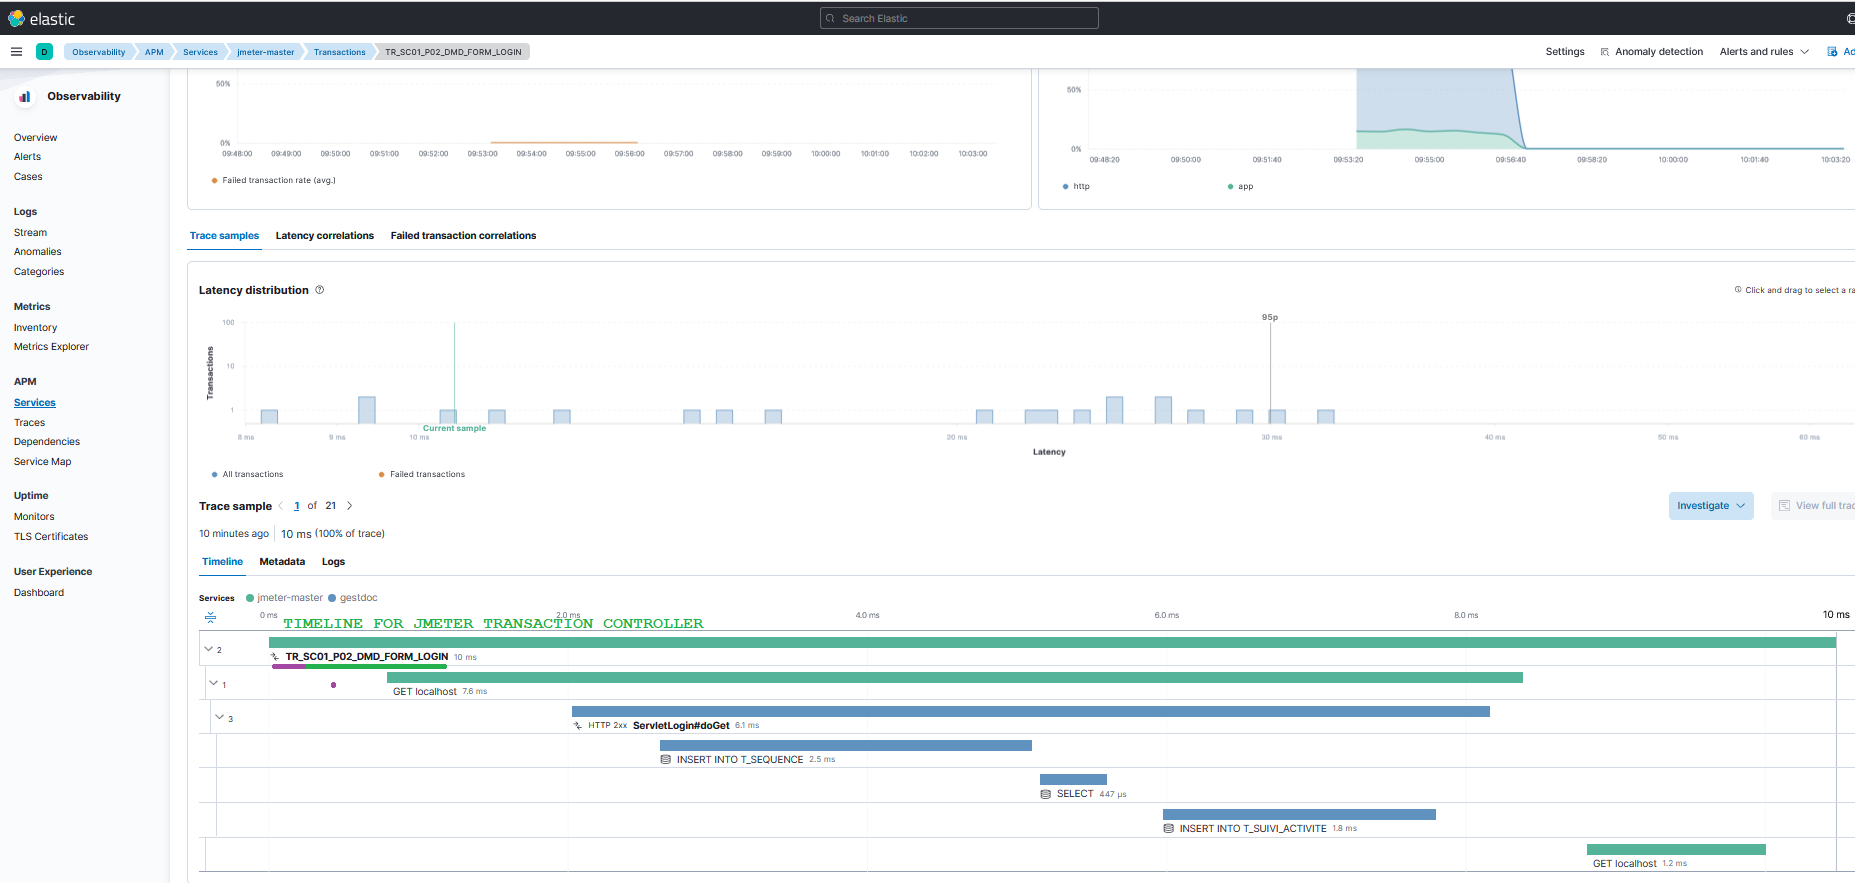
In the case of an application composed of multi-web services, we will see in the timeline the different web services called in HTTP(s) or JMS and the time spent in each web service.
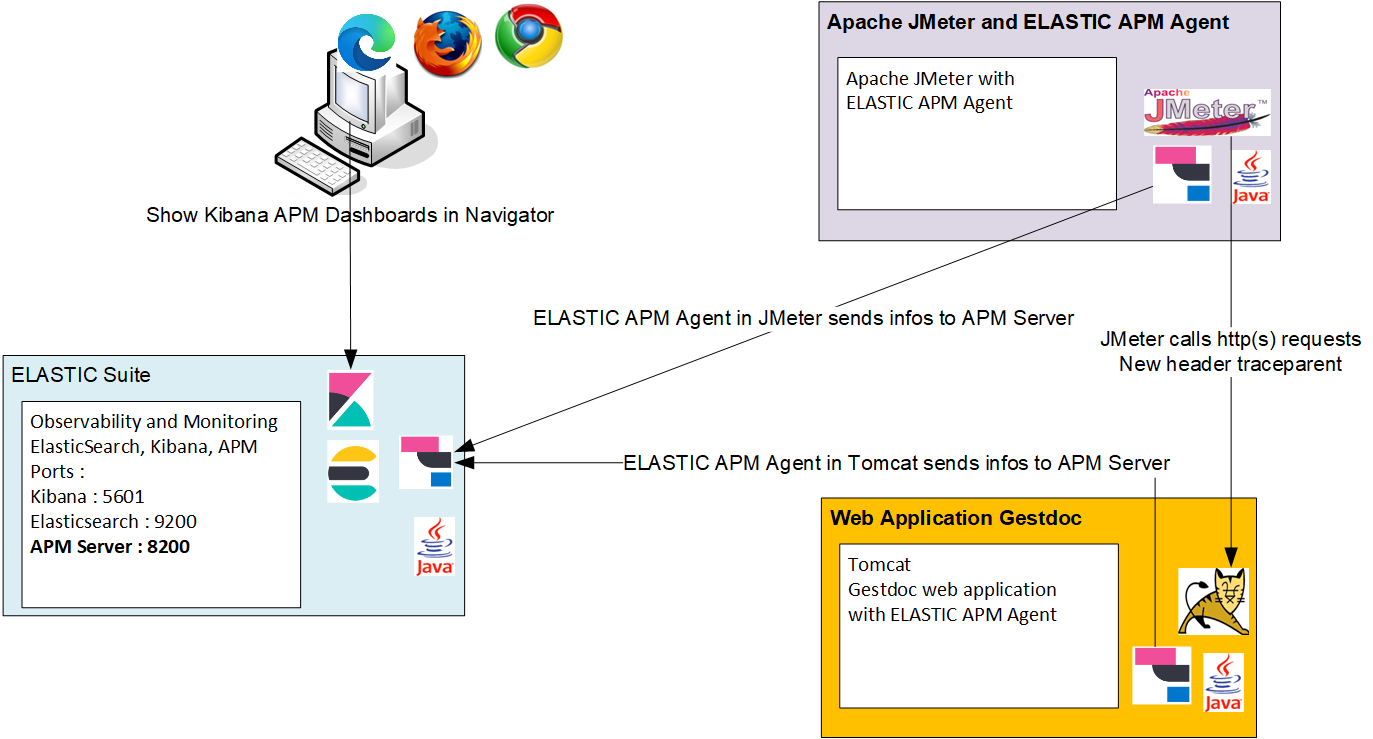
This is an example of technical architecture for a performance test with Apache JMeter and Elastic APM Agent to test a web application hosted in Apache Tomcat.
How the jmeter-elastic-apm Tool Works
jmeter-elastic-apm adds Groovy code before a JMeter Transaction Controller to create an APM transaction before a page.
In the JMeter Transaction Controller, we find HTTP samplers that make REST HTTP(s) calls to the services. The Elastic APM Agent automatically adds a new traceparent header containing the identifier of the APM transaction because it recognizes the Apache HttpClient of the HTTP sampler.
The Groovy code terminates the APM transaction to indicate the end of the page.
The jmeter-elastic-apm tool automates the addition of Groovy code before and after the JMeter Transaction Controller.
The jmeter-elastic-apm tool is open source on GitHub (see link in the Conclusion section of this article).
This JMeter script is simple with 3 pages in 3 JMeter Transaction Controllers.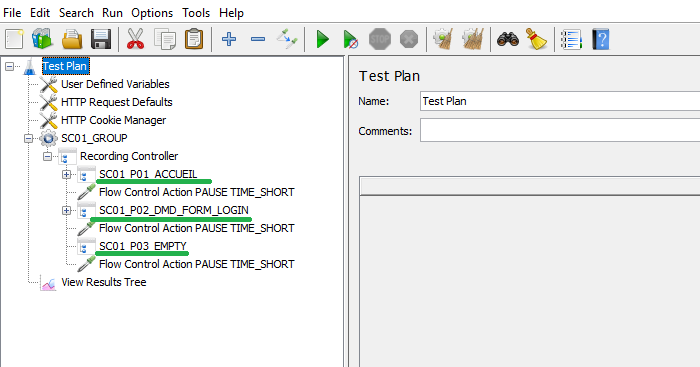
After launching the jmeter-elastic-apm action ADD tool, the JMeter Transaction Controllers are surrounded by Groovy code to create an APM transaction before the JMeter Transaction Controller and close the APM transaction after the JMeter Transaction Controller.
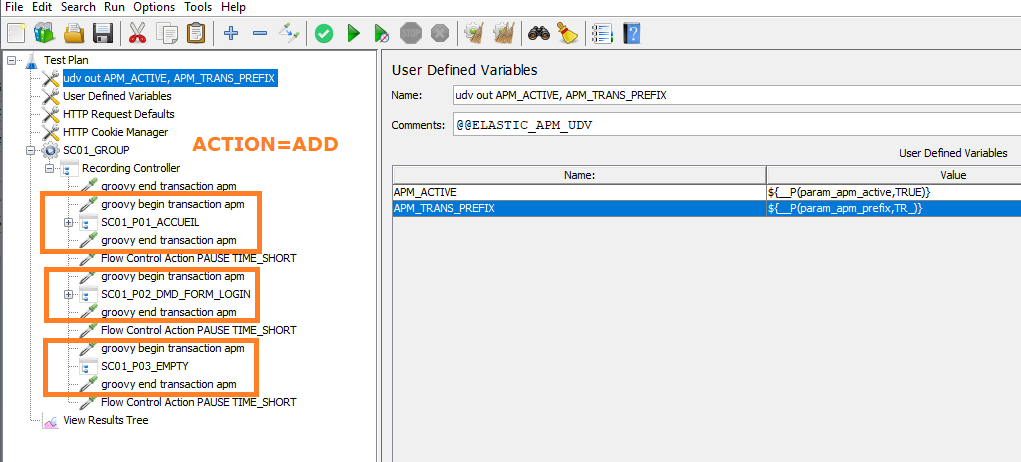
In the “groovy begin transaction apm” sampler, the Groovy code calls the Elastic APM API (simplified version):
Transaction transaction = ElasticApm.startTransaction();
Scope scope = transaction.activate();
transaction.setName(transactionName); // contains JMeter Transaction Controller Name
In the “groovy end transaction apm” sampler, the groovy code calls the ElasticApm API (simplified version):
transaction.end();Configuring Apache JMeter With the Elastic APM Agent and the APM Library
Start Apache JMeter With Elastic APM Agent and Elastic APM API Library
- Declare the Elastic APM Agent URLto find the APM Agent:
- Add the ELASTIC APM Agent somewhere in the filesystem (could be in the
<JMETER_HOME>\libbut not mandatory). - In
<JMETER_HOME>\bin, modify thejmeter.batorsetenv.bat. - Add Elastic APM configuration like so:
- Add the ELASTIC APM Agent somewhere in the filesystem (could be in the
set APM_SERVICE_NAME=yourServiceName
set APM_ENVIRONMENT=yourEnvironment
set APM_SERVER_URL=http://apm_host:8200

set JVM_ARGS=-javaagent:<PATH_TO_AGENT_APM_JAR>\elastic-apm-agent-<version>.jar -Delastic.apm.service_name=%APM_SERVICE_NAME% -Delastic.apm.environment=%APM_ENVIRONMENT% -Delastic.apm.server_urls=%APM_SERVER_URL%
2. Add the Elastic APM library:
- Add the Elastic APM API library to the
<JMETER_HOME>\lib\apm-agent-api-<version>.jar. - This library is used by JSR223 Groovy code.
- Use this URL to find the APM library.
Recommendations on the Impact of Adding Elastic APM in JMeter
The APM Agent will intercept and modify all HTTP sampler calls, and this information will be stored in Elasticsearch.
It is preferable to voluntarily disable the HTTP request of static elements (images, CSS, JavaScript, fonts, etc.) which can generate a large number of requests but are not very useful in analyzing the timeline.
In the case of heavy load testing, it's recommended to change the elastic.apm.transaction_sample_rate parameter to only take part of the calls so as not to saturate the APM Server and Elasticsearch.
This elastic.apm.transaction_sample_rate parameter can be declared in <JMETER_HOME>\jmeter.bat or setenv.bat but also in a JSR223 sampler with a short Groovy code in a setUp thread group.
Groovy code records only 50% samples:
import co.elastic.apm.api.ElasticApm;
// update elastic.apm.transaction_sample_rate
ElasticApm.setConfig("transaction_sample_rate","0.5");
Conclusion
The jmeter-elastic-apm tool allows you to easily integrate the Elastic APM solution into JMeter and add the notion of a page in the timelines of Kibana APM dashboards.
Elastic APM + Apache JMeter is an excellent solution for understanding how the environment works during a performance test with simple monitoring, quality dashboards, time breakdown timelines in the different distributed application layers, and the display of exceptions in web services.
Over time, the Elastic APM solution only gets better. I strongly recommend it, of course, in a performance testing context, but it also has many advantages in the context of a development environment used for developers or integration used by functional or technical testers.
Links
Opinions expressed by DZone contributors are their own.
Comments