Integration of C-STAT Code Analysis with Automated Jenkins CI Build
Take a look at how you can futher you static code analysis by integrating with Jenkins.
Join the DZone community and get the full member experience.
Join For FreeIntroduction
Most of us are aware there is always a limitation or challenge in setting up CI/CD for embedded software, and we have also seen in some cases there are still no alternate options available, which leads to manual effort and misses in code quality.
In this article, we are going to see one such embedded development tool (IAR Embedded workbench) and how we can integrate C-STAT static code analysis with a continuous integration build (Jenkins), as well as how to set some quality gates with an automated build.
Prerequisites:
a. IAR Embedded Workbench (IDE)
b. C-STAT license
c. Jenkins Setup
IAR Embedded workbench tool provides us the command line execution options to achieve the static code analysis of the IAR project. Now we will see how it works.
IAR Command Line Utility
The IAR system provides us a utility called IarBuild.exe, which is used to perform the analysis in the command line. You can find the IarBuild.exe utility in the installation path as shown below.
C:\Program Files (x86) \IAR Systems\Embedded Workbench 8.1\common\bin\Run Code Analysis:
First navigate to the above path in the command path and execute the below command to analyse the complete project.
IarBuild.exe D:\sample\project\setup\sample.ewp -cstat_analyze DebugWhere,
D:\sample\project\setup\sample.ewp is the path of your IAR project file
-cstat_analyzeis the command to analyzeDebugis the configuration mode of the project
By executing the above command, it will perform the static code analysis for your complete project and the results will be stored in a cstat.db file under the path ...project\setup\Debug\Obj\.
Note The next time you run the code analysis, if you have made any changes to your source code files since the previous analysis, then you must first clear the database to avoid issues due to mixing of old and new data in the database file.
Clear Analysis Results
To clear the database file using the command line, execute the below command,
IarBuild.exe D:\sample\project\setup\sample.ewp -cstat_clean DebugGenerate Report
To generate a report, we can use the IREPORT tool provided by IAR which you can find in the same installation directory. The IREPORT tool is used to produce the HTML report of previous code analyses performed by the C-STAT.
The report represents statistical data both in numbers and as tables. Two different types of reports can be generated:
● An outline that features info regarding, for example, project-wide enabled checks, the total amount of messages, suppressed checks (if any), messages for each check, etc.
● A full report that contains the constant info such as the outline, and additional info regarding all suppressed and non-suppressed messages at the conclusion of the report. The tables can be collapsed and expanded, and the columns can be sorted
To generate the full HTML report, we can execute the below command,
ireport.exe --db D:\sample\project\setup\Debug\Obj\cstat.db --project D:\sample\project \setup\sample.ewp --full --output D:\sample\result.html
The above command contains four parameters:
--db specifies the path of the database file the report is based on
--project specifies the project file
--full generates full report containing information about suppressed and non-suppressed checks.
--output specifies the name of the output result file.
Integrating the C-STAT With Jenkins CI build:
There is no direct plugin or method available to integrate this CSTAT to any CI tools. But we can achieve the custom integration in the below method,
So now we know the commands for analyzing, cleaning and generatingthe report file. Using these command, we can easily write a batch script file (.bat) file and then call this batch file in Jenkins as a pre-build command execution step.
Set Threshold Gateway
We will come across the scenario where we need to define the gateway in the CI build by setting the threshold value for Low, Medium and High issues. If the value is greater then set value, then we can make the build as a failure.
By default, C-STAT doesn’t provide us the option to set this value. But we can achieve this using custom scripting as below.
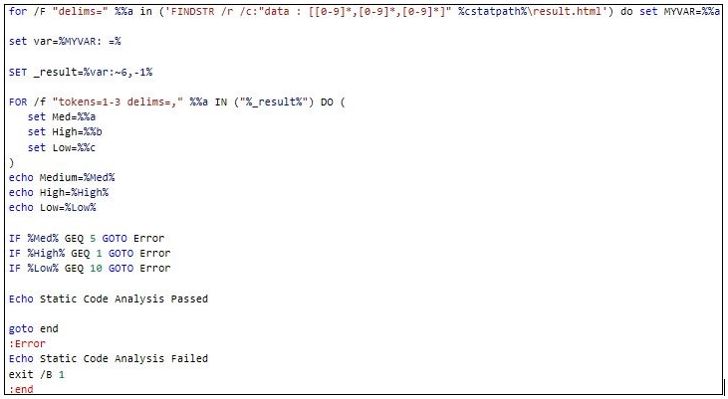
So we can get the HTML report containing the analysis result of Low, medium and high issue count. These values are captured inside the HTML result file in the format data: [0-9, 0-9 ,0-9].
Please refer to the below screen shot of batch scripting to understand how I get these values in a variable and then validate it with sea t threshold value.
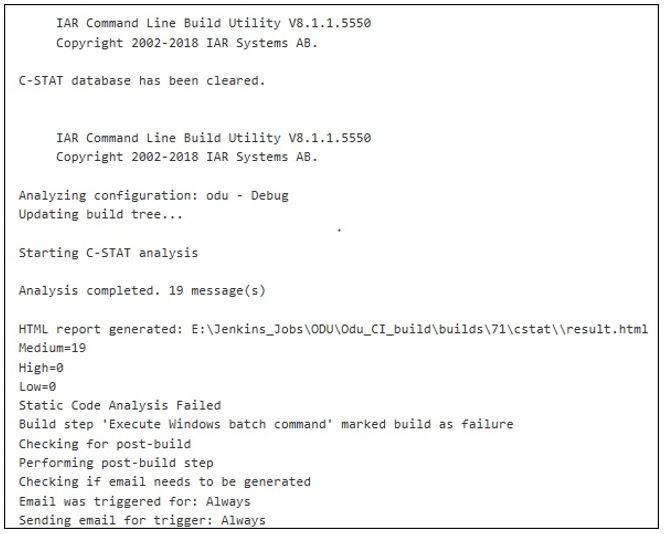
Jenkins Build Result
Given below the build log from Jenkins CI build for your reference. You can see the build is failed due to 19 issues identified as Medium priority.
Conclusion
Here, we have seen how to automate the C-STAT analysis with the Jenkins CI build and how to set the threshold gateway to determine the build status. I hope this blog will be helpful for those who are working with IAR embedded workbench and would like to automate the C-STAT with your CI build system.
Opinions expressed by DZone contributors are their own.
Comments