Is Garbage Collection Consuming High CPU in My Application?
In this article, we will explore a few different approaches to measure the CPU cycles consumed by automatic garbage collection.
Join the DZone community and get the full member experience.
Join For FreeAutomatic garbage collection is a prevalent feature in modern programming languages such as Golang, Node.js, Java, .NET, and Python. While it offers convenience to developers by automatically removing unreferenced objects from memory, it can also result in excessive CPU consumption. As applications continuously create numerous objects, the garbage collector runs continuously in the background to reclaim these objects, consuming a significant number of CPU cycles. However, measuring the exact CPU cycles consumed due to automatic garbage collection can be challenging for many developers. In this article, we will explore a few approaches to measure the CPU cycles consumed by automatic garbage collection.
Approaches To Measure CPU Consumption Caused by GC
GC Log Analysis
Garbage Collection (GC) logs are valuable resources for understanding the behavior and impact of garbage collection in your application. By analyzing these logs, you can gain insights into the CPU consumption caused by garbage collection.
GC logs often contain measurements such as real-time, user time, and sys time, which reflect the time taken by the garbage collector to complete the collection process. Real-time refers to the actual duration of the garbage collection event, while user time and sys time represent the CPU time consumed by user-level and system-level operations during garbage collection.
To determine the total CPU time consumed by garbage collection, you can calculate the sum of the user time and sys time recorded in the GC logs. This metric provides an estimation of the CPU impact caused by garbage collection in your application. One tool that can aid in GC log analysis is GCeasy. When you upload your application’s GC log to GCeasy, it provides helpful visualizations and insights about the CPU consumption caused by garbage collection. For example, GCeasy can generate a ‘CPU Time’ section, which provides a breakdown of the total CPU time consumed due to garbage collection by your application.
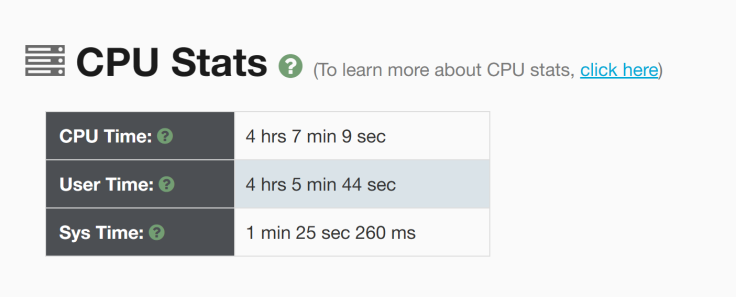
Fig: CPU Time stats reported by GCeasy
By utilizing GC log analysis tools, you can gain valuable insights into the CPU consumption caused by garbage collection in your application. This knowledge enables you to evaluate the impact of garbage collection on your application’s performance and optimize it accordingly.
Monitoring Tools
Monitoring tools offer a broader perspective on CPU consumption and allow you to measure the overall CPU impact of your application, including the CPU consumption Monitoring tools such as ‘top’ offer a holistic approach to measuring CPU consumption in your application, providing insights into the overall CPU usage, including the impact of garbage collection. By utilizing these tools, you can assess the total CPU consumption and identify the specific CPU usage caused by garbage collection.
Here’s a step-by-step process to measure the CPU consumption caused by garbage collection using monitoring tools:
- Run your application with a representative workload, ensuring that you replicate the configurations and workload characteristics of a production environment.
- Utilize monitoring tools like ‘top’ to track and record the overall CPU consumption of your application. This measurement serves as a reference point for comparison.
- Optimize your application to reduce overall CPU consumption by applying the techniques mentioned in this article.
- Execute the workload again and monitor the overall CPU consumption using the same monitoring tool.
- Compare the CPU consumption measurements before and after the optimizations. The difference between these measurements indicates the CPU consumption specifically caused by garbage collection.
By following this approach, you will gain a comprehensive understanding of the CPU impact in your application, encompassing both garbage collection and other processes. Monitoring tools like ‘top’ provide a broader view of CPU usage and help you evaluate the effectiveness of your optimizations in reducing overall CPU consumption. It’s important to note that while monitoring tools can provide valuable insights, combining them with other approaches like GC log analysis enhances your understanding of the specific CPU consumption caused by garbage collection.
CPU Consumption by GC Threads
To gain more fine-grained insights into CPU consumption during garbage collection, you can use troubleshooting tools like yCrash. These tools provide detailed information about CPU consumption at the thread level, including individual GC threads. By analyzing the CPU consumption of these threads, you can identify which GC threads are utilizing significant CPU resources. This information can help you understand the distribution of CPU consumption within the garbage collection process and identify any potential bottlenecks or areas for optimization. With this knowledge, you can fine-tune garbage collection configurations or explore alternative garbage collection algorithms to reduce CPU consumption.
Conclusion
By employing these approaches, you can effectively measure and quantify the CPU consumption caused by garbage collection in your application. This understanding empowers you to make informed decisions and implement optimizations to minimize excessive CPU consumption, enhance performance, and improve the overall efficiency of your application.
Published at DZone with permission of Ram Lakshmanan. See the original article here.
Opinions expressed by DZone contributors are their own.
Comments