Different Garbage Collectors in Java: Exploring the Options
Why are there so many Java GC algorithms? Learn about their strengths, weaknesses, and how to choose the right one for optimal performance.
Join the DZone community and get the full member experience.
Join For FreeGarbage collection in Java is something that just happens: you don’t have to worry about memory management. Or do you?
The garbage collector (GC) runs in the background, quietly doing its work. But this process can have a huge impact on performance. Understanding the concepts of advanced Java GC is invaluable in tuning and troubleshooting applications.
There are seven types of Java Garbage Collectors available in the JVM, some of which are obsolete. This article will look at the details, and compare the strengths and weaknesses of each. It will also look briefly at how you would go about evaluating garbage collection performance.
GC Evaluation Criteria
GC performance is evaluated on two criteria:
- Throughput – Calculated as the percentage of time an application spends on actual work as opposed to time spent on GC;
- Latency – The time during which the GC pauses the application. You should look at average latency times and maximum latency times when you’re evaluating performance.
Comparison of Types of Java Garbage Collectors
The table below gives details of the seven different algorithms, including the Java version where they were introduced, and the versions, if any, that use the algorithm as the default.
| algorithm | comments | introduced | used as default in |
|---|---|---|---|
|
Serial GC |
Original GC algorithm: single-threaded; tends to have long GC pauses; now obsolete |
Java 1.2 |
Java 1.2 to Java 4; also in Java 5 to 8 single-core versions |
|
Parallel GC |
Multi-threaded; Distributed amongst cores; high throughput but long pauses |
Java 5 |
Java 5 to 8 in multi-core versions |
|
CMS GC (Concurrent Mark & Sweep) |
Most work done concurrently; minimizes pauses; no compaction, therefore occasional long pauses for full GC |
Java 4; deprecated in Java 9 and removed in Java 14 |
None |
|
G1 GC (Garbage first) |
Heap is divided into equal-sized regions. Mostly concurrent. Balances between latency and throughput; best for heap size < 32GB |
Java 7 |
Java 8 and above |
|
Shenandoah GC |
Recommended for heap sizes >32GB; has high CPU consumption |
Open JDK 8 and above; Oracle JDK in JDK 11 |
None |
|
ZGC |
Recommended for heap size >32GB; prone to stalls on versions < Java 21 |
Java 11 |
None |
|
Epsilon GC |
This is a do-nothing GC, used only for benchmarking applications with and without GC |
Java 11 |
None |
G1 GC is probably the best algorithm in most cases, unless you have a very large heap (32GB or more). If this is the case, you can use Shenandoah if it is available or ZGC if you’re using Java 21 or later. ZGC can be unstable in earlier versions. Shenandoah may not be stable in the first few Oracle releases.
CMS was deprecated from Java 9 onwards because it didn’t deal well with compacting the heap. Fragmentation over time degraded performance, and resulted in long GC pauses for compaction.
Setting and Tuning the Garbage Collector
The table below shows the types of Java Garbage collectors, along with the JVM switches you’d use to set each of the GC algorithms for an application. It also contains links to tuning guides for each algorithm.
| algorithm | jvm switch to set it | how to tune it: links |
|---|---|---|
|
Serial GC |
-XX:+UseSerialGC |
|
|
Parallel GC |
-XX:+UseParallelGC |
|
|
CMS GC (Concurrent Mark & Sweep) |
-XX:+UseConcMarkSweepGC |
|
|
G1 GC (Garbage first) |
-XX:+UseG1GC |
|
|
Shenandoah GC |
-XX:+UseShenandoahGC |
|
|
ZGC |
-XX:+UseZGC |
|
|
Epsilon GC |
-XX:+UseEpsilonGC |
N/A |
Evaluating GC Performance
Before you commit to an algorithm for your application, it’s best to evaluate its performance. To do so, you’ll need to request a GC log, and then analyze it.
1. Requesting a GC Log
Use JVM command line switches.
For Java 9 or later:
-Xlog:gc*:file=<gc-log-file-path>For Java 8 or earlier:
-XX:+PrintGCDetails -Xloggc:<gc-log-file-path>2. Evaluating the Log
You can open the log with any text editor, but for long-running programs, it could take hours to evaluate it.
The log information looks something like this:
[0.082s][info][gc,heap] Heap region size: 1M
[0.110s][info][gc     ] Using G1
[0.110s][info][gc,heap,coops] Heap address: 0x00000000c8c00000, size: 884 MB, Compressed Oops mode: 32-bit
[0.204s][info][gc,heap,exit ] Heap
[0.204s][info][gc,heap,exit ]  garbage-first heap   total 57344K, used 1024K [0x00000000c8c00000, 0x0000000100000000)
[0.204s][info][gc,heap,exit ]   region size 1024K, 2 young (2048K), 0 survivors (0K)
[0.204s][info][gc,heap,exit ]  Metaspace       used 3575K, capacity 4486K, committed 4864K, reserved 1056768K
[0.204s][info][gc,heap,exit ]   class space    used 319K, capacity 386K, committed 512K, reserved 1048576K
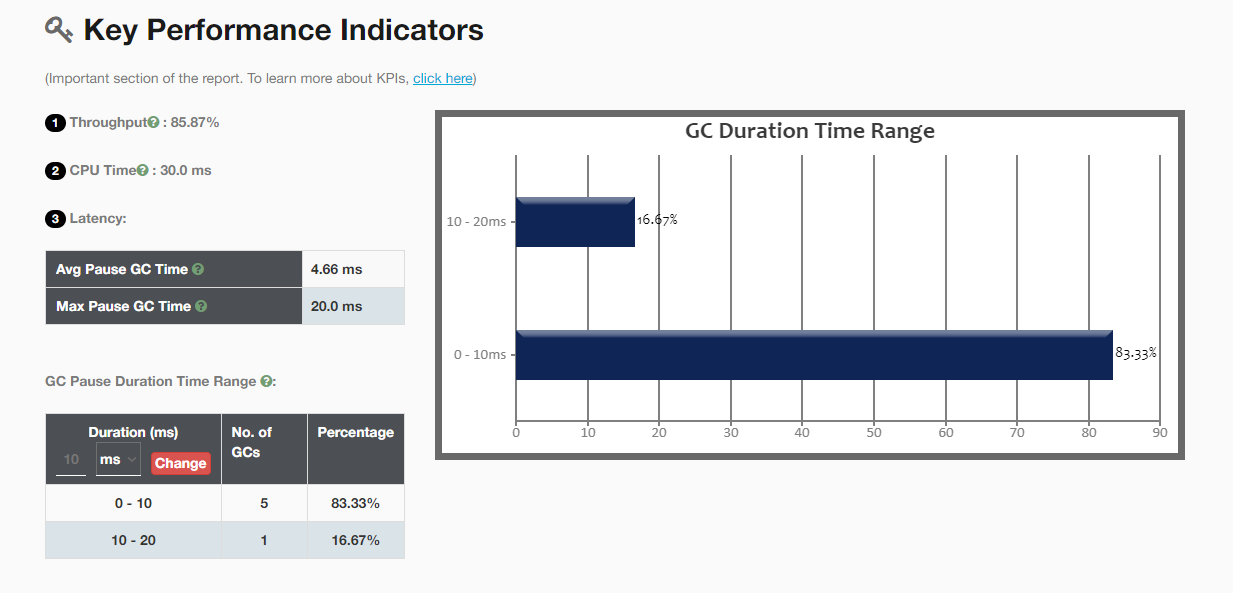
A good choice for quickly obtaining meaningful stats from the GC log is the GCeasy tool. It detects memory leaks, highlights long GC pauses and inefficient GC cycles, as well as making performance tuning recommendations.
Below is a sample of part of the GCeasy report.
Conclusion
In this article, we’ve looked at the different types of Java Garbage collectors, and learned how to invoke each algorithm on the JVM command line. We’ve looked briefly at how to evaluate, monitor, and tune the garbage collector.
G1 GC is a good all-around choice if you're using Java 8 and above. It was still experimental in Java 7, so it may not be stable. If you have a very large heap size, consider Shenandoah or Z. Again, these may not be stable in earlier versions of Java.
CMS was found to be problematic, as in some cases it caused long GC pauses (as much as 5 minutes), and was therefore deprecated and then finally removed from newer versions.
For more information, you may like to read these articles:
Opinions expressed by DZone contributors are their own.
Comments