Understanding G1 GC Log Format
As G1 GC is becoming the default Garbage Collector, its visibility and usage are going to increase dramatically. This article walks through key things that one should know about the G1 GC log format.
Join the DZone community and get the full member experience.
Join For FreeIn Java 9, G1 GC will become the default garbage collector. One of the key features of G1 Garbage collector is its ability to limit the GC pause time (i.e. you can set the desired maximum pause time) without compromising on throughput.
As G1 GC is becoming the default Garbage Collector, its visibility and usage are going to increase dramatically. Thus to tune and troubleshoot G1 GC enabled JVMs, one must have a proper understanding of G1 GC log format. This article walks through key things that one should know about the G1 GC log format. Note: G1 GC log has lot of gory details of all the subtasks that are involved in the GC. To understand and make use of all those gory details, I would recommend using GC log analysis tool - http://gceasy.io/.
Enabling G1 GC Logging
One can turn ON the GC logging by passing following arguments to the JVM:
-Xloggc:/home/gc.log -XX:+PrintGCDetails -XX:+PrintGCDateStampswhere /home/gc.log is the location where GC logs will be written.
Minor GC Event
When a Minor GC event happens, following log statement will be printed in the GC log file:
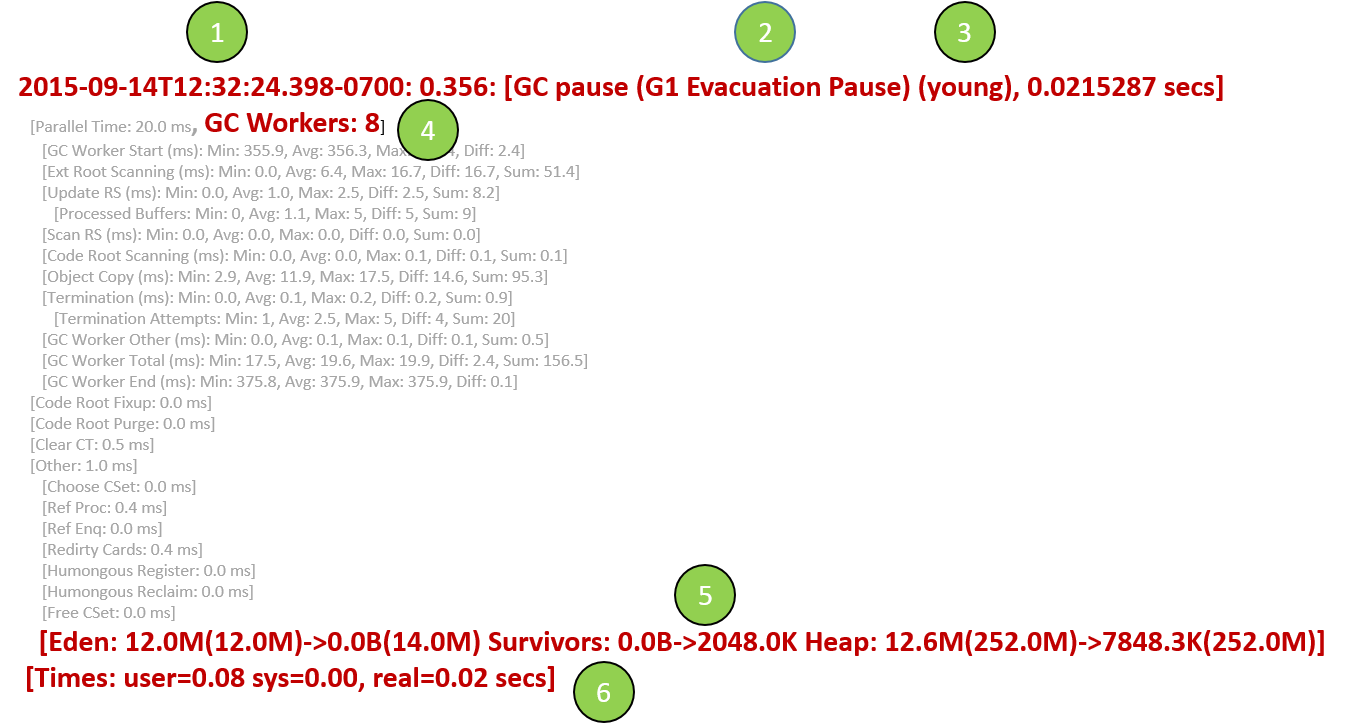
Fig: Young GC event in G1 Garbage Collection Log
- 2015-09-14T12:32:24.398-0700: 0.356 – Here 2015-09-14T12:32:24.398-0700 indicates the time at which this GC event fired. Here 0.356 indicates that 356 milliseconds after the Java process was started this GC event was fired.
- GC pause (G1 Evacuation Pause) — Evacuation Pause is a phase where live objects are copied from one region (young or young + old) to another region.
- (young) – indicates that this is a Young GC event.
- GC Workers: 8 – indicates the number of GC worker threads.
- [Eden: 12.0M(12.0M)->0.0B(14.0M) Survivors: 0.0B->2048.0K Heap: 12.6M(252.0M)->7848.3K(252.0M)] – This line indicates the heap size changes:
- Eden: 12.0M(12.0M)->0.0B(14.0M) - indicates that Eden generation’s capacity was 12mb and all of the 12mb was occupied. After this GC event, young generation occupied size came down to 0. Target Capacity of Eden generation has been increased to 14mb, but not yet committed. Additional regions are added to Eden generation, as demands are made.
- Survivors: 0.0B->2048.0K - indicates that Survivor space was 0 bytes before this GC event. But after the even Survivor size increased to 2048kb. It indicates that objects are promoted from Young Generation to Survivor space.
- Heap: 12.6M(252.0M)->7848.3K(252.0M) – indicates that capacity of heap size was 252mb, in that 12.6mb was utilized. After this GC event, heap utilization dropped to 7848.3kb (i.e. 5mb (i.e. 12.6mb – 7848.3kb) of objects has been garbage collected in this event). And heap capacity remained at 252mb.
- Times: user=0.08, sys=0.00, real=0.02 secs – here note the 'real' time, it indicates this GC event took 0.02 seconds to complete. If you are wondering what is the purpose of ‘user’ and ‘sys’ times, please refer to this article.
Full GC Event
When a Full GC event happens, following log statement will be printed in the GC log file:
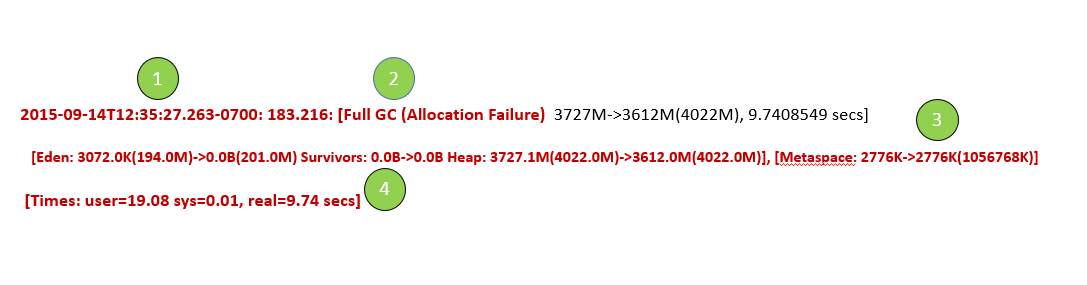
Fig: Full GC event in G1 Garbage Collection Log
- 2015-09-14T12:35:27.263-0700: 183.216 – Here 2015-09-14T12:35:27.263-0700 indicates the time at which this GC event fired. Here 183.216 indicates that 183 seconds after the Java process was started this GC event was fired.
- Full GC (Allocation Failure) – indicates that this is a Full GC event, triggered because of allocation failure. When the heap is fragmented, direct allocations in the Old generation may fail even when there is a lot of free space, this will typically cause Allocation Failure.
- [Eden: 3072.0K(194.0M)->0.0B(201.0M) Survivors: 0.0B->0.0B Heap: 3727.1M(4022.0M)->3612.0M(4022.0M)], [Metaspace: 2776K->2776K(1056768K)]– This line indicates the heap size changes, because of this Full GC event:
- Eden: 3072.0K(194.0M)->0.0B(201.0M) - indicates that Eden generation’s capacity was 194mb, in that 3072kb was occupied. After this GC event, young generation occupied size came down to 0. Target Capacity of Eden generation has been increased to 201mb, but not yet committed. Additional regions are added to Eden generation, as demands are made.
- Survivors: 0.0B->0.0B – indicates that survivor space was 0 bytes before and after this event.
- Heap: 3727.1M(4022.0M)->3612.0M(4022.0M) - indicates that capacity of heap size was 4022mb, in that 3727.1mb was utilized. After this GC event, heap utilization dropped to 3612mb. 115.1mb (i.e. 3727.1 – 3612) of objects has been garbage collected in this event. And heap capacity has remained at 4022mb.
- Metaspace: 2776K->2776K(1056768K) – indicates that before the GC event it’s occupied size was 2776k and after the GC event also it’s occupied size was 2776k. Basically, it implies metaspace utilization remained consistent in this phase. The total capacity of metaspace was 1056768k.
- Times: user=19.08, sys=0.01, real=9.74 secs – here note the 'real' time, it indicates this GC event took 9.74 seconds to complete, which is a very high pause time. If you are wondering what is the purpose of ‘user’ and ‘sys’ times, please refer to this article.
This article gives a high-level overview of G1 GC logs, if you are interested to see graphical visualization & insightful metrics of G1 GC logs, I would recommend using a GC log analysis tool - http://gceasy.io/.
Opinions expressed by DZone contributors are their own.
Comments